Worth Your Weight: Experimental Evidence on the Benefits of Obesity in Low-Income Countries
←
→
Page content transcription
If your browser does not render page correctly, please read the page content below

Worth Your Weight:
          Experimental Evidence on the Benefits of Obesity
                                    in Low-Income Countries
                                             Elisa Macchi∗
                              Please, find the most recent version here.

                                                October 15, 2021

                                                       Abstract
            I study the economic value of obesity - a seemingly irrelevant but unhealthy status symbol
        in poor settings. Leveraging multiple experiments in Kampala (Uganda) randomizing decision-
        makers to see obese and not-obese manipulated portraits, I provide four results: i) obesity is
        perceived as a strong wealth signal, and unrelated to beauty, health…; ii) obesity facilitates access
        to credit: in a real-stake experiment with 146 credit institutions the obesity premium equals raising
        borrowers’ self-reported earnings by 60%; iii) asymmetric information drives the premium, which
        falls significantly with more financial information availability; iv) obesity benefits and value are
        overestimated - inefficiently raising the cost of healthy behaviors.

    ∗
      Department of Economics, MIT. Email: emacchi@mit.edu. I am grateful to my advisors David Yanagizawa-Drott, Lorenzo
Casaburi, Joachim Voth, and Ernst Fehr, as well as to Alberto Alesina, Pietro Biroli, Ben Enke and Nathan Nunn for the
support and encouragement during the course of this project. I also thank Emily Breza, Guy Grossman, Micheal Kremer, Guil-
herme Lichand, Michel Marechal, Gautam Rao, Heather Schofield, Florian Scheuer, Colin Sullivan, Roberto Weber, David Yang
and participants at seminars and conferences at Harvard, Zurich, BREAD, DevPec, NEUDC, and ECBE for helpful discussions
and feedback. Illen Aria and Giulio Molfese created the manipulated portraits. The field experiment would not have been
possible without the invaluable support and cooperation of the Uganda Microfinance Regulatory Authority, of Innovation for
Poverty Action (in particular, Carin Mirovitz, Elly Atuhumuza, Edmund Emulu and Patience Kyomuhendo) and International
Growth Research and Evaluation Center (in particular, Joshua Bwiira and Lenny Gichia). Financial support from the Swiss
National Science Foundation (grant 100018_165616) and the Swiss Re Foundation is gratefully acknowledged. The experiments
were approved by the Ethics Committee of the Department of Economics of the University of Zurich and the Uganda National
Council for Science and Technology. The experiments were preregistered at https://www.socialscienceregistry.org/trials/4806;
https://www.socialscienceregistry.org/trials/4528

                                                             1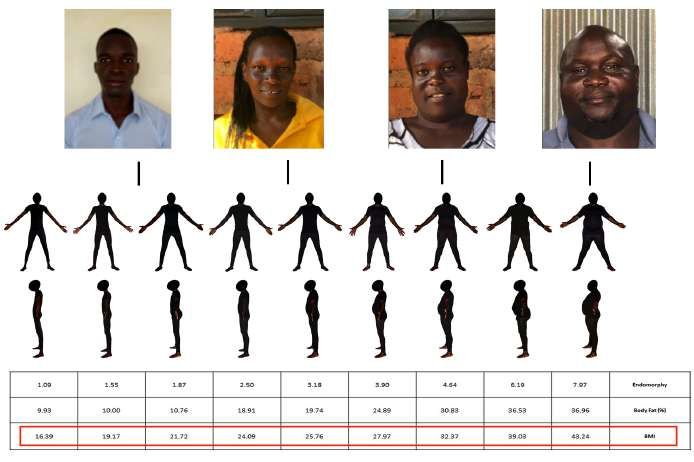
1       Introduction
People are willing to pay to look rich. The theory of conspicuous consumption goes
back to Veblen in 1899. Recent experimental evidence confirms that people pay extra to
acquire status goods (Bursztyn et al., 2017a). Despite the large literature on conspicuous
consumption, we know little of the trade-offs of status investment and especially, we
have no evidence on whether status can lead to benefits in market settings (Bursztyn
and Jensen, 2017).
    In poor countries, conspicuous consumption (Bloch et al., 2004; Rao, 2001) is rela-
tively expensive —e.g., because of kinship taxation (Jakiela and Ozier, 2016; Squires,
2016), and comes at the cost of basic human-capital investment. At the same time,
because screening costs are inefficiently high (Banerjee and Duflo, 2007), reliable wealth
information is very scarce. In this paper, I hypothesize that when asymmetric informa-
tion is large, agents may rely on status signals as imperfect proxies for wealth and thus,
looking rich may lead to benefits in market settings.
    Do seemingly irrelevant status indicators lead to benefits in market settings? If
so, to which extent is it an efficient response to an information extraction problem? To
address these questions, I study experimentally the wealth-signaling value and the credit
market benefits of being obese in Kampala, the capital of Uganda. Obesity in low-income
contexts can signal a person’s status. Historically, prosperity has always meant having
enough money to buy or own food. Today, this is still true in much of the developing
world, where, unlike in richer countries, fat bodies are often positively perceived,1 rich
people are more likely to be obese,2 and there exists a market for weight-gain programs.3
To test for economic benefits, I focus on credit markets, an economically relevant market
—credit constraints are a main barrier to poverty reduction —characterized by pervasive
asymmetric information problems.4
    Cars, clothes or watches may equally serve as a proxy for wealth. I focus on obesity
    1
      Qualitative studies providing evidence of positive perception of fat bodies include: Anderson-Fye
(2004) in Belize; Bosire et al. (2020) in South Africa; Chigbu et al. (2019) in Nigeria; Ettarh et al. (2013)
in Nairobi, Kenya; Holdsworth et al. (2004) in urban Senegal; Popenoe (2012) among Arabs in Niger;
Sobo (1994) in Jamaica.
    2
      Figure J.10 plots obesity prevalence by income quintile and country income level.
    3
      Leblouh or gavage describe the traditional practice, widespread among rich families in Kenya, Mauri-
tania, Morocco, Niger, South Africa, and Uganda, of paying for daughters’ to enter weight-gain programs.
    4
      Lacking technological advancements, such as credit risk models, loan officers face both moral hazard
and adverse selection problems (Karlan and Zinman, 2009). Evidence suggests that perhaps as a response
to imperfect information (Banerjee, 2003) or because of higher returns to capital (De Mel et al., 2008),
rich borrowers are favored in lending decisions in poor countries.

                                                     2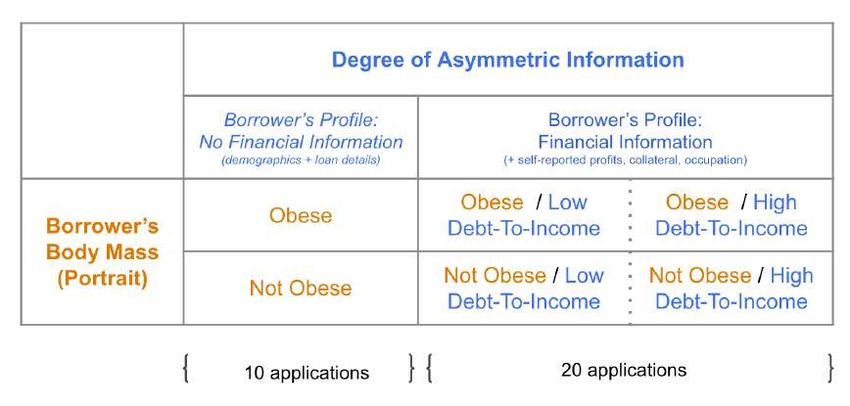
for two reasons. First, obesity is a seemingly irrelevant status signal in the context of
credit. Body mass is not an obvious determinant of lending decisions, because it cannot
be seized and has no collateral value; one could even identify obesity as a sign of poor
credit risk. Second, obesity is particularly relevant to study. Obesity is a global health
challenge5 and the presence of monetary benefits may work as an incentive to gain (or
not lose) weight, and raise the opportunity cost of healthy behaviors.6
    My empirical strategy leverages a set of complementary experiments, involving bor-
rowers and professional loan officers. My design cross-randomizes body mass, using
weight-manipulated images, and the degree of asymmetric information in which decisions
are taken, to test for the mechanism. I ask four questions: (i) Is obesity is perceived as
a reliable wealth signal? (ii) Does obesity facilitate access to credit, because it serves as
a proxy for wealth? (iii) Are obesity benefits common knowledge? and (iv) Are market
outcomes shaped by correct beliefs about the obesity signal and benefits?
    My first result is that Kampala residents use obesity as a proxy for wealth, and not of
other traits commonly associate with obesity in the anthropology literature (e.g., beauty
or health). In a survey experiment, I ask respondents to rate portraits —randomly
presented either in the obese or normal-weight version —along several traits. Obesity
causally increases portraits’ wealth ratings, but has no effect on beauty, health, life
expectancy, self-control or ability. The obesity signal is a strong —obese individuals are
perceived as rich as lean people owning a car —and relevant —providing information
on top of other signals. When portraits are accompanied by other status signals, e.g.
place of residence or car ownership, the effect of obesity on wealth ratings is reduced,
but remains significant.
    Having established that obesity works as a strong and reliable wealth signal, I test for
obesity economic benefits using a real-stake field experiment involving professional loan
officers. Leveraging a cooperation with the Uganda Microfinance Regulatory Authority,
I obtain contact information for the universe of financial institutions licensed to provide
credit in Kampala. I recruit 238 loan officers from 147 institutions, about one-fourth
of the initial population of interest.7 I also recruit 180 prospective borrowers (Kampala
   5
      Today more than 70% of the overweight and obese lives in developing countries, and more than
80% of obesity-related deaths happen in low- and middle-income countries (Shekar and Popkin, 2020).
    6
      Body-mass index is the strongest predictor of wealth among a standard set of demographics such
as age, gender, marriage status, pregnancy status, or education (DHS data, R2 comparison in bivariate
regressions). In a review of the literature, Yang et al. (2007) reports that 16% to 85% of Body Mass
Index is ‘heritable’ and related to genetic similarities among twins.
    7
      I select my population of interest to be formal and semi-formal financial institutions, active in the
Greater Kampala Area, dealing with the general public and offering cash loans between $ 250 to $ 2’000

                                                    3
residents in need of a loan) to collect their demographics, financial characteristics and
contact information.
    In the credit experiment, loan officers review hypothetical borrowers’ profiles during
work hours and select those whose application they would like to discuss in person.
Incentives come from borrowers’ referrals: in a second step, I refer each loan officer to
prospective borrowers whose profile matches their hypothetical choices. Loan officers
are employees paid based on performance, or self-employed. Thus, they have incentives
to select good borrowers and value the referrals. This incentive structure follows closely
the Incentivized Resume Rating (IRR) recently developed by Kessler et al. (2019) to
test for discrimination in hiring without deception.8
    The design pinpoints the relationship between obesity, asymmetric information and
credit by cross-randomizing borrowers’ body mass and financial information in the hy-
pothetical loan profiles. Along the obesity dimension, each profile is associated to (1) an
obese or (2) a normal-weight borrower by including a manipulated portrait as the iden-
tifier (portraits are standard identifiers in financial documents in Uganda). Along the
wealth information dimension, I exogenously vary the borrowers’ wealth information in-
cluded in the profiles, and each loan application is randomly assigned to two information
arms: (1) no financial information, (2) self-reported financial information (occupation,
collateral and earnings). When they include financial information, the profiles’ content
is cross-randomized between high or low debt-to-income ratio. In total, loan officers
make 6,167 evaluations and in 4,419 times the profile includes financial information.
    My results show that loan officers screen borrowers based on body mass and in turn,
obese borrowers are granted easier access to credit. When a profile includes a borrower’s
portrait in its obese version (vs. the normal weight), loan officers perceive the borrower
as more creditworthy and financially able, and the application as more likely to be
approved. All else equal, loan officers end up being more likely to request the referral
of obese borrowers (real-choice outcome).9 The obesity premium is large —equivalent
(UGX 1 m to UGX 7 m). These selection criteria excludes commercial banks, which normally lend
larger amounts. In total, there are 476 institutions. These institutions are heterogeneous in size, but the
median employee is 4. If an institution participates, field officers interview 1 to 3 of their loan officers
during work hours.
    8
      In Kampala, loan officers deal with borrowers in person, making a correspondance study as in
Bertrand and Mullainathan (2004) not feasible. The IRR allows to elicit incentive-compatible answers
and additionally avoids deception. My application differs from Kessler et al. (2019) on two aspects. First,
the setting and focus. To my knowledge, mine is the first application which (a) looks at credit markets, (b)
in the context of a low-resource setting, and (c) tests for body-mass discrimination. Second, the design:
I include a real-choice outcome and I test for the driver of discrimination, asymmetric information.
    9
      The effect is exclusively on loan volume, and not on charged interest rates. Interestingly, I find that

                                                     4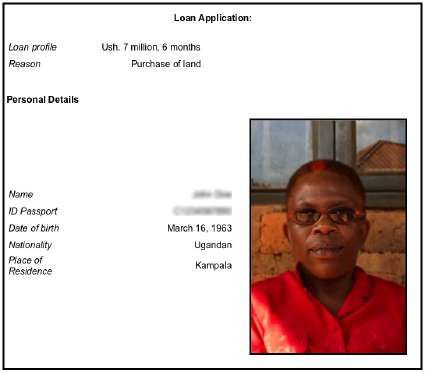
to a 60% increase in a borrower’s self-reported income —and aligned with loan officers’
explicit beliefs on returns to obesity in access to credit.10
    Asymmetric information drives obesity benefits: providing loan officers’ with bor-
rowers’ self-reported financial information reduces the premium by two-thirds (a result
significant at the 5% level). Unresolved asymmetric information probably explains the
residual obesity premium. Likely the unresolved asymmetric information stems from the
self-reported nature of the information. In fact, loan officers rate self-reported wealth
information as not very reliable. In principle, taste-based discrimination could also ex-
plain the residual effect of obesity —e.g. a beauty premium as in Mobius and Rosenblat
(2006). However, the results of the first experiment, where obese portraits were not
perceived differently along any outcome except wealth, suggest this is not the case.
Moreover, the obesity premium persists within same-sex loan officer/borrower pairs and
is not driven by homophily in body mass. I interpret these results as consistent with
loan officers engaging statistical discrimination.
    The nature of the experimental design, based on hypothetical loan applications and
weight-manipulated borrowers portraits, does not allow to test whether down-the-line
obese borrowers are actually granted more credit or whether they have better returns to
capital. To partially address this concern, I show that loan officers explicit beliefs on the
returns to obesity in credit markets are consistent with the experimental results. The
explicit beliefs, together the presence of real stakes, and the fact that obesity premium
appears to matter on top of self-reported financial information, all point at the external
validity of the results and suggest that being obese leads to actual substantial credit-
market benefits in Kampala.
    The results’ implications crucially rest on people’s accurate or inaccurate perception
of the signal and the benefits. In the last part of the paper, I combine a simple model,
additional tests, and experimental variation to further explore this aspect. I begin by
investigating whether people hold accurate beliefs on obesity benefits in credit markets. I
replicate the credit experiment with the general population asking respondents to guess
loan officers’ evaluations of the hypothetical loan profiles (incentivized second order
beliefs). People are generally aware of obesity benefits in credit markets, yet hold biased
beliefs which significantly overestimate obesity premium in access to credit. I find similar
evidence of misperceptions when looking at whether people hold accurate beliefs on the
obesity wealth signal. On the borrowers’ side, I elicit laypeople’s incentivized beliefs on
loan officers do not resort to screening using interest rate at this stage.
   10
      Own survey data collected at the end of the credit experiment.

                                                     5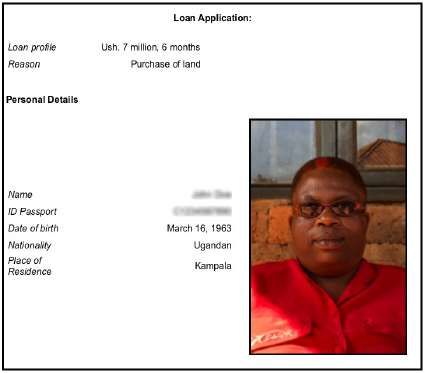
the earnings distribution by body mass in Kampala. On the loan officers side, guided
by a simple framework, I estimate a revealed-preferences measure of loan officers’ beliefs
from their choices in the credit experiment.11 As a benchmark, I collect complementary
survey and anthropometric data to estimate the earnings distribution by body mass
in Kampala. In Kampala, obese people earn around $ 80/month more than normal
weight people. According to my results, on both sides of the credit markets people hold
inaccurate beliefs on what being obese means in terms of earnings. In particular, people
place too much weight on obesity as a signal of wealth. While only suggestive, this is
consistent with obese people being stereotyped as rich (Bordalo et al., 2016).
    The evidence of misperception suggests that screening based on body mass is not
necessarily efficient. In terms of credit allocation, both dispersion and overestimation
may lead to distortions relative to a full information framework. In particular, 1) demand
for credit may be too low among thin people and 2) the credit allocation may favor fat
borrowers to an inefficient extent.12 Moreover, the results suggests the presence of a
trade-off between obesity health costs and financial benefits, which matters for the design
obesity prevention policies in poor countries. Building on Allcott et al. (2019), I show
that accounting for obesity monetary benefits reduces the optimal sugar tax when soda
consumption is not regressive. Studying the incentives to gain weight in poor countries
and understanding how obesity monetary benefits affect the take up of healthy behaviors
are interesting avenues for future research.
    This paper makes three contributions. First, it provides novel field-experimental
evidence on the financial benefits of status indicators in a low-resource setting. The
discussion on the hedonistic or instrumental nature of social concerns is open (Bursztyn
and Jensen, 2017) and the experimental evidence on tangible rewards generated by social
signals is limited to social interactions (Bursztyn et al., 2020; Nelissen and Meijers,
2011). Most field experiments testing for social image concerns do not investigate the
benefits derived from signaling (Bursztyn et al., 2017b, 2019; Chandrasekhar et al.,
   11
      The obesity premium in the experiment can be decomposed into a direct —i.e., taste-based dis-
crimination (Becker, 1956) —and an indirect component —i.e., statistical discrimination (Arrow et al.,
1973; Phelps, 1972), based on loan officers’ beliefs of the earnings distribution by body mass. Exploiting
the experimental cross-randomization of body mass and earnings, I infer loan officers’ beliefs about the
average earnings difference between obese and normal-weight borrowers and compare the distribution
with the population value. My approach is conceptually close but distinct to Bohren et al. (2019).
They propose either (i) eliciting agents beliefs, implying a large increase in survey time, or (ii) providing
information about group characteristics. Based on discussions with partner micro-finance institutions,
collecting statistics on loan performance by body mass appeared practically nonviable.
   12
      Any conclusive statement on the effects of body mass screening on credit market efficiency hinges
on returns to capital by borrowers’ body mass and is beyond the scope of this paper.

                                                     6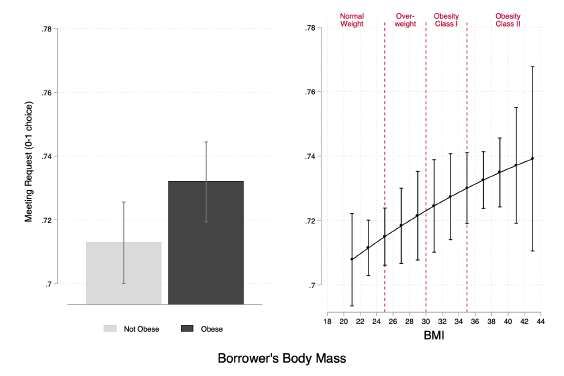
2018; DellaVigna et al., 2016; Karing, 2018; Perez-Truglia and Cruces, 2017). A closely
related paper is Bursztyn et al. (2017a), providing experimental evidence of demand
for status in Indonesia. My results suggest that financial benefits may be driving, at
least in part, the demand for status and thus help explaining phenomena like large
expenditures in celebrations among the ultra poor (Banerjee and Duflo, 2007).13 Second,
the paper sheds light on the mechanism behind status signals’ benefits —asymmetric
information. Together with Cole et al. (2015) and Fisman et al. (2017), this is one
of the few experimental studies looking at the supply side of lending decision in poor
countries. While previous work —notably Giné et al. (2012) —studied the effect of
reducing asymmetric information in credit markets, to the best of my knowledge this is
the first paper to jointly randomize the degree asymmetric information with borrowers’
information.14 Third, this paper is the first to identify positive statistical discrimination
by obesity in poor countries and thus, contributes to a literature on discrimination by
body mass,15 and on bias in consumer lending (Berkovec et al., 1994; Dobbie et al., 2018;
Labie et al., 2015). Duarte et al. (2012), Pope and Sydnor (2011), and Ravina et al.
(2008) also test for appearance discrimination in credit markets, but work in high-income
setting, look at negative discrimination, and identify a different mechanism, e.g. taste
or beauty bias. Finally, the paper provides experimental evidence on the socio-economic
benefits of weight gain in poor countries and adds to our understanding of the obesity
global epidemic. While a large literature focuses on the health and economic costs of
obesity, to my knowledge, there is no other experimental evidence on its benefits.16
    The paper is structured as follows. Section 2 describes the weight-manipulated por-
traits. Section 3 describes the beliefs experiment. Section 4 presents the credit exper-
iment. In section 5, I test for awareness of benefits and beliefs accuracy among loan
officers and borrowers using additional experimental evidence and a simple framework.
Section 6 concludes discussing external validity and policy implications.
  13
      Bursztyn et al. (2017a) provides evidence that (low) self-esteem may be a concurrent determinant
of conspicuous consumption patterns.
   14
      A field experiment with a similar design is Bartoš et al. (2016), showing that discrimination can
arise from the decision makers’ choose of the effort level to dedicate to an application.
   15
      These works look at high-income countries and focus on negative discrimination. See Neumark
(2018) for a review. For example, Rooth (2009) tests for negative obesity discrimination in hiring in
Sweden.
   16
      Most obesity literature focuses on high-income countries Cawley, 2004; Cawley and Meyerhoefer,
2012; Finkelstein et al., 2009, 2012). In the development context, Rosenzweig and Zhang (2019) studies
the effects of education on healthy behaviors using twin data from rural China, and Giuntella et al.
(2020) explores the effects of trade on obesity in Mexico. As obesity benefits imply rewards from extra
calories, my findings relate to the puzzle of calorie under-investment in low-resource settings (Atkin,
2016; Schofield, 2014; Subramanian and Deaton, 1996).

                                                  7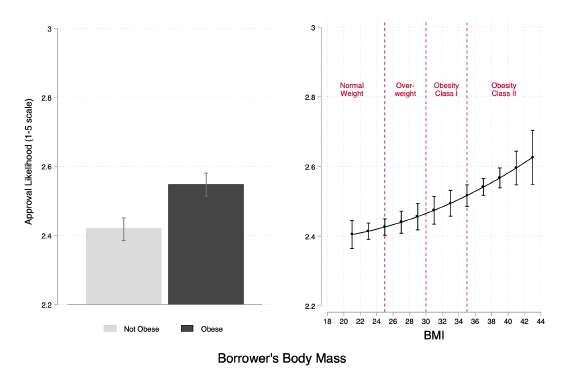
2        Identifying the Causal Effect of Body-Mass Changes
Identifying the causal effect of obesity in an observational analysis is hard because body
mass realizations are endogenous to preferences and constraints. An experimental de-
sign which randomly varies caloric intake would pose ethical challenges. To overcome
both concerns, this paper identifies the causal effect of body mass by randomly varying
whether the decision maker sees the ”thinner” or ”fatter” computer-manipulated version
of a portrait. While other papers have used weight-manipulated portraits to test for
negative discrimination by obesity in high-income settings (see Neumark (2018) for a
review), my design innovates relative to the literature by comparing thinner and fatter
manipulated portraits, rather than manipulated and originals. Comparing manipulated
portraits allows me to identify the effect of changes in body mass, all else equal.17
     The original portraits are 30 portraits of Kampala residents of Ugandan nationality
and 4 computer-generated portraits of individuals of white race.18 The portrayed in-
dividuals are stratified by gender, and are heterogeneous according to body mass, age,
ethnicity, religion, and socio-economic status. To create the manipulated portraits I co-
operate with two photographers, who manually create a “thinner” and “fatter” version of
each portrait using a photo-morphing software. After discarding the originals, the final
set of portraits is made of 34 pairs of weight-manipulated portraits, or 68 pictures.19
     To measure the body mass variation across thinner and fatter portraits I elicit the
portraits’ perceived Body-Mass Index (BMI) from a set of 10 independent raters (Kam-
pala residents).20 To rate the perceived BMI, raters compare portraits with the figurative
Body Size Scale for African Populations developed and validated in Cohen et al. (2015)
(see Appendix Figure J.2). The portraits’ perceived BMI, whose distribution is plotted
in Appendix Figure J.3, ranges between 20 to 44 points. All “thinner” portraits are
perceived to be at least normal weight (BM I ≥ 18.5), while all “fatter” portraits are
perceived to be at least obese (BM I ≥ 30).21 In particular, ”fatter” have an average
    17
      A caveat to this would be if manipulating weight up or down would affect perception differentially,
an hypothesis which does not seem to be supported by informal ratings and checks.
   18
      Kampala residents are recruited via focus groups; participants provide written consent and receive a
digital copy of their portrait. The computer-generated portraits are obtained from an algorithm similar
to https://thispersondoesnotexist.com/.
   19
      Appendix Figure J.1 shows all the portraits’ pairs presented one next to each other. While some
of the portraits may look manipulated when showed one next to each other, several checks showed that
people do not really perceive the portraits as odd when presented one-by-one as in the experiment.
   20
      The BMI is a measure of whether someone is over- or underweight, calculated by dividing their
weight in kilograms by the square of their height in metres.
   21
      Notably, the perceived BMI distribution of the manipulated portraits is not much more extreme as
compared with the BMI distribution in Kampala. In the city, obesity and overweight are much more

                                                    8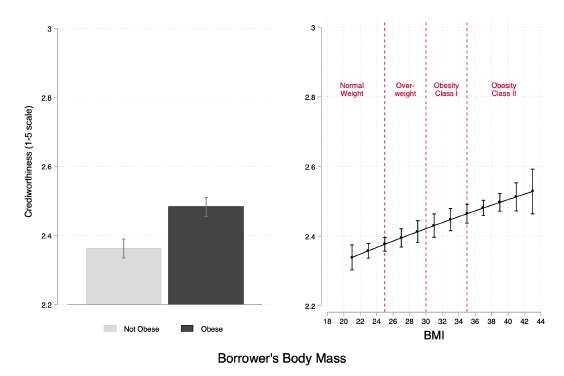
perceived BMI of 37 —class II obesity, while ”thinner” of 23 —normal weight. Thus, by
varying whether a respondent sees a portrait in its thinner or fatter version, I identify
the causal effect of obesity relatively to normal weight as the average treatment effect.

3     Obesity as a Signal of Wealth
Obesity positively correlates with wealth in the vast majority of low-income countries
(Figure 1), and is the strongest wealth proxy among the observable individual character-
istics recorded in Demographic and Health Survey (DHS) data —including age, gender,
marital status, number of children, and rural/urban residence. In line with the data,
abundant anecdotal evidence and qualitative evidence across time and space describe
fatness as a sign of status in poor societies. Obesity and overweight have been found to
signal high socio-economic status in ancient Europe. In current days, positive percep-
tion of fat bodies is reported by Anderson-Fye (2004) in Belize; Bosire et al. (2020) in
South Africa; Chigbu et al. (2019) in Nigeria; Ettarh et al. (2013) in Nairobi, Kenya;
Holdsworth et al. (2004) in urban Senegal; Popenoe (2012) among Arabs in Niger; Sobo
(1994) in Jamaica; Ngaruiya et al. (2017) in Uganda.
    While the evidence shows that obesity is associated with high social standing in
low-income settings, the main assumption behind this paper’s hypothesis —that people
update their beliefs on others’ wealth or earnings based on their obesity status —is not
yet verified. Indeed, although obesity correlates with wealth in the data, people may not
perceive body mass as a salient or reliable trait, and thus not take it into account when
forming beliefs about others’ wealth or earnings. On top of this, people may infer also
other qualities independent of wealth which may indirectly affect their wealth beliefs.
For example, in anthropology obesity is often described as a beauty trait, a sign of
fertility, and good health in poor countries (see for example ??), while in high-income
countries, thinness is anecdotally associated with self-control and ability.22

3.1    Beliefs Experiment

To validate the assumption that raised body mass is perceived as a reliable wealth signal
in Kampala, I design a survey experiment to test 1) whether obesity is perceived as a
prevalent than underweight. According to the Uganda Demographic and Health Survey, already in 2016
the share of overweight and obese women (BM I > 25) in Kampala was 41%, against a 5.3% underweight.
Among men, the share of overweight and obese was around 22%, against 4.4% underweight.
   22
      There is actually no conclusive evidence linking self control to body mass outcomes, as shown in
the meta-analysis study ??.

                                                  9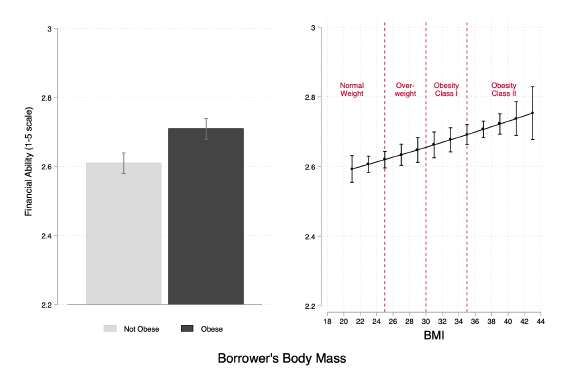
signal of wealth, as opposed to signaling other traits and 2) the relevance of the obesity
signal against other typical signs of status like place of residence and car ownership.

Design     In a survey experiment respondents see and rate random sequence of four por-
traits from the set of weight manipulated portraits. My design cross-randomizes obesity
with other status signals, in a 2x3 design (Appendix Figure 2). Along the obesity dimen-
sion, for each portrait, respondents see either the fatter or thinner weight-manipulated
version. The randomization is at the portrait level allows me to test whether on aver-
age obese portraits are rated differently as compared to not obese portraits, conditional
on respondent and portrayed individual fixed effects. Along the second dimension, I
randomize the amount of wealth signals available to the respondents. Respondents are
assigned to two treatment arms. In the one-signal arm, all portraits are accompanied
by age information only; in the multiple-signals arm, all portraits are accompanied by
age information and another signal of wealth: respondents either learn that the person
owns a car (rich type) or that the person lives in a slum (poor type). The signal type
(rich or poor) is randomized at the portrait-individual level.

Outcomes        Respondents rate each portrait along six characteristics in random order
(first-order beliefs): wealth, beauty, health, longevity, self-control, ability to get things
done, and trustworthiness. Of these characteristic, wealth is the pre-registered primary
outcome.23 The choice of the secondary outcomes was based on the most common qual-
ities that are positively associated with obesity in poor countries in the anthropology
literature (health, beauty, life expectancy) and those anecdotally negatively associated
with obesity in high income countries (self-control, ability). Trustworthiness ex-ante
could be a relevant confounder. While ultimately any list of traits cannot be compre-
hensive, the final choice was made to trade-off survey time and breadth.24
    First-order beliefs —the main outcome of interest —cannot be incentivized. Al-
though the variety of characteristics elicited reduces the likelihood that respondents
guess the hypothesis under study, lack of monetary incentives may still raise concerns of
experimenter demands biasing people’s answers. To minimize these concerns, first the
survey tools I include a decoy wealth signal: about a fourth of the portraits rated is of
   23
      All secondary outcomes were pre-registered with the exception of trustworthiness, which was added
during the experiment.
   24
      These outcomes, including the distinction between primary and secondary, were pre-registered with
the exception of trustworthiness which was included half-way into the experiment.

                                                  10
white race.25 Second, I elicit a second set of outcomes: how they think other respon-
dents rated each portrait (beliefs’ about others beliefs). These answers are incentivized,
as respondents receive a small bonus if their answer matches other respondents’ most
frequent ratings.26
Sample selection Respondents live in the districts of Kampala, Mukono and Wak-
iso, the districts which build for the largest population share of the Greater Kampala
Metropolitan Area (Uganda Population and Housing Census 2014). To qualify for partic-
ipation, respondents needed to be 18 year old or older and provide written consent. The
sample is stratified by age group, socio-economic status, and gender. In fact, ex-ante
obesity perception may depend on these characteristics. The anthropology literature
highlights the relationship between poverty and social valorization of obesity, thus body
mass perception may differ by socio-economic status.27 Moeover, since obesity is often
described as a sign of fertility (Popenoe, 2012), obesity perception may differ across
women and men. Finally, younger people, likely more exposed to western media, may
have updated their perception of body mass accordingly (?). Notably, the sample is not
stratified by body mass.
Field officers walked around the districts and enrolled respondents quasi-randomly
until they reached the required number and composition.28 The survey was described
as part of a study in partnership with the University of Zurich focusing on how appear-
ance affects individuals’ perception in Uganda. Respondents received a small fixed fee
in airtime as compensation for their time, plus a bonus depending on their answers.
On top of this, field officers took respondents’ weight and height, and respondents re-
ceived their measurements, their BMI and their body mass status (underweight, normal
weight, overweight, obese). Since most people in Kampala do not have access to weight
scales or height boards, the anthropometric measurements work as a good incentives to
participate. The final sample includes 511 Kampala residents. Table 1 summarizes the
25
White-race portraits are then excluded from the analysis.
26
The portraits are introduced by the sentence: ”Imagine you just met this person for the first time
in Kampala...”. Each portrait is rated twice: the first time to elicit first-order beliefs; the second time,
guessing other respondents’ beliefs. The wording to elicit first-order beliefs is: “How would you rate
this person’s $outcome? Please, provide your answer on a scale from 1 (not at all $outcome ) to 4
(very $outcome).” For beliefs’ about others beliefs the wording is: “How did other respondents rate this
person’s $outcome? Please provide your best guess of the most frequent answer on a scale from 1 (not at
all $outcome) to 4 (very $outcome).” Survey tools are in Appendix I.
27
As a proxy for socio-economic status, I use wards of residence (smallest Ugandan census unit). I
rank and stratify the wards according to a Poverty Index based on dwell characteristic, access to credit
and food security. The procedure is detailed in Appendix A).
28
The survey was implemented in cooperation with IGREC Uganda.
11descriptives. Because of the stratification, the sample is slightly older and richer than
the Kampala average. In terms of body size, on average respondents are overweight
(BMI 25.66). This data point is aligned with the data from body mass distribution
in Kampala from the Uganda DHS 2016, again pointing at the rising overweight and
obesity problems in urban areas in Africa.
3.2 Main Results: Obesity Wealth-Signaling Value
Figure 3 plots the average ratings by obesity status and Table 2 summarizes the cor-
responding regression analysis, including respondent and portrayed-individual fixed ef-
fects.29
The main statistic of interest is the difference in the wealth ratings of Obese and
Not Obese portraits. The data shows that the very same portrait in its obese version
is systematically rated as wealthier as compared to its normal weight counterpart (0.70
s.d). Instead, obese portraits are not perceived on average more beautiful, healthier nor
more trustworthy; they are not rated differently in terms of life expectancy or ability;
obesity status is also not associated with a lower self-control, described as ability to
resist to temptation.30 The beliefs experiment shows that obesity status is routinely
perceived as a signal of being rich, but not of other traits.
Since people generally face many signals at once, one may worry that the obesity
signal may be crowded out by other wealth signals, or that it may be so small as to be
irrelevant. To investigate the relevance of obesity as a signal of wealth, I exploit the
information variation across treatment arms. First, I benchmark the effect of obesity
against the effect of a strong wealth signal, car ownership.31 To do so, I compare the
effect of car-ownership on wealth ratings in the multiple-signals arm, with the effect of
obesity in the one-signal arm: the two coefficients are not statistically different from
each other. Thus, the wealth-signaling gain from being obese is large: comparable to
the gain derived from owning a car. Second, I look at whether the obesity coefficient on
wealth ratings is systematically reduced by the presence of another signal. To do so, I
pool all treatment arms and include an interaction term between the obesity dummy and
a treatment-arm dummy. Providing more information about a person’s assets or place
29
The regression model is described in Appendix A.
30
The beliefs about others’ beliefs results are broadly consistent with the first-order beliefs: Table 2
Panel B shows that obesity is systematically more associated with wealth, than with any other effect
(the effect is twice as large and statistically different).
31
In Uganda in 2016 there were 40 registered motor vehicles per 1’000 inhabitants in 2016. As a
comparison, in the US there were 838 cars per 1’000 inhabitants and in Switzerland 716.
12of residence does reduce the importance of the obesity signal, but the effect is small and
significant only at the 10% level (Figure 3 and Table 2). Thus, the obesity signal is a
relevant one, which provides additional information beyond other strong signs of status
like place of residence or car ownership. Finally, the importance of obesity as a wealth
signal does not appear to vary by any of the pre-registered traits. In particular, obesity
equally signals wealth for men and women.32
Discussion The beliefs experiment shows that Kampala residents routinely take into
account a persons’ body mass to build their wealth beliefs. The obesity signal is salient:
without any experimenter prompt respondents associate obesity with wealth. The fact
that obesity is exploited as a proxy for wealth appears to be common knowledge, as
first and second-order beliefs are aligned). Finally, and most notably, the obesity signal
appears very strong and reliable, as it provides additional information on top of other
strong status signals like car ownership and place of residence. Taken together, these
results suggest that obesity is routinely perceived as as a signal of wealth in real life
interactions. In the next section, I move to investigating whether the wealth-signaling
value of the obesity status signal actually translates into economic benefits from being
obese and test for the asymmetric information channel.
4 Obesity Benefits in Credit Markets
To test whether obesity can provide financial benefits in market settings, I focus on
credit markets. My hypothesis is that being obese can lead to economic benefits because
agents rely on body mass —a status signal —as an imperfect but cheap proxy for wealth
when verifying financial information is costly. Credit markets are a good setting to test
for this hypothesis because, on top of being a context where benefits are relevant, they
entail financial interactions where asymmetric information is pervasive, both in terms
of adverse selection and moral hazard (Karlan and Zinman, 2009). Moreover, in poor
countries, the rich have easier access to credit - thus being wealthy matters.33
32
Additional results, including a separate analysis for white race portraits and the analysis of signals
interactions, can be found in Appendix A.
33
Understanding barriers to credit access has been the focus of a large literature in development
economics. Karlan and Morduch (2010) provides a comprehensive review of the issue of accessing financial
services in poor countries. Within this literature, Banerjee (2003) provides a theoretical framework to
explain why asymmetric information leads loan officers favoring rich borrowers; more recently, De Mel
et al. (2008) show experimentally that rich borrowers have also better returns to credit.
134.1 Credit Experiment
I design and implement a field experiment involving professional loan officers in Kampala
(Uganda). In Uganda, loan officers’ play a crucial role in the lending process, which is
normally dealt in person. On top of meeting with borrowers multiple times, they also
often take the final approval decision. Since most loan officers face a performance pay
scheme, they have incentives to select the best borrowers. However, loan officers are
normally also in charge of the field-investigative work to verify the information provided
by prospective borrowers, thus also bearing the costs of the information verification.34
Institutions, Loan officers, and Borrowers Sample Institutions providing credit
in Uganda are highly heterogeneous.35 I obtained the listing of the universe of finan-
cial institutions licensed to provide credit in Uganda from the Ugandan Microfinance
Regulatory Authority (UMRA). When the field work for this paper was conducted the
listing included: 25 commercial banks, 4 credit institutions, 708 licensed moneylenders
and 127 microfinance institutions. I restrict to institutions in Greater Kampala and, to
allow for a relatively homogenous sample, I focus on those financial institutions which
provide credit to the general population and specifically, individual and collateralized
cash loans between $250 and $2500 with a 6-months term to maturity.36 After excluding
institutions in the pilot, my population of interest counts 447 institutions.37
IPA Uganda field officers visited each of the 447 institutions, checked the eligibility
34
In Uganda, reliable financial information is lacking. For example, only 20% of Ugandan land titles
- a common collateral - was registered in 2017. Although there exists a credit-score system, as of 2019
the majority of consumers are not included in that system. In this context, the cost of credit is high and
credit rationing is widespread.
35
Financial institutions which are legally allowed to provide credit are classified in four Tiers. Tier
1 institutions or commercial banks (25 institutions), that is formal credit institutions. Semi-formal
institutions (Tier 2) are credit institutions not authorized to establish checking accounts or trade in
foreign currency (4 institutions). Informal financial institutions include the remaining two tiers. Tier
3 includes the 5 institutions referred to as Microfinance Deposit-Taking Institutions (MDI). Tier 4 is a
residual category that includes all other forms of lenders, including all MFIs that did not transform into
MDIs. Tier 4 institutions are heterogeneous: moneylenders, companies, NGOs, or savings and credit
cooperatives (SACCOs). The Uganda Microfinance Regulatory Authority (UMRA) encourages Tier 3
and Tier 4 to register to the official registrar. For an extensive description of the Ugandan credit market
see Duggan (2016); Nilsson (2017); Sebudde et al. (2017).
36
This category was defined after focus groups with multiple loan officers and branch managers. It
excludes institutions which provide credit to certain professional categories (e.g., government employees),
those providing mainly relatively large business loans (commercial banks), savings and credit cooperatives
which mostly provide group loans, and informal moneylenders. While a 6-months term to maturity may
seem short, the constraint actually only limited the inclusion of institutions granting shorter-term loans
only.
37
When an institution has multiple branches, I randomly select up to 4 branches and count each
branch as one institution.
14criteria and elicited from management the institutional consent to participate in a study
in partnership with the University of Zurich. The study was presented as aimed at
improving matching between borrowers and lenders in Kampala.38 In total, more than
one fourth of the visited institutions participate: 147 out of 447. This high turnout can be
explained with the competitiveness of the Ugandan financial setting. The participating
institutions, whose characteristics are summarized in Table 3, are broadly representative
of the types of institutions providing personal loans in Kampala.39 Most institutions offer
both personal and business loans. The size, namely branches and employees number, is
very heterogeneous but most institutions are rather small (median employees number is
4). The cost of credit is high but in line with the Ugandan average monthly interest rate
(10%-12% in 2019).40
For each institution, 1 to 3 loan officers are interviewed. There are two requirements
for participation: respondents need to be dealing with borrowers directly and provide
written consent. The monetary incentives to participate are small ($1 fee); most rel-
evantly, loan officers know that at the end of the study they will be referred to good
prospective borrowers. The final sample includes 238 respondents, whose characteristics
are summarized in Table 4. While for simplicity I refer to the respondents as loan offi-
cers, the occupation set is more diverse: 63% self-identify as loan officers; 13% own the
business and 9% state to be the manager. The sample is relatively balanced in terms
of gender (60% male); loan officers are also relatively young and educated, as about
two-thirds hold a Bachelor degree. The monthly salary ranges between $ 135 to $ 270,
above the median monthly wage in Kampala ($80 in the Ugandan Census 2014). Look-
ing at loan officers’ tasks 74% directly approve loan applications and 80% are in charge
of verifying borrowers’ information. Importantly, the verification process appears time
consuming: loan officers spend on average about half of their working week verifying
borrowers’ information on the field.
38
This is an accurate description and does not imply deception because at the end of the experi-
ment, loan officers are matched with borrowers whose characteristics they like. I preferred not to draw
people’s attention on discrimination and in particular, body mass discrimination to reduce concerns of
experimenter demands and selection.
39
Except for the exclusion of commercial banks, and group loans institutions, all financial institutions
tiers are represented. If anything, slightly oversample formal institutions as opposed to semi-formal ones
In the actual population of financial institutions in Kampala, non-deposit deposit taking microfinance
institutions account for the 1%, deposit-taking microfinance institutions account for the 0.12% and credit
institutions account for the 0.15%.
40
Ideally, one would want to compare the in-sample institutions with the full population. To do so,
one would have needed to run a listing with all institutions, including those which did not want to
participate in the study. This was logistically unfeasible.
15The recruitment of the sample of prospective borrowers is simpler. At the end of the
beliefs experiment, I collect information on the respondents’ credit history, their need
of a loan, and reason for borrowing. Then conditional on being a first-time borrower, I
elicit consent to be included in the credit experiment sample. This allows me to collect
a database with the information of 180 prospective borrowers, that is Kampala residents
in need of a loan.
Design and Incentives In the credit experiment, the 254 professional loan officers
evaluate 30 hypothetical loan applications each to be matched with real borrowers ac-
cording to their preferences. This incentive structure follows closely the Incentivized
Resume Rating (IRR) recently developed by Kessler et al. (2019) to test for discrimi-
nation in hiring without deception.41 I provide the referrals by matching loan officers
preferences with prospective borrowers from the borrowers’ sample and then communi-
cating to the borrowers the loan officers’ name and contact information.42
Both financial business owners and loan officers care about referrals, because good
clients can affect their earnings prospects. Credit markets in Kampala are characterized
by many institutions competing for few high-quality borrowers. Owners’ choices may
affect their profits. Most employed loan officers face some form of performance pay.43
To pin down the relationship between obesity, access to credit, and asymmetric infor-
mation, my design cross randomizes obesity and the degree of asymmetric information
in the borrowers profiles. Along the first dimension, I vary borrowers’ body mass by
randomly assigning each loan officer to see a borrower’s portrait in the either Obese or
Not Obese version.44 Along the second dimension, I vary the degree of asymmetric infor-
41
In the original paper, Kessler et al. ask employers to evaluate resumes they know to be hypo-
thetical in order to be matched with real job seekers. In the resumes, they randomize human capital
characteristics and demographics of hypothetical candidates. Their outcomes are employer preferences
for candidates and employer beliefs about the likelihood candidates will accept job offers.
42
The matching is born out of a machine learning algorithm which predicts the borrowers-lenders
pairs with the best referral request probability, based on observables. I train a Random Forest Classifier
on the experimental data. For each loan officer and borrower pairs, the algorithm predicts the likelihood
that the loan officer would request the referral of that borrower. Following Kessler et al. (2019), to
avoid implementing biased referrals, I include among the observable characteristics borrower’s gender
and body mass. I then apply the Classifier to the real prospective borrowers data and for each borrower
I select the best match, that is: the loan officers with the highest referral request likelihood. Appendix
C describes in detail the matching algorithm and the referrals’ implementation.
43
The relevant performance metric varies across institutions: performance is measured in terms of
either quality or quantity of borrowers secured, or both. In the sample, the type of performance pay
varies among portfolio performance (30%), sales volume (30%), revenue generated by self or bank on
the whole (10%). For 18% of the loan officers, performance pay takes the form of yearly or quarterly
bonuses if the person has done well or met a specific target.
44
This randomization technique works neatly in this setting because it is customary to use portraits as
16mation between borrowers and lenders by changing the amount and quality of borrowers’
self-reported information in the application. Loan officers face two information options:
a low-information arm, where profiles shown to loan officers only include demograph-
ics, a portrait, loan characteristics and the reason for the loan; a high-information arm,
where profiles also include self-reported financial information and are randomly assigned
to a high or low debt-to-income ratio. For each loan officer, the first 10 randomly se-
lected profiles do not include any financial information; the last 20 include self-reported
monthly revenues, monthly profits, collateral and occupation.45 The result is a 2x3
design, described in Figure 5.46 The idea underlying this design is that there are two
reasons why loan officers may treat obese borrowers differently. First, they may have a
preference for (or against) obese borrowers, which is unrelated to the fact that obesity
is perceived as a proxy for wealth (taste-based discrimination). Second, they may bor-
rowers’ body mass may affect credit outcomes because loan officers’ exploit obesity as
a proxy for wealth. In the former case, one would not expect loan officers’ preferences
to be affected by the information environment. In the latter, instead, one would expect
that the more information on a borrower’s financial situation is available, the less loan
officers would rely on body mass in their decisions.47
The experimental setup and loan officers’ incentives are as close as possible to a
real life setting. The lending process in Kampala normally begins with an in-person
meeting between a loan officer and a borrower, which rules out the possibility of an audit
personal identifiers in financial documents, as shown in the financial documents templates in Appendix
Figure J.4.
45
Within the high- information arm applications were ex-ante divided into two sub-treatment arms
of 10 applications each, in which either loan officers’ opt in to see more information or the information
is presented by default. The comparison between sub-treatments allows to understand at which point
in the decision making process the discrimination bites. For example, loan officers may prefer to avoid
seeing the information of applicants which they perceive as less creditworthy ex-ante. While the extra
information was provided for free to the loan officers, it still takes some time for a loan officer to review
it. The results show that loan officers opt in to receive more information about the applicants in 99% of
the cases. In the analysis, I pool the two sub-treatments.
46
Notably, while the order in which profiles are presented is random, the information treatments’
order is not randomized. This design choice helped to clarify to the loan officers that the amount/type
of information in the profiles was a design choice, and could not be attributed to a borrowers’ strategic
decision. In Appendix B I present evidence that the results are not driven by the order.
47
Notably this test of statistical versus taste-based discrimination does not allow to identify the
”true” animus of the discrimination. Imagine that loan officers are biased towards obesity borrowers but
that providing additional information makes it harder for them to justify their discrimination to other
people or themselves, this outcome would be indistinguishable from actual statistical discrimination (loan
officers would still look like profit-maximizing agents). In my setting, this is a relatively small concern
applying an obesity premium does not appear to be at all stigmatized. This design limitation should
be taken into account, however, if one would want to apply a similar design to another discrimination
context.
17study. Based on the self-reported information provided, loan officers decide whether
or not to engage in the effortful and time-consuming task of verifying the borrower’s
information. Once the verification process is concluded, in some cases loan officers have
full discretionality on loan approval, in others their choice is about recommending the
applicant to the final stage of the loan approval process (credit committee evaluation).
The first treatment arm mimics when a loan officer decides whom to meet, among the
prospective borrowers in a waiting room. The second treatment arm mimics a situation
in which, when meeting a borrower for the first time and collecting the self-reported
information, a loan officer chooses whether or not to embark in the costly activity of
verifying the borrowers’ information on the field.48
Outcomes Loan officers evaluate each borrower profile according to six outcomes. I
elicit three measures of beliefs (approval likelihood, borrowers’ creditworthiness and fi-
nancial ability) and the binary choice of being willing to meet with a borrower with
similar characteristics. Given the incentive structure, the latter is a real choice outcome:
if a loan officer chooses to meet a hypothetical borrower, then this increases the likeli-
hood that she is referred to a real borrower with similar characteristics. The experiment
also elicits two pre-registered secondary outcomes: interest rate charged conditional on
approval, if a loan officer can charge discretionary interest rates and reliability of the
self-reported financial information, when profiles include self-reported financial informa-
tion.49
48
According to the loan officers (Table 4), verifying the borrowers’ information accounts for more
than half of their working time (between 2 to 3 days per week) on average and includes multiple visits
to the borrowers’ home or business (96% of the respondents), verifying collateral (95%), talking to the
neighbors, family members and employees (75%) as well as requiring formal documents (92%).
49
The questions order is: Approval Likelihood, Creditworthiness, Interest Rate (if applicable), Finan-
cial Ability, Reliability (if applicable), Referral. The number, wording and scale of the questions were
pre-registered. The wording is the following. Approval Likelihood: Based on your first impression, how
likely would you be to approve this loan application? (1-5, not at all likely - extremely likely); Interest
Rate: If you had to approve this loan application, which interest rate would you charge? (Standard,
Higher, Lower, Not applicable); Creditworthiness: ”Creditworthiness describes how likely a person is to
repay a financial obligation according to the terms of the agreement.” Based on your first impression, how
would you rate the person’s creditworthiness? (1-5, not at all likely - extremely likely); Financial Ability:
Based on your first impression, how likely do you think this person would be to put the loan money to
productive use? (1-5, not at all likely - extremely likely); Info Reliability: How reliable do you think the
information provided by the applicant is? (1-5, not at all reliable - extremely reliable, not applicable if
no additional info.); Referral: Based on your first impression, would you like us to refer you to a similar
applicant to meet and discuss his/her loan application? (yes/no)
18Hypothetical Loan Profiles I build hypothetical loan profiles by cross-randomizing
information from the prospective borrowers’ sample and focus groups with loan officers.
I cross-randomize the information to build 30 hypothetical borrower profiles.50 Each
profile includes blurred borrower’s name and passport number, and Ugandan nation-
ality. Moreover, each profile is randomly assigned to cross-randomized information on
age, picture, loan profile and reason for loan. When a profile is assigned to the high-
information treatment arm, it additionally includes self-reported financial information,
that is borrowers’ occupation, monthly revenues, monthly profits and collateral.51 Most
notably, each profile is assigned to a weight-manipulated portrait, so that for each profile
there exist 30 pairs of borrower profiles, an Obese and a Not-Obese version, for a total of
60 loan profiles. Figure 6 shows one example of profiles’ pair (no financial information).
In the experiment, I randomize each respondent to see 30 hypothetical profiles and the
randomization is stratified at the pair level to mitigate experimenter demands.
The hypothetical profiles are realistic. First, the profiles’ template is based on a real
financial document.52 Second, the borrowers’ portraits are selected from the pool of
Kampala residents portraits. Third, to avoid that the combination of cross-randomized
information may result in an unrealistic profile, the final set of 60 loan profiles is vetted
by real loan officers.
4.2 Main Results: Obesity Premium in Access to Credit
Figure 7 plots the credit ratings by borrowers’ body mass. The main statistic of interest
is the difference in access to credit between Obese and Not-Obese borrowers.53 Loan
officers rate loan profiles associated with obese borrowers as more likely to be approved,
more creditworthy and financially able, and finally, are more likely to requested the
borrower for a referral (real-choice outcome). Plotting ratings by a continuous measure
of body mass, the financial benefits from weight gain appears to be linearly increasing
and the data shows no penalties associated to extreme BMI values (above and beyond
50
The procedure is summarized in Table 5 and described in detail in Appendix B.
51
The financial information is delivered by adding, at the bottom of the application, the following
sentence: ”This applicant is self employed and runs a [occupation type] in Kampala. The applicant claims
that the business is going well. Last month, the business revenues amounted to [revenues amount]. The
profits were [profits amount]. The applicant could provide a [collateral type] as collateral. Please notice
that the information on revenues, profits and collateral are self reported by the applicant, and have not
yet been verified.”
52
The templated used are displayed in Appendix Figure J.4.
53
Table 6 shows the randomization works well and that loan profiles associated with Obese and Not-
Obese borrowers are balanced across all observables, except body mass.
19You can also read