WP/20/142 Raising Tax Revenue: How to Get More from Tax Administrations? - by Eui Soon Chang, Elizabeth Gavin, Nikolay Gueorguiev, and Jiro Honda
←
→
Page content transcription
If your browser does not render page correctly, please read the page content below

WP/20/142

Raising Tax Revenue: How to Get More from Tax
 Administrations?

by Eui Soon Chang, Elizabeth Gavin, Nikolay Gueorguiev, and Jiro Honda
2

© 2020 International Monetary Fund WP/20/142

 IMF Working Paper

 Fiscal Affairs Department

 Raising Tax Revenue: How to Get More from Tax Administrations?

 Prepared by Eui Soon Chang, Elizabeth Gavin, Nikolay Gueorguiev, and Jiro Honda1

 Authorized for distribution by Nikolay Gueorguiev and Katherine Baer

 July 2020

 IMF Working Papers describe research in progress by the author(s) and are published to elicit
 comments and to encourage debate. The views expressed in IMF Working Papers are those of the
 author(s) and do not necessarily represent the views of the IMF, its Executive Board, or IMF
 management.

 Abstract
Can we empirically show the benefits of improving the practices and characteristics of tax
administration agencies for revenue collection? While many country experiences suggest a
strong link, there is little systematic empirical evidence on the matter. This paper analyzes the
association between tax collections and tax administrations, using the novel dataset (ISORA). We
find that tax performance is positively and strongly associated with the operational strength of
tax administrations. Among emerging and low-income economies, countries at the top 25
percent (in terms of the operational strength) collect substantially larger tax revenues (by
3¼ percent of GDP) than countries at the lowest 25 percent, assuming other conditions are
equal. Our results also suggest that adopting key administrative practices such as compliance risk
management and use of third-party data is associated with stronger tax collections. Furthermore,
larger staffing of a tax agency improves tax revenue up to a point. These findings have important
policy implications, particularly during the unprecedented global pandemic situation.
JEL Classification Numbers: E62, H2, H83

Keywords: tax administrations, tax collections, administrative practices, tax operational strength

Authors’ E-Mail Addresses: EGavin@imf.org, NGueorguiev@imf.org, JHonda@imf.org,
esoon.chang@gmail.com

1 We are grateful for comments from Vitor Gaspar, Paolo Mauro, Katherine Baer, Debra Adams, Andrew Masters,
Mick Thackray, William Crandall, Shafik Hebous, Aqib Aslam, Seung Mo Choi, Sam Delepierre, Tara Iyer, and thank
the participants of IMF’s Fiscal Affairs Department seminars. We would also like to thank Eslem Imamoglu for her
excellent research assistance.
3

 Content Page

ABSTRACT _______________________________________________________________________________________ 2

I. INTRODUCTION _______________________________________________________________________________ 5

II. LITERATURE REVIEW _________________________________________________________________________ 7

III. DATA ON TAX ADMINISTRATION PRACTICES AND CHARACTERISTICS __________________ 9

IV. EMPIRICAL METHODOLGY ________________________________________________________________ 15

V. EMPIRICAL FINDINGS ______________________________________________________________________ 18

VI. CONCLUSIONS _____________________________________________________________________________ 25

REFERENCES ___________________________________________________________________________________ 27

BOXES
1. Key Findings of Empirical Analyses _____________________________________________________________ 6
2. Potential Impact of Covid-19 on Tax Administration __________________________________________ 14

FIGURES
1. Indices Compiled to Reflect Facets of Tax Administration _____________________________________ 10
2. Indices for AEs, EMs, and LIDCs _______________________________________________________________ 11
3. Distribution of the Ratios of FTEs and Active Taxpayers to Labor Force _______________________ 12
4. Operational Strength, Size of Tax Agency Staffing, and Size of Taxpayer Base ________________ 12
5. Compliance Risk Management, Digitalization, and Staff Size Out of Labor Force ______________ 15
6. Operational Strengths and Estimated Tax Collections _________________________________________ 21

TABLES
1. Correlations Among ISORA Sub-Indices _______________________________________________________ 13
2. First Stage Regression Outcomes______________________________________________________________ 19
3. Second Stage Regression Outcomes __________________________________________________________ 20
4. Second Stage Regression Outcomes with Sub-Indices – Single Variate _______________________ 22
5. Second Stage Regression Outcomes – Multivariate ___________________________________________ 23

APPENDICES
I. Sub-Indices Compiled to Reflect Facets of Revenue Administration ___________________________ 30
II. Correlation Between Tax Administration Sub-Indices in 2015 and 2017 _______________________ 33
III. Cross Section Regression Results _____________________________________________________________ 34
IV. The Impact of Staffing and Taxpayers on Tax Collection ______________________________________ 35
V. Second Stage Regression Outcomes Based on Different First Stage Regressions –
Operational Strength Index ______________________________________________________________________ 37
VI. Second Stage Regression Outcomes Based on Different First Stage Regressions –
Single Variates ___________________________________________________________________________________ 39
4

VII. Second Stage Regression Outcomes Based on Different First Stage Regressions –
Multivariate ______________________________________________________________________________________ 40
VIII. LTO and Tax Revenue Performance _________________________________________________________ 41
IX. The Normality Test of Error Terms ____________________________________________________________ 42
5

 I. INTRODUCTION

1. Mobilizing tax revenue is essential for a country’s development. Achieving stable
domestic tax revenue allows budget resources to finance their essential spending needs
(e.g., healthcare, education, and critical infrastructure). As noted in Besley and Persson (2009) and
Gaspar et al. (2016), increasing tax collection is important for economic growth and
development. For many developing countries, enhancing tax revenues is critical for the
attainment of the Sustainable Development Goals (IMF, 2018). In order to build up tax capacity,
country experiences suggest the importance of tax policy and administration reforms. 2

2. The recent Covid-19 pandemic also highlights the importance of establishing sound
administrative features in tax administration. With the pandemic, many countries are
experiencing erosion of tax collection, reflecting the decline in economic activities and possible
deterioration in tax compliance. Most tax administrations have had to shift to working remotely,
with little or no face-to-face contact with taxpayers. Tax administrations’ practices will have an
impact on their ability to adapt and respond to changing circumstances. The situation
underscores the importance of good tax administrative features. After the pandemic recedes,
strengthening tax administration would be even more important because of the critical need to
generate fiscal resources for addressing development needs and safeguarding debt sustainability
through enhancing revenue mobilization.

3. Despite the importance of tax administration to revenue collection, empirical
literature on this subject has been limited. Many country experiences suggest the benefits of
tax administration reforms, in terms of increased taxpayer compliance, increased transparency,
and perceptions of fairness of the tax system, among other outcomes. Various reform efforts
have been made in many developing countries (often assisted by IMF and other international
partners), however, there has been limited empirical literature on this matter, largely owing to the
lack of data on practices and features of tax administration. This poses some important
questions. Can the beneficial outcomes of better tax administration be empirically supported? If
so, what specific practices and characteristics of tax administration would be associated with
better tax performance?

4. This paper empirically examines the benefits of specific tax administration practices
and characteristics, using the novel dataset of the International Survey on Revenue
Administration (ISORA), based on the two-step approach. The ISORA dataset results from the
completion of a standardized questionnaire designed jointly by the ISORA partners, 3 based on
responses from 135 administrations in 2016, and 159 administrations in 2018. It covers a wide
spectrum of data on institutional characteristics, practices, and characteristics of tax

2 Akitoby et al. (2018)—examining a dataset covering 55 episodes of large tax revenue increases in developing

countries—find that multi-pronged tax administration reforms often go hand in hand with tax policy measures.
3 Inter-American Center for Tax Administration (CIAT), Intra-European Organization of Tax Administrations (IOTA),
the IMF, and the Organisation for Economic Co-operation and Development (OECD) (see http://data.rafit.org).
6

administration. Given the limited availability of the historical data from the ISORA, the analysis in
this paper is based on the two-step approach, as proposed by Hsiao (2003). This would allow us
to focus on the effects of tax administration while controlling for other factors
(e.g., macroeconomic developments and tax policy changes).

5. The paper confirms the importance of sound design of practices and characteristics
of tax administration agencies to mobilize domestic tax revenue (Box 1). 4 The empirical
results reveal that the operational strength of the agency is positively and strongly associated
with tax revenue. Among emerging market and low-income economies, countries at the top 25
percent (in terms of operational strength) collect more tax revenues (by 3.25 percent of GDP)
than countries at the lowest 25 percent, assuming other conditions are equal. Our results also
highlight the importance of adopting key tax administration practices and characteristics—such
as compliance risk management (CRM), use of third-party data, degree of digitalization, service
orientation, and public accountability.

 Box 1. Key Findings of This Paper
 • The practices and characteristics of tax administration agencies matter significantly for tax
 performance. The operational strength of the agency, comprising compliance risk management
 (CRM) practices, the use of third-party data, degree of digitalization of services, service orientation,
 public accountability, and autonomy, is tightly associated with tax collections.

 • Amongst sound practices of tax administration, CRM and the use of third-party data are particularly
 important. To enhance tax collection, tax administration reform efforts should prioritize:
 (i) strengthening CRM by adopting automated risk profiling and electronic audits; and (ii) utilizing
 third party data by adopting computer systems for processing the data and prefilling returns.

 • Many of the above factors are highly correlated. This aligns with advice to countries that tax
 administrative reform benefits derive from the strategic integration of multiple components, rather
 the implementation of individual measures. For example, it is the effective operation of an office or
 program for large taxpayers that matters, rather than the establishment of such an office or
 program.

 • Furthermore, adequately staffing tax administration agencies is important. Increased staffing of a tax
 administration agency improves revenue performance up to a threshold of 0.25 percent of the labor
 force. The staff complement of many LIDC tax administrations is below this level. Broadening the
 taxpayer base is important. The number of active taxpayers (in relation to the labor force) matters for
 tax collection.

4These findings are also supported by country experiences of tax administration measures (Akitoby et al., 2018).
Examining a dataset covering 55 episodes of large tax revenue increases in developing countries, they find that
broadening the tax base for both direct and indirect taxes by means of revenue administration and tax policy,
especially through improvements in compliance and by reducing exemptions and/or eliminating tax holidays,
were frequently used measures. In more than half of the episodes, improvements in information technology (IT)
systems provided support for core revenue administration processes, with enhanced tax collection following the
implementation of an IT strategic plan, the enhancement of the IT system, the computerization of tax and
customs administration to support tax payments, and the filing and use of third-party information.
7

6. The rest of the paper is organized as follows. Section II presents a brief review on
related literature. Section III describes the ISORA dataset and key stylized facts on tax collection
and design of tax administration. Section IV describes the empirical methodology. Section V
discusses empirical findings. Section VI concludes with policy implications.

 II. LITERATURE REVIEW

7. A number of studies examine various determinants of tax revenue performance.
The impact of the structure of the economy, economic dynamics, socio-political factors, and tax
policy have been examined through cross-sectional studies, the analysis of panel data, and case
studies. Several studies point out the complex interrelationship of factors impacting revenue
outcomes, and the difficulties in isolating relevant factors (Kidd, 2006; Dom, 2017).

• A stream of literature investigates how the level of economic development and
 structure affect revenue collected. There is broad consensus that per capita GDP is
 positively correlated with revenue (Gupta, 2007; IMF, 2018). The contribution of agriculture to
 the economy is generally found to be negatively correlated with central government revenue
 (Yohou, 2017), although not in all studies (Boukbech, 2018; IMF, 2018). Gupta (2007) notes
 that per capita GDP and agriculture’s value add as a proportion of GDP are strongly
 correlated. Revenue collections are also correlated with trade openness (Gupta, 2007).

• Some studies explore the impact of changes in tax policy on revenue collection, though
 proxies for measuring the impact of tax policy are not well-established yet. Akitoby et
 al. (2018) found that episodes of revenue growth in emerging markets and low-income
 countries were frequently associated with tax policy reforms such as the reduction of
 exemptions, and/or rate increases in indirect taxes. Dabla-Norris et al. (2017) investigated
 how the level of tax compliance burden faced by firms affects firms’ performance in 21
 countries and considered the corporate income tax (CIT) and value-added tax (VAT) rates to
 control for tax policy. The impact of the introduction of a VAT has been examined in various
 studies, with some finding a growth in revenue in Sub-Saharan Africa (Ebeke, 2014) and the
 Caribbean (Schlotterbeck, 2017), while in others no significant impact was identified (Ngoma,
 2017). Ngoma finds that when controlling for other reforms on non-resource tax revenue,
 there is no evidence that the introduction of a VAT increased tax collection performance in
 Sub-Saharan Africa. Productivity of CIT and VAT is found to be lower in countries with a
 higher number of exemptions (IMF, 2018).

• Recent literature also recognizes the role of socio-political factors in determining the
 level of revenue relative to GDP. The Gini coefficient, a measure of income inequality,
 appears to be negatively correlated with revenue collection, while the spending on education
 within a country correlates positively with performance (Fenochietto, 2013). Amongst
 countries with similar incomes, those with the lowest levels of corruption collect four more
 percentage points of GDP in tax revenues, than those with the highest corruption levels (IMF,
 2019).
8

8. There is, however, far less empirical literature on the effect of tax administration
practices and characteristics on tax performance. As one of these few pieces of literature,
Crivelli (2018) conducted cross-sectional correlation analyses between ‘tax administration
strength,’ comprising a range of tax administration characteristics and tax efficiencies (i.e., VAT,
PIT, and CIT) in Europe using data collected by the OECD. 5 This study—while being novel in
comprehensively exploring the effects of specific administration features—does not control for
other factors (such as macroeconomic environments and tax policy).

• Other studies examine the effects of a Large Taxpayer Office (LTO) or program. Baum (2017)
 finds that LTOs enhance revenue collections through dampening the perception of
 corruption, while Ngoma (2017) does not identify any positive change in revenue associated
 with LTO establishment. Ebeke (2016) does not find the positive impact of a LTO but notes
 that the establishment thereof is often a precursor for the introduction of VAT or
 establishment of a semi-autonomous revenue authority (and thus its impacts).

• In addition to these empirical studies, there are some country case studies on tax
 administration: Pomeranz (2015), for instance, finds that the use of third-party data impacts
 VAT collections positively, while Almunia and Lopez-Rodriquez (2018) finds that the
 increased monitoring and auditing of large firms through an LTO enhanced CIT collected
 from large companies. Both studies suggest that a combination of factors—use of third-party
 data together with enforcement capacity is more effective than either factor alone.

9. A lack of comparable data on the practices and characteristics of tax
administrations hindered comprehensive empirical studies. While Crivelli (2018) conducted
cross-country analyses on tax administration in Europe using data collected by the OECD, such
data was not available for countries in other regions. Using the novel ISORA dataset, this paper
fills the gap by comprehensively studying various practices and characteristics of tax
administration across countries and their impacts on tax performance while controlling for other
factors (such as macroeconomic environments, tax policy, and socio-political factors).

5 Some studies have examined selected tax administration practices and characteristics and revenue collection

effectiveness in cross-sectional studies. CASE (2018) found that the larger scale of the tax administrations
(measured as its total administrative cost to GDP) decreased the estimated VAT gap, and that the share of the
administration’s IT expenditure (measured by the share of the administration’s IT expenditures to total
administrative cost) reinforces this impact on VAT gap.
9

 III. DATA ON TAX ADMINISTRATION PRACTICES AND CHARACTERISTICS

10. The ISORA dataset provides a source of comparable data on the characteristics and
practices of revenue administrations across income groups in all regions. The most recent
data (for 2017) covers 37 Advanced Economies (AEs), 76 Emerging Markets (EMs), and 46 Low-
Income Developing Countries (LIDCs). All regions are represented in the data collected. For the
ISORA dataset, tax administrators of each country provide information on their operational
practices and other characteristics based on questions and definitions agreed on by four partner
international organizations. As the data is not in the public domain, inaccuracies may remain
despite checking for inconsistencies in the data provided. 6

11. Based on the ISORA data, the operational strength index of tax administration is
constructed with seven sub-indices on specific tax administration practices and
characteristics. The ISORA dataset consists of responses to both numerical and categorical
questions, with 982 data points. We categorize these responses into seven different sub-indices
and compile them into an overall operational strength index. While ISORA questions were not
designed with the creation of indices in mind, the broad set of questions lends itself to thematic
grouping. 7 Features associated with facets of the administration’s operations and generally
regarded as indicators of good practice are grouped to create each sub-index. 8 The seven
sub-indices are: (i) degree of autonomy; (ii) establishment of LTO or large taxpayer program; (iii)
public accountability; (iv) service orientation; (v) CRM approach; (vi) use of third party data; and
(vii) digitalization of services (depicted in Figure 1, and further detailed in Appendix 1). CRM, the
use of third party data and digitalization of services are advocated to enhance compliance (IMF,
2015) and all these features have been recommended to reduce corruption potential with the
administration (World Bank, 2019).

6 From ISORA 2020 onwards, all data will be publicly available, which will further promote accuracy.
7 For example, an autonomy index may be determined from the responses to 14 questions, that include whether
the tax administration operates through a semi-autonomous body or not, the discretion it has to manage
operational and capital budgets, the discretion it has in managing human resources, and whether it has authority
to design its organization structure, set performance standards and provide tax policy advice. Thus, in contrast to
previous studies that distinguish only between whether the tax administration operates through a semi-
autonomous body or not, the relationship between the degree of autonomy and revenue performance can be
examined.
8Respondents may have a tendency to give a ‘good practice’ response, in cases where the issue may not be clear
cut.
10

 Figure 1. Indices Compiled to Reflect Facets of Tax Administration

Source: ISORA (2017).

12. Closely looking at these indices, AEs tend to have higher values across them (Figure
2). The radar diagram points the strength of tax administration in AEs (relative to EMs and
LIDCs), for all but one index on the establishment of an LTO. 9 Almost all EMs and LIDCs have
LTOs, while just under 80 percent of AEs indicate an LTO or program for large taxpayers. 10 The
box and whiskers plots of the operational strength index show a spread in value within each
country grouping, with the mean and median value for AEs greater than that of EMs and LIDCs.

9 The LTO indicator is binary (0=no LTO, 1=LTO), i.e., effectively a dummy indicator.
10Large taxpayers may be managed through dedicated offices, or programmatically. Many AEs manage large
taxpayers through a program, rather than through separate offices.
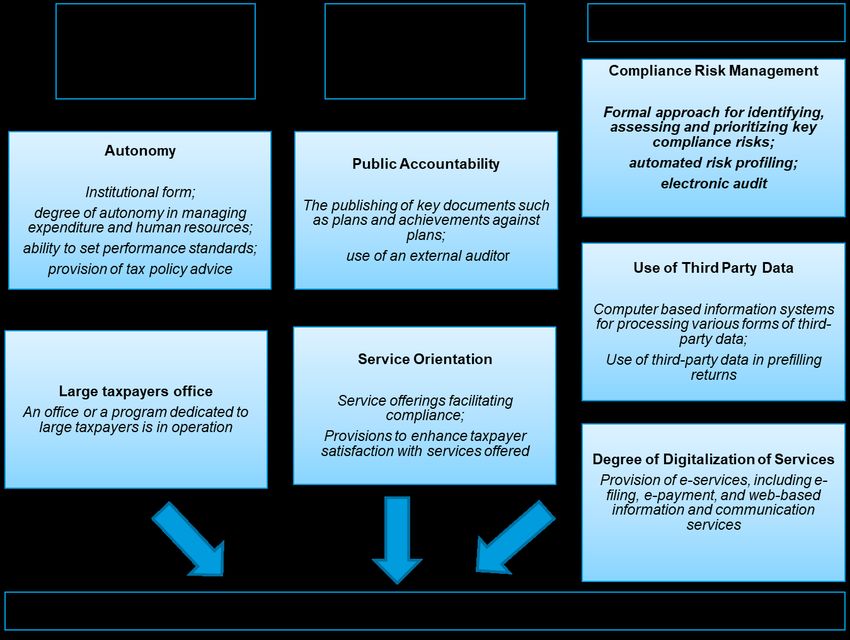
11

 Figure 2. Indices for AEs, EMs, and LIDCs

 Sources: ISORA (2017) and authors’ calculation.

13. Two further descriptors of tax administrations have been derived from ISORA
responses—the ratio of full-time-equivalents 11 to labor force, and the ratio of active
taxpayers to the labor force. The first provides an indication of the scale of the tax
administration. For the second, active taxpayers are taxpayers that interact with the tax
administration, providing a proxy for the tax administration’s workload. It is worth noting that the
number of active taxpayers is a product of tax policy, societal attitudes and norms, as well as
efforts by the administration to ensure that all taxpayers comply with their tax obligations. The
spread in these ratios by AE, EM, and LIDC groupings is illustrated in Figure 3 below.

11 Full Time Equivalent (FTE): An FTE of 1 means resources equal to one staff member available for one full year.
12

 Figure 3. Distribution of the Ratios of FTEs and Active Taxpayers to Labor Force

 Source: ISORA (2017).

14. The tax-to-GDP ratio is positively correlated with the operational strength index, as
well as the ratios of staff to labor force and active taxpayers to labor force. As Figure 4
shows, the ratios of staff to labor force 12 and active taxpayers to labor force vary by one and two
orders of magnitude respectively, exhibiting far smaller values in general for LIDCs than for AE or
EM countries. In countries with a higher active taxpayer to labor force ratio, tax administrations
are likely to have higher compliance risk management and third-party data indices.

 Figure 4. Operational Strength, Size of Tax Agency Staffing, and Size of Taxpayer Base

 Sources: ISORA (2017) and authors’ calculation.

12 The staffing level of the tax administration is measured in terms of the number of FTEs.
13

15. There are high correlations between sub-indices of tax administrations. Table 1 on
the correlation between the sub-indices generally indicates that countries with a stronger index
on one aspect tend to be stronger on other indices. The service orientation index, for instance,
correlates strongly with all other indices (LTO establishment aside). Given common underlying
information management capability prerequisites, the correlations between the use of third-party
data and both compliance risk management and the degree of digitalization are also high. Tax
administration reform experience demonstrates that the major benefits of administrative reform
arise from the strategic integration of multiple components, rather than the implementation of
individual measures (IMF, 2015). These correlations, while not unexpected, present challenges in
isolating exactly which characteristics or practices are associated with enhanced revenue
performance.

 Table 1. Correlations Among ISORA Sub-Indices

16. The recent Covid-19 pandemic is affecting tax administration (Box 2). With the
pandemic, many countries are experiencing erosion of tax collection, reflecting the decline in
economic activities and likely deterioration in taxpayer compliance. Thus, securing revenue
streams and bringing taxpayers’ compliance behavior back to pre-crisis levels and beyond, will
be a key priority for revenue administrations in the months and years ahead.
14

 Box 2. Potential Impact of Covid-19 on Tax Administration

During the pandemic, tax administration is likely to be adversely impacted. Containment
efforts for Covid-19 can slow down economic activities, while the easing of taxpayer
obligations, such as extensions to filing and payment deadlines, together with the
administration of crisis relief measures, adds complexity to the tasks of compliance monitoring
and non-compliance response. As discussed in IMF (2020), during the crisis, filing, declaration,
and payment compliance may deteriorate due to extended deadlines, limited availability of
staff and taxpayers weakened financial positions. Face-to-face interactions of tax
administration officials and taxpayers are limited, in the realm of both services and
enforcement (IMF, 2020).1 Most tax administrations have had to shift from face-to-face audits
to desk audits.2 For administrations with limited digital service offerings and/or remote access
to data, these challenges are more severe. Furthermore, for the tax administration agencies
with lower levels of staffing, any further reduction due to illness in staff may further undermine
tax collection.

Strong tax administrative operations will be particularly important in the post Covid-19
recovery period. After the pandemic recedes, strengthening tax administration will be even
more important, because of the critical needs to generate fiscal resources for addressing
development needs and safeguarding debt sustainability through enhancing revenue
mobilization. Enhanced efforts for strengthening tax administration should be sought,
accompanied by appropriate reform efforts for tax policy. In the case of staff shortages, the
focus should turn to prioritizing staffing for “critical” areas, based on a risk management
approach. The expansion of digital services should be explored, where possible.

LIDCs may experience greater challenges in maintaining compliance and revenue
collections during the pandemic and in the recovery period. They may be less able to work
remotely effectively, due to a lower degree of digitalization. As shown in Figure 5, LIDCs are in
general less equipped with CRM and digitalization. The figure further illustrates LIDCs’ lower
level of tax administration staff that could pose challenges for business continuity during the
pandemic.

––––––––––––––––––

1 FAD Notes on ‘Tax and Customs Administration Responses’ and ‘Revenue Administration: Reinvigorating
Operations to Safeguard Collection and Compliance,’ available from
https://www.imf.org/en/Publications/SPROLLs/covid19-special-notes#fiscal.
2 In a survey of 89 tax and customs administrations (conducted by the IMF in April 2020), over 70 percent

indicated that measures easing taxpayer obligations had been implemented and 64 percent had made
adjustments to their audit program, with over half of the administrations noting a shift from face-to-face to
desk audits.
15

 Figure 5. Compliance Risk Management, Digitalization, and Staff Size Out of Labor Force

 Source: ISORA (2017).

 IV. EMPIRICAL METHODOLGY

17. To empirically explore the impact of practices and characteristics of tax
administrations, the two-step approach proposed by Hsiao (2003) is used. The ISORA
dataset is only available for 2014-17, and there is little variation in tax administration features
within such a short period. Thus, the typical panel estimation with fixed effects cannot be
applied. 13 So, we employ the “two-step approach” proposed by Hsiao (2003). Several studies
have adopted this approach to address the problem posed by time-invariant variables in the
panel dataset. 14

13Currently ISORA data are available only for four fiscal years, during which period the indices and ratios
described do not change significantly. To illustrate the limited change in index values over this period, the
correlation between the compliance risk management, third-party data and service orientation indices for 2015
and for 2017 are 0.87, 0.84, and 0.86, respectively. The correlation between 2015 and 2017 ratios for FTEs to labor
forces and active taxpayers to labor force are 0.96 and 0.93, respectively (Appendix 2).
14 Alesina et al. (1999) applied the two-step approach and found that a country with stronger budget institution
(which is a time invariant) has better outturn of primary balance in Latin America. Recently, Baum et al. (2019)
studied how corruption (time invariant) affects the performance of SOEs using firm level data across more than
80 countries. Plümper and Troeger (2007) proposed a similar approach but with a three-step procedure, where
the first two steps are same as Hsiao (2003) but pooled OLS regression is added at the last step to produce more
reliable estimates. However, Greene (2011) suggested using only the first two steps because the third step is
based on the incorrect covariance matrix.
16

First Step

18. At the first step, we estimate the coefficients for the time-varying control variables,
including tax policy changes, using a fixed effect panel regression. The model for the first
stage regression can be written as follows:

 , = 0 , + + +

where is the tax to GDP ratio excluding trade taxes and social security contributions, is a set
of time variant control variables, is a set of estimated tax collection after controlling other
factors (i.e., country fixed effects), is a set of time fixed effects, and is the residual. 15 As time
varying control variables, macro-economic data such as GDP, CPI, trade openness, and external
debt are included. We also control for the structure of economy by adding the share of oil export
and agriculture out of GDP.

19. At this first step, we also employ a novel approach to control for tax policy
changes. In examining tax performance, controlling for tax policy changes is technically
challenging, as there is no convenient variable representing tax policy of each country. In the
absence of information on effective tax rates across countries, we use “projected” tax revenues as
a proxy for the revenues reflecting all anticipated changes of tax policy. As the projected
revenues may reflect not only tax policy changes but some gains from improving the tax
administration, we also test other indicators as robustness check. 16 These proxies have their own
deficiencies in measuring tax policy. Despite the limitations, however, our consistent findings
suggest robustness.

• The difference between the budgeted revenue of this year as share of projected GDP and the
 actual revenue of last year as share of actual GDP:17 The budgeted revenue reflects planned
 tax policies and the economic forecast when the budget is prepared. Since macroeconomic
 changes are controlled separately in the regressions and within-year tax policy changes are
 rare, this gap can reflect the effect from changes in tax policy. 18

15 Considering that many countries have separate entities for collecting customs and tariffs, we excluded trade
tax revenues from total tax revenues. We primarily used the tax data from IMF’s World Economic Outlook (WEO)
database and replace the whole tax series of a country with corresponding OECD data, if there are missing values
in the WEO database. The classifications of taxes from IMF and OECD are similar except that OECD includes social
security contributions as a form of taxes, so we excluded social security contributions when using OECD data.
16 If any tax administration improvement effects are already anticipated in the budgeted revenue, this only

reinforces our findings in the second stage regression. Tax administration features are still significant in the
second stage despite some of the explanatory power having been captured in the first stage.
17 The WEO April version vintage data for year t are used as the projected tax and GDP data for year t. (The data
from the May version of the OECD economic outlook are complements of WEO data.)
18The level of projected and actual tax revenues reflects the tax structure of a country (such as degree of
progressivity, exemptions, tax holiday and so on) along with macroeconomic situations. Since we use the gap as a
proxy, the level of tax revenue cancels out and the gap captures the changes in tax policy and macroeconomic
development.
17

• The difference between the budgeted revenue of this year as share of projected GDP and the
 budgeted revenue in last year as share of projected GDP: While less accurate a proxy for the
 tax policy changes in year t, this gap can reduce possible systematic biases in budget process
 such as continuous over or underperformance of actual revenue vs. the revenue projections
 in the budget.

• Top tax rates: Changes in tax rates may lead to change in tax collections. Since our tax rate
 data from the IMF Tax Rate Database (DART) record only the top tax rates for tax types, any
 tax policy changes such as tax cuts, changing the tax bracket, and exemptions which does
 not affect top rate cannot be captured.

Second Step

20. At the second step, the estimated fixed effect values (from the first step) are
regressed on the time-invariant tax administration variables. This step looks at the part of
tax collection (as share of GDP) for each country, i, that cannot be explained by the time varying
variables in the first stage, and estimates the relationship between this and the practices and
characteristics of countries’ tax administration using ISORA data. The model for the second stage
regression can be written as follows:

 � = 1 + ℎ

where � is the estimated tax collection after controlling for other factors from the first stage, is
the set of time invariant tax administration’ practices and characteristics, and ℎ is the
unobserved heterogeneity. 19

21. The role of the practices and characteristics of tax administration agencies is
investigated at three different levels. First, we develop a compound index measuring the
operational strength of the agency by averaging the individual sub-indices. Second, we run
regressions with the individual sub-indices to test which practices and characteristics are
positively correlated with tax outcomes. This approach reduces the possible multicollinearity
problem given that the good practices and characteristics are correlated with each other. Lastly,
we try to investigate the impact of multiple features of tax administration by including all tax
administration sub-indices in the regression and distinguishing the significant ones that are
tightly associated with tax revenue performance. This complements the second approach, as the
inclusion of all variables may lead to multicollinearity, while regressions with one variable only
may lead to omitted variable problem.

19We used the weighted least square estimation method to correct for heteroskedasticity. The outcomes turn out
to be robust regardless of the techniques to control for the standard errors such as Bootstrap and Huber-White
estimations.
18

 V. EMPIRICAL FINDINGS

First-Stage Regression Results

22. As expected, macro-economic and economic structure variables are significantly
associated with tax collections, so controlling for their effect from the data is necessary
(Table 2). 20 Regardless of the choice of proxies for tax policy, per capita GDP is positively
associated with tax performance as it is expected to be a good indicator of the overall level of
economic development (Gupta, 2007). The results also find that the coefficient for trade
openness (measured by the combined share of exports and import) is positive and statistically
significant, consistent with the literature (Leuthold, 1991; Ghura,1998). The effect of inflation on
tax revenue is negative, possibly reflecting the Olivera-Tanzi effect (the lags in revenue collection
reduce revenue relative to GDP). The degree of external indebtedness of a country turns out to
be insignificant suggesting its mixed effects on tax collections. 21 To control for the structure of
the economy, we also include variables for oil export and agriculture as a share of GDP. The
coefficient of oil exports is positive and statistically significant (likely reflecting larger tax
collection from the sector in larger oil exporters). The share of the agricultural sector in GDP
turns out to be insignificant (likely reflecting possible multicollinearity between the share of
agriculture and per capita GDP). The coefficients of all proxies of tax policy are positive and
statistically significant, suggesting a robust effect on collections, as expected.

20 A Hausman test confirmed the validity of the fixed-effect estimator vs. a random effect alternative.
21Having external funding sources could reduce the needs for mobilizing higher revenues while, on the other
hand, a country may choose to increase taxes with a view to generate revenue to service the public part of
external debt which leads to higher revenue (Tanzi, 1992).
19

 Table 2. First Stage Regression Outcomes

 Dependent variable: Tax revenue/GDP (1) (2) (3)
 Tax Rate Bdgt-Act Bdgt-Bdgt
 Log (PerCapitaGDP_PPP), lagged 0.1810*** 0.1374*** 0.1417***
 (0.0402) (0.0406) (0.0419)
 Square log (PerCapitaGDP_PPP),
 lagged -0.0110*** -0.0084*** -0.0088***
 (0.0024) (0.0024) (0.0025)
 Trade openness (out of GDP), lagged 0.0228*** 0.0236*** 0.0251***
 (0.0058) (0.0066) (0.0067)
 External debt (out of GDP), lagged -0.0005 -0.0038 -0.0063
 (0.0033) (0.0046) (0.0051)
 CPI, lagged -0.0094 -0.0348*** -0.0308**
 (0.0119) (0.0131) (0.0128)
 Terms of Trade (2000=1), lagged 0.0020 0.0021 0.0038
 (0.0038) (0.0039) (0.0039)
 Oil exports (as a % of GDP), lagged 0.1414*** 0.1570*** 0.1452***
 (0.0254) (0.0224) (0.0225)
 Log (Agri, %GDP), lagged 0.0029 -0.0032 -0.0006
 (0.0046) (0.0054) (0.0056)
 Control Corruption, lagged 0.0056 0.0027 0.0047
 (0.0044) (0.0047) (0.0049)
 Top Combined CIT Rate (%), lagged 0.0002
 (0.0003)
 Top Combined PIT Rate (%), lagged 0.0002
 (0.0002)
 Standard VAT Rate (%), lagged 0.0030***
 (0.0006)
 Budgeted (t) minus Actual (t-1) tax rev. 0.1273***
 (0.0407)
 Budgeted (t) minus Budgeted (t-1) rev. 0.1953***
 (0.0323)
 Constant -0.6443*** -0.4239** -0.4323**
 (0.1655) (0.1707) (0.1744)
 Observations 675 894 830
 R-squared 0.2301 0.1984 0.2441
 Number of countries 105 127 125
 Country FE YES YES YES
 Year FE YES YES YES
Note: Estimation of equation by panel fixed effect. Standard Errors in Parentheses. *, **, *** denote statistical
significance at the 1, 5, and 10 percent levels, respectively. Bold italics means statistically significant at least 10
percent level.

Second-Stage Regression Results

23. The fixed-effect values estimated in the first stage are regressed against: (i) an
operational strength index (aggregated ISORA sub-indices); (ii) each sub-index of ISORA
data separately; and (iii) all sub-indices in the regression at the same time.
20

24. The regression results on the operational strength confirm that the strength of tax
administration, as measured by the index compiled from ISORA data, is highly relevant for
tax performance (Table 3). 22 The estimated tax collection after controlling for the influence of
other relevant factors from the first stage—the estimated country fixed effect—was regressed on
the operational strength index of tax administration, which is the average score of seven sub-
indices ranging from 0 and 1. The coefficients of the index are positive and statistically
significant, and the finding also holds when the sample is restricted to emerging and low income
countries. Variables considering the relative size of the administration such as the share of staff in
tax administration agency in a country’s total labor force and the share of active taxpayers in the
labor force are included to control for features of the agencies that might not be captured by the
operational strength index.

 Table 3. Second Stage Regression Outcomes (Panel Between Estimation) 23
 Dependent variable: All Countries EMs and LIDCs
 Estimated
 Country Fixed Effects (1) (2) (3) (4) (5) (6)
 Operational Strength 0.2226*** 0.1767*** 0.1228*** 0.1546*** 0.1485*** 0.1277***
 (0.0349) (0.0358) (0.0417) (0.0357) (0.0377) (0.0438)
 #Tax Staff/LaborForce 0.0802*** 0.0535** 0.0472* 0.0487
 (0.0235) (0.0250) (0.0278) (0.0366)
 Sq(#Tax Staff/LaborForce) -0.0157* -0.0130 -0.0058 -0.0110
 (0.0083) (0.0087) (0.0112) (0.0171)
 ActiveTaxpayer/LaborForce 0.0443*** 0.0346*
 (0.0122) (0.0196)
 Constant -0.1187*** -0.1444*** -0.1122*** -0.0729*** -0.1027*** -0.0965***
 (0.0222) (0.0235) (0.0273) (0.0215) (0.0245) (0.0297)

 R-squared 0.2911 0.4937 0.5753 0.1935 0.3672 0.3941
 Number of countries 101 85 70 80 64 54
Note 1: Above second stage regression outcomes are based on the first stage regression using the difference
between the budgeted and actual tax revenue as a proxy for the tax policy. 24
Note 2: Estimation of equation by panel between effect with least Square Estimation. Standard Errors in
Parentheses. *, **, *** denote statistical significance at the 1, 5, and 10 percent levels, respectively. Bold italics
means statistically significant; at least 10 percent level.

25. The square term of tax administration staff controls for the non-linear relationship
between the size of staff and tax performance. The coefficients for this term—marginally
significant for all countries and insignificant for EMs and LIDCs—are negative. This suggests the

22We used the gap between budgeted revenue and actual revenue as our baseline model in the first stage.
Again, regression outcomes are consistent regardless of proxies for tax policy (Appendix 6).
23The second stage regressions adopted the between estimation of panel dataset. Given that the between
estimation uses averages of the explanatory and response variables, the regression results are similar to those of
cross section analysis on a certain year, except that observations in the cross-section analysis are often smaller
than those of the between estimation due to missing variables in years.
24Other tax policy proxies such as tax rates and the gap between the budgeted revenue of this year and last year
are also tested and similar outcomes are obtained (presented in Appendix 5).
21

decreasing marginal tax gains as the staff level incrementally increases among all countries,
leading to a threshold where additional staffing does not increase revenue. However, EMs and
LIDCs do not reach this threshold yet, implying potential for ramping up revenue by hiring staff
(see Appendix 4 for details).

26. Based on the results, we further estimate the possible magnitude of tax gains by
improving the operational strength of the tax administration agency. Among EMs and
LIDCs, a country at the top 25 percentile threshold in terms of operational strength collects larger
tax revenues by 3.25 percent of GDP than a country at the lowest 25 percent threshold, assuming
other conditions are equal (we estimate tax collections at both quartiles using the estimates from
the column (5) in Table 3). 25 Though our analysis does not prove strict causality between
operational strength and tax outcomes, the estimated results suggest that a country with
stronger tax operational capacity collects significantly more tax revenues in EMs and LIDCs.

 Figure 6. Operational Strengths and Estimated Tax Collections

 Sources: ISORA (2017) and authors’ calculation.

27. The results on each ISORA sub-index suggest that most indices on practices and
characteristics of tax administration are positive and statistically significant. Here we
regress the country fixed effects from the first stage on these sub-indices separately to identify
which features of tax administration play an important role in explaining the tax collection. The
regressions found that six sub-indices out of seven are significant. Interestingly, the goodness of

25
 The share of active taxpayers out of labor force is not included in our baseline model due to the high
correlation with the operational strength. A higher active taxpayer ratio may reflect the tax administration’s
efforts to broaden taxpayer bases by ensuring that all taxpayers comply with their tax obligations.
22

fit measures (R-squares) are quite varying among sub-indices, which provides a rough guidance
to the relative importance of specific features in explaining tax performances. The establishment
of the LTO was not found to be significant. Most countries indicated the existence of an LTO, but
the nature of program for large taxpayers varies considerably, according to data provided in
ISORA. While many countries segmented taxpayers by size for ease of collections, including
programs for LTOs, the impact of the establishment of an LTO is not confirmed. This suggests
that the LTO needs to be effectively operationalized (see Appendix 8 for details).

 Table 4. Second Stage Regression Outcomes with Sub-Indices – Single Variate 26

Dependent var: Estimated (1) (2) (3) (4) (5) (6) (7)
Country Fixed Effects

Comp. Risk Management 0.1154***
 (0.0184)
Third Party Data 0.1136***
 (0.0181)
Digitalization 0.0830***
 (0.0197)
Service Orientation 0.1175***
 (0.0348)
Public Accountability 0.0874***
 (0.0286)
Autonomy 0.0809**
 (0.0322)
Est. LTO -0.0245
 (0.0325)
Constant -0.0457*** -0.0240*** -0.0273** -0.0592** -0.0245 -0.0408* 0.0416
 (0.0117) (0.0089) (0.0125) (0.0238) (0.0155) (0.0245) (0.0317)

R-squared 0.2835 0.2843 0.1515 0.1034 0.0860 0.0600 0.0057
Number of countries 101 101 101 101 101 101 101
 Note: Estimation of equation by panel between effect with least Square Estimation. Standard Errors in
 Parentheses. *, **, *** denote statistical significance at the 1, 5, and 10 percent levels, respectively. Bold italics
 means statistically significant at least 10 percent level.

28. Among other variables, enhancing CRM and actively using third-party data show
stronger correlation with tax collections. When all tax administration sub-indices together
with quantitative variables are included in the second stage regressions, CRM and the use of
third-party data remain significant, while other variables become insignificant (Table 5). It implies
that given the tax administrations’ limited resources, priority should be given to the
enhancement of the tax administration’s ability to identify taxpayers’ risk profiles, apply different
treatments to different risk groups, and establish computer-based information system enabling
data from third parties. This is not to say that the other activities do not matter—but, as a matter

26Given the low R2 values for some variables, we tested the normality of residuals and found that normality
cannot be rejected, which supports the validity of our test results (Appendix 9).
23

of priority, removing bottlenecks in compliance risk management and use of third-party data
seems to deliver stronger tax collection.

29. The size of staff in tax administration is also significantly associated with tax
collections, up to a point. The share of tax staff out of labor force is positively associated with
tax collection while its quadratic term is negatively associated with tax collections. It suggests
that tax performance could improve with increasing size of staff in tax agencies, but there is an
optimal size beyond which this effect is no longer present.

 Table 5. Second Stage Regression Outcomes – Multivariate

 Dependent variable: Estimated (1) (2) (3)
 Country Fixed Effects

 Compliance Risk Management 0.0830*** 0.0772*** 0.0873***
 (0.0212) (0.0226) (0.0247)
 Third Party Data 0.0763*** 0.0607*** 0.0612**
 (0.0199) (0.0206) (0.0237)
 Digitalization 0.0228 0.0098 0.0016
 (0.0215) (0.0220) (0.0225)
 Service Orientation -0.0297 -0.0295 -0.0425
 (0.0438) (0.0432) (0.0472)
 Est. LTO -0.0087 -0.0162 0.0123
 (0.0271) (0.0271) (0.0295)
 Public Accountability -0.0033 0.0112 -0.0180
 (0.0314) (0.0318) (0.0340)
 Autonomy 0.0160 0.0140 0.0103
 (0.0315) (0.0319) (0.0331)
 #Tax Staff/LaborForce 0.0725*** 0.0641**
 (0.0228) (0.0242)
 Sq (#Tax Staff/LaborForce) -0.0153* -0.0177**
 (0.0081) (0.0086)
 ActiveTaxpayer/LaborForce 0.0301**
 (0.0132)
 Constant -0.0508 -0.0809** -0.0891**
 (0.0332) (0.0350) (0.0375)

 R-squared 0.4210 0.5755 0.6492
 Number of countries 101 85 70
Note: Estimation of equation by panel between effect with least Square Estimation. Standard Errors in
Parentheses. *, **, *** denote statistical significance at the 1, 5, and 10 percent levels, respectively. Bold italics
means statistically significant at least 10 percent level.
24

Robustness Checks
30. These results are robust in several directions. We conduct several robustness
checks: 27

• Control variables: We also consider selecting control variables with a low level of correlation
 in order to reduce multicollinearity problems given tax administration sub-indices are
 interlinked to each other (as depicted in Table 1). To test the significance of each of the sub-
 indices (e.g., degree of digitalization, service orientation), we drop the variables with
 correlation higher than 0.4 and conduct panel between regression analysis across all
 countries. 28 Our main results broadly remain unchanged with the regressions using these
 selection processes of control variables. The variables significant in our baseline models stay
 significant while insignificant variables in our baseline models remain insignificant. Some
 variables showing negative signs (for instance service orientation and public accountability)
 in case all sub-indices are included as regressors now have expected positive signs though
 still insignificant.

• Limiting the sample to EMs and LIDCs: One may argue that our findings are driven largely by
 the strong tax revenue performances and good practices and characteristics of AE tax
 administrations. We tested our models only to EMs and LIDCs and the findings remain
 broadly unchanged except that the quadratic term of staffing loses its significance, implying
 that these tax administration agencies are mostly understaffed. It again supports our main
 theme: enhancing key practices and characteristics of tax administration could reap
 significant gains in tax collections among the countries with strong needs for mobilizing
 domestic revenues.

• Keeping the same sample size across the first stage regressions: Given that we are using three
 proxies separately to control for the effects of changing tax policies in the first stage, the
 sizes of sample in the first stage are different across the selection of tax policy proxies
 (Table 2). While two proxies (i.e., the difference between the budgeted revenue and tax
 revenue, and the difference between the budgeted revenue of this year and the last year)
 broadly capture the changes in tax bases, the tax rates proxy looks narrowly at the changes in
 top tax rates in CIT, PIT, and VAT. As robustness checks, we ran regressions keeping the same
 sample size across the three regressions and the outcomes are quite similar to the ones
 presented in Table 2, which suggests that including the tax base does not have any
 significant impact and hence we use the full sample as in the presentation.

• Calculating standard errors with different econometric methods: Our baseline regressions
 adopt the weighted least square method to correct for heteroskedasticity. Different
 techniques for estimating the standard errors are also employed such as the Bootstrapping

27 The results of robustness checks are available upon request.
28For instance, in order to test the effect of improving service orientation on tax collection, we drop the
compliance risk management, third party data, digitalization, public accountability and autonomy indices
showing correlation higher than 0.4 with the service orientation index.
25

 and Huber-White estimation. We found the regression outcomes are robust to the
 techniques.

• Additional variables in the second stage: We also consider variables presumably static and
 reflecting structural factors affecting tax collections (e.g., land-locked country, inequality,
 informality of the economy, and control of corruption). 29 The operational strength of tax
 administrations remains significant with the regressions using these additional control
 variables in the second stage.

 VI. CONCLUSIONS

31. The design and practices of tax administration agencies matter significantly for tax
performance. As far as we know, ours is a novel research empirically examining the importance
of the design features and actual practices of tax administration agencies on tax collection. The
operational strength of the agency is closely associated with tax collections—among EMs and
LIDCs, countries at the top 25 percent (in terms of operational strength index) collect larger tax
revenues (by 3.25 percent of GDP) than countries at the lowest 25 percent, assuming other
conditions are equal. 30

32. Our empirical analyses emphasize the importance of CRM and the use of third-
party data. Our analyses find that adopting key tax administration practices and
characteristics—such as stronger CRM, active use of third-party data, higher level of
digitalization, enhancing service orientation, public accountability, and autonomy—are
associated with higher tax collections, with CRM and the use of third-party data seemingly
delivering stronger tax collection. To enhance tax collection, tax administration reform efforts
could prioritize: (i) strengthening CRM by adopting automated risk profiling and electronic
audits; and (ii) utilizing third party data by adopting computer systems for processing the data
and prefilling returns. These efforts would likely also facilitate effective functioning of LTOs.

29The Gini coefficient and the landlocked country dummy were found to be insignificant, while the control of
corruption variable shows significant association with tax collections. However, we decided not to introduce the
control of corruption in our baseline second stage model because of the high correlation with other control
variables (such as the ratios of tax administration staff to the labor force and active taxpayers/labor force). One
possible explanation is that the control of corruption variable captures broader societal attitudes including
taxpaying culture, which are also associated with tax administration characteristics. In addition, we also
considered a measure of informality (employment in the informal sector as a share of the labor force) but
dropped it because the sample shrinks too much for accurate inference. Finally, one may argue that structural
variables such as the share of agriculture and oil export to GDP should be in the second stage, but they are quite
volatile over time and hence belong to the first stage.
30Changing the operational strength index substantially implies the implementation of extensive tax
administration reform. Generally comprehensive programs to reform tax administration require sustained effort
over years. For example, two TADAT assessments of Uganda
(https://www.tadat.org/assets/files/Uganda_Final_PAR.pdf), five years apart, showed improvement in CRM
practices, as well as enhancements in the approach to ensuring taxpayers are registered, institutional risk
management, the introduction of mandatory e-payment, and improved audit programs.
You can also read