WWW.TOURISMRESEARCH.GOVT.NZ - ACCESSING NEW ZEALAND'S OFFICIAL TOURISM DATA AUGUST 2008
←
→
Page content transcription
If your browser does not render page correctly, please read the page content below

www.tourismresearch.govt.nz
Accessing New Zealand’s Official Tourism Data
August 2008

                                                info@tourism.govt.nz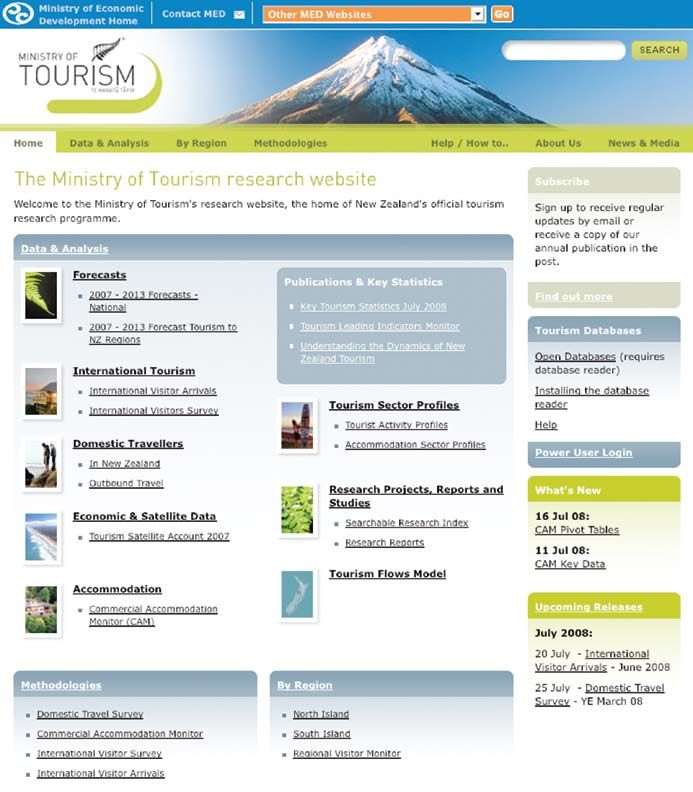
2

                        Tourism is New Zealand’s number one export
                        earner. It contributes $20.1 billion per annum
                        to the economy and employs one in 10 people.
                        The Ministry of Tourism’s research team
                        provides bedrock tourism statistics to aid
                        government and industry planning
                        and decision making.

                                     Contents
                                     About This Booklet                                       3

                                     Core Tourism Dataset – A Quick Guide                     4

                                     Reports, Publications and Tools                          6

                                     What’s On The Web                                        8

                                     How To Use The Website                                   10

                                     International Tourism – International Visitor Arrivals   12

                                     International Tourism – International Visitor Survey     14

                                     Domestic Travellers – In New Zealand                     16

                                     Domestic Travellers – Outbound Travel                    18

                                     Accommodation                                            20

                                     Regional Visitor Monitor                                 22

                                     Forecasts 2008 - 2014                                    24

                                     Economic and Satellite Data                              26

                                     Tourism Flows Model                                      28

                                     The Research Programme – Moving Forward                  30

    www.tourismresearch.govt.nz                                                                    ISSN11763922
3

                            About this booklet

                                                                                                                                                           INTRODUCTION
                            The Ministry of Tourism runs a world-leading tourism research programme which
                            provides statistics, research and interpretation. This is all free to access and use.
                            This booklet will inform you on the programme, the tourism datasets, publications,
                            and electronic feeds available from the Ministry of Tourism.
                            While scanning through this booklet you will learn that if you’re in tourism,
                            the research website, www.tourismresearch.govt.nz, is a place you’ll need
                            to spend some time. Our goal is that you use the information on offer to
                            understand the tourism industry in New Zealand better, so that you can make
                            informed decisions leading to more successful tourism businesses and
                            a stronger economy.

                            A ‘smart’ pdf version of this booklet is
                            available at www.tourismresearch.govt.nz/access
                            The electronic version contains dozens of
                            clickable links that will get you directly to
                            relevant places on the website.

                            If you have any feedback on this
                            publication or the wider research
                            programme we’d love to hear from
                            you info@tourism.govt.nz

                            This document is printed on 100% recycled paper, containing 30% pre-consumer and 70% post consumer waste.
                            Waste fibre is sourced from printers’ waste, converting waste and old milk cartons. No additional bleaching is used
                            in the recycling process.
                            Disclaimer – while care is taken in the preparation of this publication and best practice is employed in gathering the
                            tourism research data, no responsibility can be taken for outcomes from decisions made by external parties, based
                            on the contents of this booklet.

3.ABOUT / 4.QUICK GUIDE / 6.REPORTS / 8.WEBSITE / 12.IVA / 14.IVS / 16.DTS / 18.ITM / 20.CAM / 22.RVM / 24.FORECASTS / 26.TSA / 28.TFM / 30.RESEARCH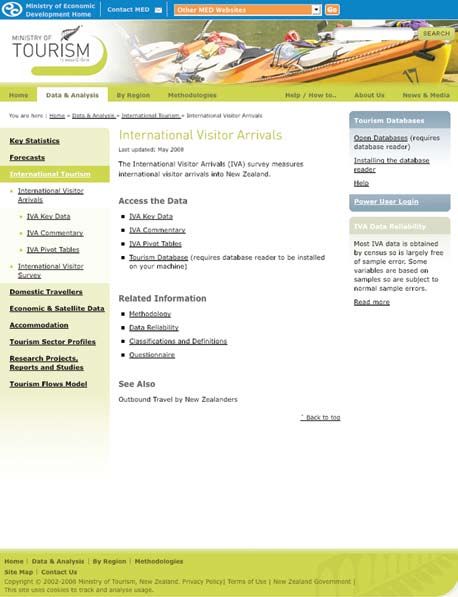
4

    Core Tourism Dataset – a quick guide
    Managing the core tourism dataset is a major focus of             Data is released according to a planned schedule.
    the Ministry of Tourism. Each dataset is designed for             Visit www.tourismresearch.govt.nz/calendar to view the
    a particular purpose to fill an information need.                 release calendar. There is also the opportunity to sign up for
                                                                      RSS feeds when you see the RSS symbol.

    International Visitor                       Release frequency: Quarterly                Recommended use: Monitoring
                                                                                            seasonality at the national, regional
    Arrivals (IVA)                              Data reliability: Good at the national
                                                                                            and district level and benchmarking
                                                level. Recommended for characteristic
    Primary purpose: To track international                                                 tourism performance across regions.
                                                analysis at the regional level but not
    visitor numbers, origin and seasonal                                                    The CAM also monitors trends by
                                                for KPI measurement due to
    spread at the national level.                                                           accommodation type.
                                                sampling error.
    Method: Arrival card data from all those                                                Release frequency: Monthly
    entering and leaving New Zealand            Domestic Travel
                                                Survey (DTS)                                Data reliability: Very good at national,
    ports is recorded. An ongoing survey.
                                                                                            regional and district levels. This survey
    Recommended use: Monitoring trends          Primary purpose: To measure domestic        is recommended for KPI use at the
    and seasonality in markets at the           traveller expenditure. Secondary            regional level.
    national level.                             purposes include measuring traveller
                                                characteristics such as activities          Regional Visitor
    Release frequency: Monthly
                                                undertaken, where travellers go in          Monitor (RVM)
    Data reliability: Excellent.                New Zealand and demographics.
                                                                                            Primary purpose: To monitor
    All international and domestic travellers
                                                Method: Ongoing telephone survey            motivations, expectations and
    are required to complete an arrival or
                                                of 15,000 New Zealanders.                   satisfaction at New Zealand’s key
    departure card.
                                                                                            tourism destinations (Auckland,
                                                Recommended use: Understanding
    International Visitor                                                                   Rotorua, Wellington, Christchurch,
                                                domestic visitor characteristics at the
                                                                                            Queenstown and Dunedin) against
    Survey (IVS)                                national and regional level, where they
                                                                                            an aggregated benchmark.
                                                are from and demographics by
    Primary purpose: To measure
                                                overnight and day travellers.               Method: Onsite self-completion
    international visitor expenditure.
                                                                                            questionnaires (international and
    Secondary purposes include measuring        Release frequency: Quarterly
                                                                                            domestic travellers) with an annual
    traveller characteristics such as
                                                Data reliability: Good at the national      sample of 7,200 nationally and 1,200
    activities undertaken, where they go
                                                level. Recommended for characteristic       per region. Surveying is ongoing.
    once in New Zealand
                                                analysis at the regional level but not      Regional reports are confidential to
    and demographics.
                                                for KPI measurement due to                  participating RTOs but the aggregate
    Method: Ongoing face-to-face survey         sampling error.                             benchmark report is publicly available.
    of 5,000 international visitors as they
    leave New Zealand (departure                Commercial Accommodation                    Recommended use: The benchmark
                                                Monitor (CAM)                               report can be used to gain an
    lounges). Interviews are undertaken
                                                                                            understanding of changing motivations,
    in seven languages.                         Primary purpose: To measure trends          expectations and satisfaction levels of
    Recommended use: Understanding              in commercial accommodation by              international and domestic travellers.
    total and average spend of international    accommodation type. Monthly and
                                                annual data available.                      Release frequency: Quarterly
    visitors at the national level.
    Understanding visitor characteristics of    Method: Postal questionnaire                Data reliability: Good quality stable
    international travellers at the national    to all proprietors of commercial            data. However, the RVM sample is non-
    and regional level, where they are from     accommodation who are                       random so the data reliability cannot be
    and general demographics.                   GST registered.                             statistically measured.

    www.tourismresearch.govt.nz
5

                                                                                                                                                           INTRODUCTION
   Tourism Satellite                                Recommended use: For highlighting                Method: A number of methods are used
                                                    the value and importance of the                  including econometric modelling, time
   Account (TSA)
                                                    tourism industry within the                      series modelling and structural
   Primary purpose: To measure                      New Zealand economy.                             modelling, as well as input from the
   the economic contribution of tourism                                                              tourism industry through an expert
                                                    Release frequency: Annual (mid year)
   to the New Zealand economy.                                                                       delphi group.
                                                    Data reliability: Excellent. Produced
   Method: The TSA utilises relevant                                                                 Recommended use: Planning for
                                                    by Statistics New Zealand and uses
   information from the New Zealand                                                                  future demand.
                                                    international best practice established
   National Accounts and receives input
                                                    by the United Nations World Tourism              Release frequency: Annual (mid-year).
   from a wide range of data sources
                                                    Organisation (UNWTO).
   including: the IVS, the DTS, Industry                                                             Data reliability: Very good at the
   Supply and Use Accounts, Household               Forecasts                                        national level, less stable at the
   Expenditure Survey (HES), Annual                                                                  regional level.
   Enterprise Survey, Quarterly                     Primary purpose: To forecast arrivals
   Employment Survey, House Labour                  and expenditure by market at the
   Force Survey, and more.                          national and regional levels up
                                                    to seven years ahead.

                                                                        IVA
                                                            International Visitor Arrivals

                                                                         IVS
                                                             International Visitor Survey

                                                                        DTS
                                                               Domestic Travel Survey
                              TSA
                    Tourism Satellite Account                                                                Forecasting
                                                                      CAM
                                                                   Commercial
                                                              Accommodation Monitor

                                                                       RVM
                                                              Regional Visitor Monitor

                              PAST                                  PRESENT                                   FUTURE

3.ABOUT / 4.QUICK GUIDE / 6.REPORTS / 8.WEBSITE / 12.IVA / 14.IVS / 16.DTS / 18.ITM / 20.CAM / 22.RVM / 24.FORECASTS / 26.TSA / 28.TFM / 30.RESEARCH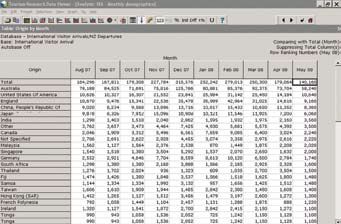
6

      Reports, Publications and Tools

      The Ministry of Tourism provides a range of publications   RSS feeds are an easy way of staying up to date with what’s
      and tools to help keep you informed. These are all         on the website. If an RSS feed is available an icon like this
      accessible online.                                         will be shown.      Visit www tourismresearch.govt.nz/rss to
                                                                 find out more.

    01.                                      02.                                01. Weekly Arrivals
                                                                                     Keep up with the latest arrivals data
                                                                                     (provisional) from New Zealand’s top
                                                                                     ten markets. Sign up for your weekly
                                                                                     email at
                                                                                     www.tourismresearch.govt.nz/subscribe.

                                                                                02. Tourism Leading
                                                                                    Indicators Monitor
                                                                                     This monthly monitor provides insightful
                                                                                     interpretation of the latest tourism data
                                                                                     as well as holding the most recent figures
                                                                                     from all of the Ministry’s core datasets.
                                                                                     Sign up for your monthly email at
                                                                                     www.tourismresearch.govt.nz/subscribe.

                                                                                03. Key Tourism Statistics
                                                                                     A handy one-page reference covering
                                                                                     top level tourism statistics including,
    03.                                      04.                                     latest arrival numbers by key markets,
                                                                                     total and average expenditure for
                                                                                     international and domestic visitors.
                                                                                     Always up to date with the most recent
                                                                                     data. Subscribe to RSS feeds here
                                                                                     www.tourismresearch.govt.nz/kts.

                                                                                04. Tourism Sector Profiles
                                                                                     Concise four-page publications giving
                                                                                     an informative overview on their topic
                                                                                     areas. Currently available topics include
                                                                                     commercial accommodation, museum,
                                                                                     nature-based, wine and Maori tourism.
                                                                                     These profiles are periodically released.
                                                                                     Visit
                                                                                     www.tourismresearch.govt.nz/profiles
                                                                                     to download copies.

          www.tourismresearch.govt.nz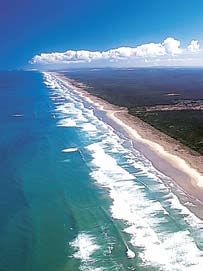
7

                                                                                                                                                           INTRODUCTION
05.                                              06.                                           05. ACCESSING NEW ZEALAND’S
                                                                                                   OFFICIAL TOURISM DATA
                                                                                                     Learn about what’s available and how
                                                                                                     to get at it
                                                                                                     www.tourismresearch.govt.nz/access
                                                                                                     or subscribe to receive a hard copy
                                                                                                     by post
                                                                                                     www.tourismresearch.govt.nz/subscribe.

                                                                                               06. Forecasts Summary Booklet
                                                                                                     An informative resource covering arrival
                                                                                                     forecasts for up to seven years ahead.
                                                                                                     Produced annually.
                                                                                                     Electronic copies available at
                                                                                                     www.tourismresearch.govt.nz/
                                                                                                     forecastsbook or subscribe to receive a
                                                                                                     hard copy by post
                                                                                                     www.tourismresearch.govt.nz/subscribe.
                                                                                                     Regional specific reports are available at
07.                                              08.                                                 www.tourismresearch.govt.nz/regfor.
                                                                                                     Forecast Excel pivot tables are also
                                                                                                     available at
                                                                                                     www.tourismresearch.govt.nz/forpivot.

                                                                                               07. Regional Visitor Monitor
                                                                                                     A quarterly benchmark report which
                                                                                                     monitors expectations and satisfaction
                                                                                                     levels by international and domestic
                                                                                                     visitors to New Zealand’s main tourist
                                                                                                     destinations. Subscribe to RSS
                                                                                                     feeds here
                                                                                                     www.tourismresearch.govt.nz/rvm.

                                                                                               08. Tourism Flows Model
                                                                                                     The Tourism Flows Model (TFM)
                                                                                                     is an unique mapping tool that allows
                                                                                                     users to study the movements of
                                                                                                     international and domestic travellers
                                                                                                     in New Zealand. Users can identify trends
                                                                                                     and capacity requirements by accessing
                                                                                                     the forecasting data
                                                                                                     www.tourismresearch.govt.nz/tfm.

3.ABOUT / 4.QUICK GUIDE / 6.REPORTS / 8.WEBSITE / 12.IVA / 14.IVS / 16.DTS / 18.ITM / 20.CAM / 22.RVM / 24.FORECASTS / 26.TSA / 28.TFM / 30.RESEARCH
8

                                              03.

                                              04.

    01.

                                        02.

                                              05.

                                              06.

                                              07.

                                        09.

                                              08.

    10.

          www.tourismresearch.govt.nz
9

   WHAT’S ON THE WEB?                                                 		              www.tourismresearch.govt.nz

                                                                                                                                                           INTRODUCTION
   Most of what you are looking for is available within only one or two mouse-clicks
   from the home page.

     01.     Data & Analysis                          05.     Tourism Databases                        08.      Upcoming releases

            The bulk of information on                       The tourism databases are                        Data is released at different
            the website can be accessed                      a powerful way to access                         times and frequencies.
            from this box including the                      tourism data for users with                      Look ahead to see what will
            latest information on arrival                    an intermediate knowledge                        be available on the website
            numbers, trends in commercial                    of data use. A database                          and when.
            accommodation, forecast data,                    reader must first
            economic analysis                                be installed.
            and publications. Top line
            information is provided as
                                                                                                       09.      Tourism Flows Model

            well as access to powerful
            Excel tables.                             06.      Power user login                               The Tourism Flows Model
                                                                                                              (TFM) is an unique tool that
                                                                                                              allows users to study the
                                                             Power User is the most
                                                                                                              movements of international
             Publications and                                advanced method of
     02.     Key sTatistics
                                                                                                              and domestic travellers in
                                                             accessing the tourism data.
                                                                                                              New Zealand. Users can
                                                             Application for Power User
            Electronic versions of the                                                                        identify trends and capacity
                                                             access may be made by those
            Ministry’s most popular                                                                           requirements by accessing
                                                             with a sound level of statistical
            publications are available here.                                                                  the forecasting data.
                                                             knowledge by emailing
                                                             info@tourism.govt.nz

     03.     Search box                                                                                10.      Methodologies

                                                      07.      What’s New
                                                                                                              Learn more about the
            Use keywords to search on
            a topic of your choice.                                                                           background to the Ministry’s
                                                             For the latest news releases                     surveys. Detailed
                                                             or additions to the website.                     methodologies and copies
                                                                                                              of the surveys can be
     04.     Subscribe                                                                                        found here.

            Subscribe to a range of
            publications and stay up to
            date on official tourism
            research in New Zealand.

3.ABOUT / 4.QUICK GUIDE / 6.REPORTS / 8.WEBSITE / 12.IVA / 14.IVS / 16.DTS / 18.ITM / 20.CAM / 22.RVM / 24.FORECASTS / 26.TSA / 28.TFM / 30.RESEARCH
10

     How to use the website
     The website hosts a wealth of tourism data. It has been                The International Visitor Arrivals page (below) helps you
     structured to help you find the information you need as                to see how this structure works.
     quickly as possible.
     Data from our major surveys is accessible in a tiered
     way, enabling you to quickly find top level facts at a glance,
     right through to conducting your own in-depth analysis.

                                                                                              03.

                                                                                              04.
                                                01.
                                                                      02.
                                                03.

     www.tourismresearch.govt.nz
11
INTRODUCTION
01. FACTS AT A GLANCE 02. INTERMEDIATE ANALYSIS
Key Data Pivot Tables
Commentary Excel pivot tables provide quick and powerful
access to data for the intermediate user, directly
When you need to know top line information,
from the website.
look out for the Key Data and Commentary sections.
03. INTERMEDIATE to ADVANCED ANALYSIS 04. ADVANCED ANALYSIS
Tourism Database Power User
The Tourism Databases provide further options for Power User access is the Ministry’s most advanced
accessing the data for the intermediate to advanced system for accessing data – training is required.
user (a database reader must be installed first). Access is by application, info@tourism.govt.nz
Tutorials are provided at www.tourism.govt.nz/tutorials.
3.ABOUT / 4.QUICK GUIDE / 6.REPORTS / 8.WEBSITE / 12.IVA / 14.IVS / 16.DTS / 18.ITM / 20.CAM / 22.RVM / 24.FORECASTS / 26.TSA / 28.TFM / 30.RESEARCH12
International Tourism
International Visitor Arrivals (IVA)
What is the IVA?
The IVA is an ongoing survey that measures international visitor arrivals into
New Zealand. Arrival card data from all those entering New Zealand ports is
collected by Customs New Zealand and processed by Statistics New Zealand.
This data is fundamental to understanding the characteristics and trends
of international visitors to New Zealand.
Note: The IVA sits within the larger International Travel and Migration survey
(both arrivals and departures).
What does the IVA tell us?
The IVA records the number of short-term visitors (under 12 months)
Key Figures: 2007 IVA to New Zealand and provides a range of information about their
characteristics, including:
Total visitor arrivals Country of origin
reached 2.47 million Purpose of visit
in 2007 Intended length of stay
Seasonal patterns
Australia – largest
Visitor demographics
market with 39% share,
All data is provided at the national level and released monthly.
followed by UK (12%),
USA (9%), Japan (5%),
Getting @ the IVA data RSS available
China (5%), South Korea
Visit www.tourismresearch.govt.nz/iva
(4%) and Germany (2%)
IVA Key Data
IVA Commentary
49% of visitors came TO NZ
for a holiday, followed IVA Pivot Tables
by THOSE visiting friends Tourism Databases
and relatives (29%),
business (13%) and
other (11%)
34% of international
visitors arrived in
the peak December
to February period
Look out for live links in the electronic version of this publication,
Average length of stay www.tourismresearch.govt.nz/access
was 20 days
www.tourismresearch.govt.nz/iva13
Figure 1: International Visitor Arrivals 1960 – 2007 Data reliability
Excellent. All visitors to
Visitor Arrivals (000s) Annual growth rate Visitors Growth Rate New Zealand are required
3,000 100%
Jet services began Kiwi dollar Low trans –
by law to complete an arrival
2,800 in 1963 making air
travel faster
floated 1985 Tasman airfares
began 2003/04 80%
card so the IVA is subject to only
2,600 and easier
minimal sampling errors.
2,400 1970, 90% of Air NZ began 747 Strong growth
60%
arrivals by air services 1981 in Asian markets
2,200 1992 – 96
40%
2,000
Lions rugby
1,800 tour 2005 20% Related information
1,600
0% www.tourismresearch.govt.nz/iva
1,400
Yom Kippur War Share market Sep-11 terrorist
1973, oil crash 1987 attack in US 2001
Methodology
DATASETS
1,200 price soared -20%
1,000
-40% Questionnaire
Iran – Iraq War 1980, Asian financial SARS
800 oil price soared crisis 1997/98 2003
Classifications & Definitions
600 -60%
400 Gulf War 1990/91 High $NZ soaring
Tourism Leading Indicators Monitor
oil price & credit -80%
200 crunch 2007/08
IVA database tutorial
0 -100%
Key Tourism Statistics
2000
1960
1965
1970
1975
1980
1985
1990
1995
2005
Year Ended December
Example of IVA use
International visitor arrivals have increased strongly since the mid-1980s.
The only negative growth occurred following the first Gulf War (1990/91) A tour operator is thinking of
and the 1997/98 Asian financial crisis. The greatest single boost in recent targeting Indian travellers because
years followed the lowering of trans-Tasman airfares seeing an influx of he thinks their large travel party
Australian travellers in 2004. sizes will be a good match for his
business. By using the IVA tourism
databases on the website he found
Figure 2: Top Ten International Visitor Markets
that India was a growing market.
23,000 Indians arrived in the last
2005 2006 2007 year, three times more than in
Australia 2000, and the most popular time for
UK
visiting was May (an off-peak time
USA
for NZ tourism).
Japan
China
South Korea
Germany
Canada
Singapore
Netherlands
0 100 200 300 400 500 600 700 800 900 1,000
Visitor Numbers (000s)
New Zealand’s top ten markets generated 80% of total visitor arrivals in 2007.
In early 2008, China overtook Japan to become the fourth biggest market and
its growth continues to be strong. Australia is New Zealand’s largest source of
visitors, with steady growth over a number of years.
3.ABOUT / 4.QUICK GUIDE / 6.REPORTS / 8.WEBSITE / 12.IVA / 14.IVS / 16.DTS / 18.ITM / 20.CAM / 22.RVM / 24.FORECASTS / 26.TSA / 28.TFM / 30.RESEARCH14
International Tourism
International Visitor Survey (IVS)
What is the IVs?
The International Visitor Survey is primarily designed to measure expenditure
by international visitors.
Each year 5,000 departing international visitors are surveyed at Auckland,
Wellington and Christchurch international airports in seven different languages.
What does the IVS tell us?
Key measures include:
Expenditure
Activities undertaken
Transport and accommodation used
Key Figures: 2007 IVS
Visitor demographics including origin and length of stay
International National and regional level data is available but caution must be exercised
expenditure reached at the regional level. Data is released quarterly.
$6.2 billion, up 4%
from 2006 Getting @ the IVS data RSS available
Visit www.tourismresearch.govt.nz/ivs
International visitors IVS Key Data
spend an average of IVS Commentary
$2,758 in New Zealand IVS Pivot Table
Tourism Databases
60% of all expenditure
came from the top four
markets of Australia, UK,
USA and Japan
50% of visitors were
repeat visitors to
New Zealand
47% of visitors stayed
in a hotel at some
stage of their
New Zealand visit
Look out for live links in the electronic version of this publication,
www.tourismresearch.govt.nz/access
www.tourismresearch.govt.nz/ivs15
Figure 3: Total International Visitor Expenditure Data reliability
Good at the national level.
$NZ Billion
Recommended for characteristic
10
9 analysis at the regional level but
8 not for KPI measurement due to
7
sampling error.
6
5
4
3
2
1 Related information
0
1980
1981
1982
1983
1984
1985
1986
1987
1988
1989
1990
1991
1992
1993
1994
1995
1996
1997
1998
1999
2000
2001
2002
2003
2004
2005
2006
2007
www.tourismresearch.govt.nz/ivs
DATASETS
Year Ended December Methodology
In 2007, international visitor expenditure reached $6.2 billion, up 4% on 2006. Questionnaire
A highlight was spending by Australian visitors having increased by 12% in 2007
Classifications & Definitions
while UK visitors’ spending increased 10%.
Tourism Leading Indicators Monitor
Note: From 2004 the IVS includes improvements to the treatment of capital
expenditure and weighting methodology, with these improvements IVS database tutorial
consistently applied to all future data. The series before and after 2003
Key Tourism Statistics
is not directly comparable.
Table 1: Top Ten Markets by Expenditure – 2007 Example of IVs use
A new operator specialising in
Total Spend ($NZ million) Spend per Trip Spend per Night exclusive personal guided tours
Australia $1,619 $1,886 $156.80 for 2-4 people wanted to identify
United Kingdom $993 $3,705 $106.43 her target markets. After checking
United States $668 $3,465 $184.86
the IVS pivot tables she found
Japan $419 $3,679 $191.61
China $273 $2,478 $191.54
that among those on holiday,
Korea $261 $3,047 $134.75 average group sizes with a good
Germany $246 $4,468 $104.45
match for her business included:
TOTAL $6,188 $2,758 $126.32
Australians (3 people), Canadians
(2 people), UK (3 people) and
In 2007, Australians spent a total of $1.6 billion in New Zealand – the largest
Germans (4 people).
spend for any one market. Germans spent the most per trip at $4,468.
This is because they typically stay longer in New Zealand (43 nights).
Australians, however, have a shorter length of stay, averaging 12 nights.
While their spend per night is high at $157 they spend less on a per trip
basis ($1,886).
3.ABOUT / 4.QUICK GUIDE / 6.REPORTS / 8.WEBSITE / 12.IVA / 14.IVS / 16.DTS / 18.ITM / 20.CAM / 22.RVM / 24.FORECASTS / 26.TSA / 28.TFM / 30.RESEARCH16
Domestic Travellers –
In New Zealand
Domestic Travel Survey (DTS)
What is the DTS?
The DTS is specifically designed to measure spending by New Zealand
travellers, within New Zealand, as well as this primary goal, other variables
are measured, as outlined below.
Each year 15,000 New Zealanders are surveyed by telephone nationwide,
and asked about recent travel within New Zealand.
What does the DTS tell us?
Key measures include:
Key Figures: 2007 DTS Number of day trips and overnight trips
Nights spent in individual regions
Total travel expenditure
Purpose of travel
was $7.6 billion in 2007,
Activities undertaken
comprising $5.0 billion
Traveller demographics
for overnight travel
National and regional level data is available but caution must be exercised
and $2.6 billion for at the regional level. Data is released quarterly.
day travel
Getting @ the DTS data RSS available
Overnight travellers Visit www.tourismresearch.govt.nz/dts
made 14.9 million trips DTS Key Data
which generated 44.4 DTS Commentary
million nights, an
DTS Pivot Tables
average of 3.0 nights
Tourism Databases
per trip
Domestic visitors made
27.3 million day trips.
Around 61% of these
day trips were made
by people from the
Auckland, Waikato,
wellington and
Canterbury regions
Look out for live links in the electronic version of this publication,
www.tourismresearch.govt.nz/access
www.tourismresearch.govt.nz/dts17
Figure 4: Total Expenditure on Domestic Tourism Data reliability
Good at the national level.
$NZ Billion Total Day Trip Overnight Trip
10
Recommended for characteristic
9 analysis at the regional level but
8 not for KPI measurement due
$NZ Billion Total Day Trip Overnight Trip
10 7 to sampling error.
9 6
8 5
7 4
6 3
Related information
5 2
4 1
www.tourismresearch.govt.nz/dts
3 0
1999
2000
2001
2002
2003
2004
2005
2006
2007
DATASETS
2 Methodology
1 Year Ended December Questionnaire
0
1999
2000
2001
2002
2003
2004
2005
2006
2007
Classifications & Definitions
In 2007, New Zealanders spent $7.6 billion travelling within New Zealand.
27.3 million day trips and 14.9Year
million
Endedovernight
December trips were taken – a total of Tourism Leading Indicators Monitor
42.3 million trips.
DTS database tutorial
Key tourism statistics
Figure 5: Nights by Purpose of Trip –Education
2007 Other Example of DTs use
1% 2%
Business
15% A Blenheim vineyard had $1,500
Education
to put towards a newspaper
Other
1% 2% advertisement to attract people to
Business
15% their open day. They thought they’d
place the ad in the Wellington’s
Dominion Post, but after researching
the DTS results they saw that 38%
Visiting Friends Holiday of travellers came from Canterbury
& Relatives 47%
35% compared to only 15% coming from
Wellington. Placing an ad in the
Visiting Friends Holiday Christchurch Press now looked like
& Relatives 47%
35% a better option.
Most domestic trip nights are for holiday purposes, while a large proportion are
visiting friends and relatives.
3.ABOUT / 4.QUICK GUIDE / 6.REPORTS / 8.WEBSITE / 12.IVA / 14.IVS / 16.DTS / 18.ITM / 20.CAM / 22.RVM / 24.FORECASTS / 26.TSA / 28.TFM / 30.RESEARCH18
Domestic Travellers –
Outbound Travel
International Travel & Migration survey (ITM)
What is the International Travel
& Migration survey?
Outbound travel statistics come from the ITM. Collection and processing
Key Figures: 2007 ITM
of departure cards provides information on these travellers.
New Zealand residents Thousands of New Zealanders travel off shore each year, for holiday,
business, visiting friends and relatives and many other reasons.
went on 1.98 million
Note: The ITM monitors both arrivals and departures into and out of
short–term overseas New Zealand. Previously known as the External Migration Survey.
trips in 2007
What does the International Travel
Australia is the most
& Migration survey tell us?
popular short–term
Key measures include:
overseas destination,
Total number of New Zealand travellers taking short-term departures
with 49% of all New (under 12 months)
Zealand trips abroad Main destination country
This is followed by Fiji, Purpose of travel
the uk and us (5% each) Traveller demographics
Seasonal patterns
42% of overseas trips
Data is released monthly.
were for holiday,
followed by visiting
Getting @ the ITM data RSS available
friends and relatives
Visit www.tourismresearch.govt.nz/outbound
(31%), business (18%)
Outbound Travel Key Data
and other (8%)
Outbound Travel Commentary
Most New Zealanders’ Pivot Table Outbound Travel
trips abroad are for Tourism Database
holidays (42%) followed
by those visiting friends
and relatives (31%),
business (15%) or for
other reasons (12%)
Average length of Look out for live links in the electronic version of this publication,
absence was 20 days www.tourismresearch.govt.nz/access
www.tourismresearch.govt.nz/outbound19
Figure 6: Total Short-Term Trips Abroad by NZ Residents Data reliability
Excellent. All New Zealanders
Short-term Departures (000s)
2,500
travelling abroad are required by
law to complete a departure card.
2,000 Outbound data is subject to minimal
1,500
sampling errors.
Short-term Departures (000s)
2,500
1,000
2,000
500
1,5000 Related information
1983
1984
1985
1986
1987
1988
1989
1990
1991
1992
1993
1994
1995
1996
1997
1998
1999
2000
2001
2002
2003
2004
2005
2006
2007
1,000 www.tourismresearch.govt.nz/
Year Ended December outbound
DATASETS
500
Methodology
Travel
0 abroad by New Zealanders has been steadily increasing over the past
1983
1984
1985
1986
1987
1988
1989
1990
1991
1992
1993
1994
1995
1996
1997
1998
1999
2000
2001
2002
2003
2004
2005
2006
2007
two decades.Growth was particularly rapid during 2003-2007 owing to lower Questionnaire
cost trans-Tasman airfares and a strong New Zealand dollar.
Year Ended December Classifications & Definitions
Tourism Leading Indicators Monitor
Key Tourism Statistics
Australia USA UK Fiji China
1,000,000
Figure
900,000 7: NZ Resident Departures by Main Destinations Example of outbound data use
800,000
A travel agency wanted to learn
700,000
Australia USA
Australia UK Fiji China about travel patterns by
600,000
1,000,000
New Zealanders to the Pacific
500,000
900,000 Islands in recent years. They
400,000
800,000 spent a few minutes looking over
300,000
700,000
Australia
the outbound pivot tables and
200,000
600,000 learnt that trips to Fiji had declined
Fiji
100,000
500,000 USA
over the last two years. On the
UK China
400,0000 other hand, travel to Samoa and
1983
1984
1985
1986
1987
1988
1989
1990
1991
1992
1993
1994
1995
1996
1997
1998
1999
2000
2001
2002
2003
2004
2005
2006
2007
300,000 the Cook Islands had increased
200,000 Year Ended December dramatically, having doubled in the
Fiji
100,000 USA last four years.
0 UK China
1983
1984
1985
1986
1987
1988
1989
1990
1991
1992
1993
1994
1995
1996
1997
1998
1999
2000
2001
2002
2003
2004
2005
2006
2007
Year Ended December
Australia has always been the most popular destination for most New Zealanders’
short-term overseas trips. The strong growth from 2004 was stimulated
by low airfares on the trans-Tasman and Pacific routes.
3.ABOUT / 4.QUICK GUIDE / 6.REPORTS / 8.WEBSITE / 12.IVA / 14.IVS / 16.DTS / 18.ITM / 20.CAM / 22.RVM / 24.FORECASTS / 26.TSA / 28.TFM / 30.RESEARCH20
Accommodation
Commercial Accommodation Monitor (CAM)
What is the cam?
The CAM is a survey that monitors supply and demand in the commercial
accommodation sector. Questionnaires are completed by the majority
of proprietors of commercial accommodation, excluding small operators
or those not GST registered.
Key Figures: 2007 CAM
What does the cam tell us?
Total guest nights rose
The CAM produces monthly statistics on the following key measures:
by 4% to 32.9 million
Guest nights
nights in 2007
Capacity
33% of guest nights Occupancy rates
were in motels, Employee numbers
followed by hotels Origin of guest
(31%), caravan parks/ Accommodation types
camping grounds (20%), Seasonal and regional patterns
backpackers (14%) and The CAM provides high quality national, regional and district level data for both
hosted (2%) domestic and international travellers. It is the most robust survey for monitoring
tourism activity at the regional and district levels. Data is released monthly.
Backpacker guest
Getting @ the CAM data RSS available
nights had the fastest
Visit www.tourismresearch.govt.nz/cam
growth, increasing by
CAM Key Data
109% in the ten years
CAM Commentary
since 1997, an extra 2.3
CAM Pivot Table
million guest nights.
Tourism Databases
This growth has slowed
more recently
The national average
accommodation
occupancy rate was
38.0%, for hotels 55%,
motels 54%, backpackers
45%, hosted 26% and
caravan parks/camping
grounds 16% Look out for live links in the electronic version of this publication,
www.tourismresearch.govt.nz/access
www.tourismresearch.govt.nz/cam3,000
2,500
2,000 21
1,500
1,000
500
0
Jul Aug Sep Oct Nov Dec Jan Feb Mar Apr May Jun
Figure 8: Total Guest Nights by Year Data reliability
Excellent. The CAM provides
Guest Nights (000s)
a census of commercial
35,000
accommodation providers
30,000 (excluding hosted and those not
25,000
GST registered). It is the only
survey recommended for KPI
20,000
measurement at the regional level.
15,000
10,000
Related information
5,000 www.tourismresearch.govt.nz/cam
DATASETS
0 Methodology
1997 1998 1999 2000 2001 2002 2003 2004 2005 2006 2007
Year Ended December
Questionnaire
Classifications & Definitions
The number of guest nights recorded has increased steadily over each of the
Tourism Leading Indicators Monitor
last ten years, growing from 22 million in 1997 to reach 33 million in 2007,
an average annual growth rate of 5% per year. Key Tourism Statistics
Figure 9: Guest Nights by Month Example of outbound data use
A Wellington motelier’s occupancy
Guest Nights (000s) 2005/06 2006/07 2007/08 rates were lower than usual over
5,000
Summer Peak the last year and they wondered
4,500
why. By looking at the CAM pivot
4,000 Easter (March or April)
tables they were able to see that
3,500
3,000
over that time a lot more motels
2,500
were built but that there were only
2,000
the same amount of guest nights.
1,500 The motelier realised the increased
1,000 capacity for the same number
500 of guests had reduced
0 their occupancy.
Jul Aug Sep Oct Nov Dec Jan Feb Mar Apr May Jun
The Commercial Accommodation Monitor clearly shows the seasonality
of tourism in New Zealand, with January being the peak month and June
being the quietest month.
Figure 9 also shows the ‘mini-peaks’ that occur in Easter, in either March
or April.
Guest Nights (000s)
35,000
30,000
25,000
20,000
15,000
3.ABOUT / 4.QUICK GUIDE / 6.REPORTS / 8.WEBSITE / 12.IVA / 14.IVS / 16.DTS / 18.ITM / 20.CAM / 22.RVM / 24.FORECASTS / 26.TSA / 28.TFM / 30.RESEARCH
10,00022
Regional Visitor Monitor
Regional Visitor Monitor (RVM)
What is the RVM?
The RVM is a survey which monitors motivations, expectations and satisfaction
levels of domestic and international visitors to New Zealand’s main tourist
destinations. It is a partnership survey between the Ministry of Tourism and six
regions: Auckland, Rotorua, Wellington, Christchurch, Queenstown and Dunedin.
Key Figures: 2007 RVM
Questionnaires are self completed on location in the regions (1,200 per region
per annum). Reports are produced which are confidential to regions. These can
70% of international be used to compare with aggregated benchmark data. The benchmark report
and domestic is made publically available.
travellers were highly
satisfied with their
What does the RVM tell us?
The RVM produces annual statistics (rolling quarters) on the following
visit to the six regions
key measures:
Motivations
67% of international
travellers and 71% Expectations
of domestic travellers Satisfaction
were highly satisfied Method of research and booking
with the main form Attitudes to environmental issues (new)
of transport they used The national report is available for download from the research website
on a quarterly basis.
to get to the regionS
Getting @ the benchmark data RSS available
61% of international
Visit www.tourismresearch.govt.nz/rvm
travellers and 67% of
Satisfaction tables
domestic travellers
Quarterly reports
were highly satisfied
with their main form
of accommodation in
the six regions
Look out for live links in the electronic version of this publication,
www.tourismresearch.govt.nz/access
www.tourismresearch.govt.nz/rvmAdvice from fam
Advice from a
Other inter
Guide or
www.new
Magazines or
i-SITE/other visit
23
Figure 10: Important Factors in Deciding to Visit Regions Data reliability
The RVM sample is non-random
Domestic International
60%
so the data reliability cannot
be statistically measured.
50%
40%
30%
20%
10%
Related information
0% www.tourismresearch.govt.nz/rvm
See natural or other attraction
Explore uniquely diff places
Experience local culture
Escape from the pressures
Take time out
Have fun, socialise & enjoy
Experience must see destinations
Recharge & feel refreshed
Participate in an activity
Take advantage of a good deal
Attend an event
Indulge in comfort
Learn about other cultures
Reflect on myself
Challenge & test myself
Regional data
DATASETS
Regional forecasts
Commercial Accommodation
Monitor
Figure 10 shows the difference between international and domestic travellers’ Example of RVM use
decisions to visit a region. For the six regions, most international travellers are
A campervan operator wanted to
motivated by natural or other attractions, while domestic travellers are motivated
know how satisfied international
by taking time out.
visitors were with campervans in
New Zealand. He downloaded a
Figure 11: Sources of Information about Regions copy of the RVM benchmark report,
and found that satisfaction levels
were pretty high with an average
Domestic International
80% score of 7.9 out of 10. However,
70% he did note that satisfaction
60% appeared to be trending downwards
50% over time. Perhaps he could talk
40% to his customers and find out what
30% he could do to further improve
20% satisfaction levels.
10%
0%
Guide or travel books
Advice from family or friends
Other internet/websites
www.newzealand.com
Advice from a travel agent
i-SITE/other visitor info centre
RTO website
Magazines or newspapers
Other
International travellers predominantly use travel guides or books as a source
of information about a region. Domestic travellers use websites other than
newzealand.com. Advice from friends and family are important information
sources for both traveller types.
3.ABOUT / 4.QUICK GUIDE / 6.REPORTS / 8.WEBSITE / 12.IVA / 14.IVS / 16.DTS / 18.ITM / 20.CAM / 22.RVM / 24.FORECASTS / 26.TSA / 28.TFM / 30.RESEARCH24
Forecasts 2008–2014
What are the Forecasts?
The Ministry’s forecasting programme, now in its ninth year, generates
a seven-year outlook of expected tourism demand for the New Zealand
tourism industry.
A number of methods are used including econometric modelling, time series
modelling and structural modelling, as well as input from tourism industry
professionals through the expert delphi group.
What do the forecasts tell us?
The forecasts cover a range of measures including:
International arrivals, nights and expenditure
Key Figures: 2008-2014 Forecasts Breakdowns by markets and purpose of visit
Domestic overnight and day trips
By 2014, it is expected that
Outbound travel by New Zealand residents
there will be 3.1 million
The forecasts are updated mid-year.
international visitors
Getting @ the forecast data
An additional 628,000
Visit www.tourismresearch.govt.nz/forecasts
international visitors
Forecasts Key Data
are expected by 2014,
Forecasts Commentary
an increase of 26%
Forecasts Pivot Tables
Tourism Forecasts Summary Booklet
International arrival
numbers to New Zealand
are expected to increase
at an average of 3.3% per
annum to 2014
www.tourismresearch.govt.nz/forecasts25
Figure 12: Forecast International Visitor Arrivals Data reliability
Good at the national level,
Visitor Arrivals (000s) Actual Forecast less stability at the regional level.
3,500
3,000
2,500
2,000
1,500
1,000 Related information
500
www.tourismresearch.govt.nz/
0 forecasts
DATASETS
2008f
2009f
2010f
2011f
2012f
2013f
2014f
1986
1987
1988
1989
1990
1991
1992
1993
1994
1995
1996
1997
1998
1999
2000
2001
2002
2003
2004
2005
2006
2007
Forecasts summary publication
Year Ended December
Regional Forecast Reports
International arrivals are forecast to increase to 3.1 million by 2014.
A softer short-term outlook
Over recent years, New Zealand benefited from a ‘perfect-storm’ of positive Example of use
influences, e.g. extensive exposure from the Lord of the Rings trilogy,
the America’s Cup and the Lions’ tour, as well as New Zealand generally A large tourism operation was
being an ‘in-vogue’ destination. This resulted in consistently strong growth. considering expanding but
wondered which markets they were
The pendulum has now swung, with the key influences on the tourism sector likely to do best in. After consulting
considerably more challenging.
the forecasting section on the
website they learnt that in the
These include:
near future, some of the strongest
The economies of a number of key markets are under pressure (e.g. tight growth was expected to be out
credit, higher mortgage costs and rising inflation) which is reducing the of Australia. They decided this is
underlying demand to travel to New Zealand. where they would place their effort
Rising oil prices are increasing the cost of air travel. On long-haul flights, in the coming months.
the impacts on the total airfare are significant and are likely to be
sufficient to affect demand for travel.
The global trend from long-haul to short-haul travel works against New
Zealand as a mainly long-haul destination. The driver for this is the rapid
growth of low cost aviation models operating within regions. For instance,
while Asian travel overall is growing rapidly, most of this is within the Asia
region, and not to long-haul destinations such Europe, the US, Australia
and New Zealand.
On the other hand, history has demonstrated that tourism is a tremendously
resilient industry that recovers quickly from the challenges that periodically
arise. Also, the New Zealand tourism offer remains compelling, so there
is a clear reason for travellers to want to travel here.
In grappling with the issues, the forecasts expect low level growth over the
next couple of years, with a pick-up after that. Over the seven-year term of the
forecasts, it is expected that the average annual growth rate will be 3.3%.
3.ABOUT / 4.QUICK GUIDE / 6.REPORTS / 8.WEBSITE / 12.IVA / 14.IVS / 16.DTS / 18.ITM / 20.CAM / 22.RVM / 24.FORECASTS / 26.TSA / 28.TFM / 30.RESEARCH26
Economic and Satellite data
Tourism Satellite Account (TSA)
What is the TSA?
The TSA provides an official measure of the contribution of the tourism industry
to New Zealand’s economy.
Tourism is an industry made up of a large number of traditional industry groups.
The United Nations World Tourism Organisation (UNWTO) methodology used
in the production of the TSA enables the tourism proportion of activity in these
sectors to be accounted for and used to measure the tourism industry
as a whole.
What does the TSA tell us?
Key measures include:
Key Figures: 2007 TSA Expenditure (direct and indirect)
Contribution to GDP
tourism is a $20.1
Employment in tourism
billion industry
GST revenue
International tourism Export earnings
$8.8 billion, domestic Expenditure on tourism products
tourism $11.3 billion The TSA provides a high-level perspective of the size of the tourism industry
and its relevance to the economy. The publication is produced annually
in the middle of the year, covering the year to March one year earlier.
18.3% of exports
(New Zealand’s largest
Getting @ the TSA data
export earner)
Visit www.tourismresearch.govt.nz/tsa
181,000 direct and TSA Key Data
indirect full-time TSA Commentary
equivalent jobs – 9.4% TSA Pivot Tables
of workforce TSA Full report
GST revenue $1.5 billion
Direct tourism value $7.9
billion, indirect tourism
value $6.2 billion.
Look out for live links in the electronic version of this publication,
www.tourismresearch.govt.nz/access
www.tourismresearch.govt.nz/tsa27
Figure 13: Total Tourism Expenditure Data reliability
Excellent. Produced by Statistics
$NZ Billion International Domestic Total
New Zealand and uses international
25
best practice sanctioned by
20 the UNWTO.
15
10
Related information
5
$NZ Billion
0
International Domestic Total www.tourismresearch.govt.nz/tsa
25
1999 2000 2001 2002 2003 2004 2005 2006 2007
DATASETS
Methodologies
Year Ended March
20
Total tourism expenditure reached $20.1 billion in the year to March 2007,
15
directly and indirectly contributing 9.2% of GDP.
Of
10 total expenditure, 44% was by domestic visitors and 56% by
international visitors.
5
Tourism expenditure has increased by an average of 6.2% per year since 1999,
with international increasing at 7.5% compared with domestic at 5.4% per year. Example of TSA use
0
1999 2000 2001 2002 2003 2004 2005 2006 2007
Note: The TSA figures differ from the IVS and DTS expenditure totals because the A tourism training organisation
TSA methodology draws on a numberYear Ended March
of additional data sources, e.g. international wanted to gain an understanding
aviation receipts,
Export Earnings higher quality data on short term education visitors and a more
18.3% of how many people were directly
complete picture of business and government travel. In terms of total industry size,
and indirectly employed in the
the TSA is the best source to use.
GST 11.3% tourism industry in New Zealand.
After spending five minutes looking
Total FTE Employment 9.7% at the TSA publication, they learnt
that the figure was one in ten
Figure 14:GDP
Tourism Contributions to the New
9.2%
Zealand Economy – 2007 people, and that this ratio had
remained largely unchanged over
0% 2% 4% 6% 8% 10% 12% 14% 16% 18% 20% the last seven years.
Export Earnings 18.3%
GST 11.3%
Total FTE Employment 9.7%
GDP 9.2%
0% 2% 4% 6% 8% 10% 12% 14% 16% 18% 20%
The percentages in Figure 14 highlight the importance of tourism’s contribution
to the economy and the industry’s position as the largest export earner.
3.ABOUT / 4.QUICK GUIDE / 6.REPORTS / 8.WEBSITE / 12.IVA / 14.IVS / 16.DTS / 18.ITM / 20.CAM / 22.RVM / 24.FORECASTS / 26.TSA / 28.TFM / 30.RESEARCH28
Tourism Flows Model
What is the Tourism Flows Model?
The Tourism Flows Model (TFM) is a unique map based tool that is free
to use online. It allows users to study the movements of international and domestic
travellers in New Zealand. Users can identify trends and capacity requirements
by accessing powerful forecasting data.
The model draws on data from the International Visitor Survey, the Domestic
Travel Survey, Transit New Zealand road counts and the Ministry of Tourism’s
forecasting programme.
What can the Tourism Flows Model tell us?
Interactive maps and tables can be produced to analyse:
Key Figures: Tourism flows The flows of different types of tourists by road and air
Changes in tourist flows over time (forecast up to 7 years ahead)
In 2006 143,000
Tourism intensity (nights) in different destinations
international visitors
Tourist behaviour by destination (e.g. purpose, activities)
travelled on the road
between Christchurch Getting @ the Tourism Flows Model
and Akaroa. By 2013, Visit www.tourismresearch.govt.nz/tfm
around 40,000 more
are expected.
405,000 international and
domestic travellers used
the Milford Road in 2006.
The single largest group
were Australians at
85,000, followed by UK
travellers at 68,000 and
Japanese at 45,000.
Domestic travellers from
Otago/Southland were
the largest domestic
travellers on the road at
14,000 with Aucklanders
numbering 3,000.
www.tourismresearch.govt.nz/tfm29
Figure 15: Travel Flows by UK Visitors Data reliability
Good for where tourist flows are high.
Areas with lower flows are subject to
sampling errors.
Related information
Related information
www.tourismresearch.govt.nz/tfm
DATASETS
TFM user guide
TFM summary publications
TFM methodology
Figure 15 shows the travel pattern of UK visitors by road in the North Island.
The thickness of the red lines show that many UK visitors leave the main routes,
taking State Highway 1 to Northland, and exploring the Cormandel and Hawke’s
Bay areas.
Example of use
Figure 16: Travel Flows by Chinese Visitors A retailer specialising in products
designed to appeal to the Chinese
market was considering the best
placement for their store. Using
the flows model they saw that the
bulk of Chinese visitors travelled
the road between Auckland and
Rotorua. They decided if they could
build a relationship with Chinese
tour groups, somewhere along this
road could be a good location.
Figure 16 shows the travel pattern of Chinese visitors by road in the North Island.
When compared to Figure 15 it is quite clear that Chinese are predominantly
travelling between Auckland and Rotorua, and are less likely to explore the
North Island further.
3.ABOUT / 4.QUICK GUIDE / 6.REPORTS / 8.WEBSITE / 12.IVA / 14.IVS / 16.DTS / 18.ITM / 20.CAM / 22.RVM / 24.FORECASTS / 26.TSA / 28.TFM / 30.RESEARCH30
The Research Programme –
moving forward
This year, some major improvements to the research programme are
being advanced.
Significant structural changes are being made to our most important surveys,
the International Visitor Survey (IVS) and the Domestic Travel Survey (DTS).
Management of the surveys has been brought in-house, with only the data
collection tasks outsourced. The changes will improve the quality and stability
of the data, and the new system will see the times from collection to
dissemination significantly reduced. Users will be get better data, and faster,
under this new system.
To further assist users, transparent data quality standards will be prepared for
these datasets so users are aware of the strengths and weaknesses of the data,
and the levels of confidence associated with the data usage.
‘Accessibility’ has become the new mantra of the research programme.
The research website (www.tourismresearch.govt.nz) has been re-launched
with data and analysis much easier to find. A range of data access options are
provided that cater to basic, intermediate and advanced users. The latest data,
for the time period of the user’s choice, will always be available.
With the Core Tourism Dataset established on a sound footing, the challenge
now is to improve the coverage and depth of the data available to the sector.
We are working to bolster our resources by assessing how electronic transaction
data can be used in tourism and how additional sectorial data collections could
be developed or improved.
We are committed to adding value to the important data resources through
research and analysis, and finding new ways to make the resource available
to users. For instance, the Tourism Flows Model has been established directly
on the website enabling regions to very quickly and easily analyse tourism
movements to their region.
To discuss any aspect of the research programme, or to find out more, please
contact the Research Team on 04 474 2812 or email info@tourism.govt.nz.31
Image credits
Lawnmover and Marae, Carving – New Zealand Maori
Tourism Council, www.maoritourism.co.nz,
Mt Taranaki from Pouakai Range, Kayaks, Traverse to the
Rolling Pin – Iain Guilliard, www.iainguilliard.com
Old Slaughterhouse – www.oldslaughterhouse.co.nz,
www.rfleming.net
Hole in the Rock, Moeraki Boulders, Whale Fluke, Bay of
Islands, Camping, 90 Mile Beach, Dolphins in the Bay, Water
Jump, Cave Shower, Ice Climb – Tourism Holdings Limited,
www.thlonline.com
Lake Taupo Lodge – www.laketaupolodge.co.nz
Double Kayakers – Antonia Westmacott
3.ABOUT / 4.QUICK GUIDE / 6.REPORTS / 8.WEBSITE / 12.IVA / 14.IVS / 16.DTS / 18.ITM / 20.CAM / 22.RVM / 24.FORECASTS / 26.TSA / 28.TFM / 30.RESEARCHwww.tourismresearch.govt.nz
The Ministry of Tourism
PO Box 5640
Wellington
Telephone: (04) 498 7440
Fax: (04) 498 7445
Email: info@tourism.govt.nzYou can also read