Xargo Aircraft Concept - NASA / DLR Design Challenge 2019 - Team Academic Support Dipl.-Ing. Florian Dexl
←
→
Page content transcription
If your browser does not render page correctly, please read the page content below
NASA / DLR Design Challenge 2019

       Xargo Aircraft Concept

                                 Team
B. Çetinoǧlu, M.Y. Cürebal, A. Gatto, A. Gebhardt, J. Oppe, D. Roßner

                       Academic Support
                      Dipl.-Ing. Florian Dexl
                    Chair of Aircraft Engineering
                             TU Dresden

                         Submission Date
                           July 1st , 2019
Team Members

                 Team members from left to right:

                         Daniel Roßner
         Aeronautical Engineering, 6th semester (Diploma)
              daniel.rossner@mailbox.tu-dresden.de

                        Johannes Oppe
        Aeronautical Engineering, 10th semester (Diploma)
              johannes.oppe@mailbox.tu-dresden.de

                        Anne Gebhardt
         Mechanical Engineering, 10th semester (Diploma)
            anne-lisa.gebhardt@mailbox.tu-dresden.de

                    Mustafa Yasar Cürebal
         Aeronautical Engineering, 8th semester (Bachelor)
         mustafa_yasar.cuerebal1@mailbox.tu-dresden.de

                       Bengisu Çetinoǧlu
         Aeronautical Engineering, 8th semester (Bachelor)
            bengisu.cetinoglu1@mailbox.tu-dresden.de

                 Arnold Gatto (Team Lead)
        Aeronautical Engineering, 10th semester (Diploma)
              arnold.gatto@mailbox.tu-dresden.de
Abstract
Commercial Operation of small aircraft poses a major challenge for airliners as they are
faced with a number of economic difficulties. Especially in remote areas flight missions are
characterized by short-haul distances with low demand and consequently high takeoff und
landing frequencies in relation to the total flight hours leading to excessive fix costs and direct
operation costs for the air carrier. However, accessibility of remote regions are essential as
they often are the only possible connection for local communities to reach nearest cities.
To address above mentioned economic issues the TU Dresden student team has come up
with a design proposal of an aircraft concept aiming to surpass contemporary commuter
airplanes in efficiency and overall economy. The present report provides an overview of the
Design Layout and demonstrates compliance with a set of Top Level Aircraft Requirements
(TLAR) established within the 2019 NASA / DLR Design Challenge along with regulatory
requirements of the Federal Aviation Administration. Furthermore, integrated key technolo-
gies are explained and assessed with respect to credibility of 2025 entry into service. For this
purpose the commonly known Technology Readiness Level (TRL) is estimated accordingly.
Xargo is a nine-seated high wing commuter aircraft equipped with two electrically driven
propeller designed for cruise flight and two additional tiltable rotors enabling short take-
off and landing capability and generous rate of climb. The required amount of energy is
converted by a hydrogen fuel cell providing all four electric motors with adequate power.
By means of a modular cockpit and payload compartment design the aeroplane is suitable
for quick conversion between passenger and unmanned cargo operation. Comparison with
existing commuter planes show significant savings in costs due to improved aerodynamics,
sophisticated propulsion strategy and light weight composite structure.
IContents
Contents
Nomenclature IV
List of Figures VI
List of Tables VI
1 Introduction 1
1.1 Background . . . . . . . . . . . . . . . . . . . . . . . . . . . . . . . . . . . . . 1
1.2 Existing nine-seated Commuter Planes . . . . . . . . . . . . . . . . . . . . . . 2
1.3 Tools and Methods . . . . . . . . . . . . . . . . . . . . . . . . . . . . . . . . . 2
2 Design Overview 3
2.1 Design Layout . . . . . . . . . . . . . . . . . . . . . . . . . . . . . . . . . . . 3
2.1.1 Fuselage . . . . . . . . . . . . . . . . . . . . . . . . . . . . . . . . . . . 3
2.1.2 Wing . . . . . . . . . . . . . . . . . . . . . . . . . . . . . . . . . . . . 5
2.1.3 Empennage . . . . . . . . . . . . . . . . . . . . . . . . . . . . . . . . . 6
2.1.4 Engine Installation and Propeller Sizing . . . . . . . . . . . . . . . . . 7
2.2 Key Technologies . . . . . . . . . . . . . . . . . . . . . . . . . . . . . . . . . . 8
2.3 Mass Estimation and Center of Gravity . . . . . . . . . . . . . . . . . . . . . 8
2.4 Propulsion Strategy . . . . . . . . . . . . . . . . . . . . . . . . . . . . . . . . 10
2.4.1 Propulsion System Choice . . . . . . . . . . . . . . . . . . . . . . . . . 10
2.4.2 Fuel Cell . . . . . . . . . . . . . . . . . . . . . . . . . . . . . . . . . . 11
2.4.3 Storage System . . . . . . . . . . . . . . . . . . . . . . . . . . . . . . . 12
3 Flight Mission Analysis 13
3.1 Operation and Logistics . . . . . . . . . . . . . . . . . . . . . . . . . . . . . . 13
3.2 Mission Plan . . . . . . . . . . . . . . . . . . . . . . . . . . . . . . . . . . . . 14
3.3 Unmanned Operation . . . . . . . . . . . . . . . . . . . . . . . . . . . . . . . 15
3.3.1 Taxi Way . . . . . . . . . . . . . . . . . . . . . . . . . . . . . . . . . . 16
3.3.2 Ground Run . . . . . . . . . . . . . . . . . . . . . . . . . . . . . . . . 16
3.3.3 Climb . . . . . . . . . . . . . . . . . . . . . . . . . . . . . . . . . . . . 17
3.3.4 Cruise . . . . . . . . . . . . . . . . . . . . . . . . . . . . . . . . . . . . 17
3.3.5 Descent . . . . . . . . . . . . . . . . . . . . . . . . . . . . . . . . . . . 18
3.3.6 Landing . . . . . . . . . . . . . . . . . . . . . . . . . . . . . . . . . . . 18
4 Performance Data 19
4.1 Takeoff . . . . . . . . . . . . . . . . . . . . . . . . . . . . . . . . . . . . . . . . 19
4.1.1 Ground Run . . . . . . . . . . . . . . . . . . . . . . . . . . . . . . . . 19
4.1.2 Flare . . . . . . . . . . . . . . . . . . . . . . . . . . . . . . . . . . . . . 20
4.2 Climb . . . . . . . . . . . . . . . . . . . . . . . . . . . . . . . . . . . . . . . . 20
4.3 Cruise . . . . . . . . . . . . . . . . . . . . . . . . . . . . . . . . . . . . . . . . 21
4.4 Descent . . . . . . . . . . . . . . . . . . . . . . . . . . . . . . . . . . . . . . . 21
4.5 Landing . . . . . . . . . . . . . . . . . . . . . . . . . . . . . . . . . . . . . . . 22
4.5.1 Flare . . . . . . . . . . . . . . . . . . . . . . . . . . . . . . . . . . . . . 22
4.5.2 Breaking . . . . . . . . . . . . . . . . . . . . . . . . . . . . . . . . . . 23
5 Evaluation 23
5.1 Costs . . . . . . . . . . . . . . . . . . . . . . . . . . . . . . . . . . . . . . . . . 23
5.2 Risk and Failure Assessment . . . . . . . . . . . . . . . . . . . . . . . . . . . . 24
IIContents
6 Conclusion and Outlook 25
References 26
A Appendix i
A.1 All Engines Operative . . . . . . . . . . . . . . . . . . . . . . . . . . . . . . . i
A.1 One Engine Inoperative . . . . . . . . . . . . . . . . . . . . . . . . . . . . . . ii
IIINomenclature
Nomenclature
Symbol Description Unit
Abbreviations
EAS Essential Air Service, Equivalent Air Speed
FAA Federal Administration of Aviation
CAD Computer Aided Design
CAS Callibrated Air Speed
CFR Code of Federal Regulations
CFRP Carbon Fiber Reinforced Plastics
CoG Center of Gravity
DC Design Challenge
DOC Direct Operating Costs
DGTW Design Takeoff Gross Weight
GPS Global Positioning System
GBAS Ground Based Augmentation System
ICA Initial Cruise Altitude
ILS Instrument Landing System
MZFM Minimum Zero Fuel Mass
OLED
PEFC Polymer Electrolyte Fuel Cell
STOL Short Takeoff and Landing
UAS Unmanned Air System
TLAR Top Level Aircraft Requirements
TRL Technology Readiness Level
WTE Wing Tip Engine
XME Xargo Main Engine
Greek
α angle of attack rad,◦
η efficiency −
ΦF volume density of carbon fiber in composite −
Latin
D drag force N
e mass specific energy kJ/kg
E Energy J
L lift force N
m mass kg
p∗ mass specific power kW/kg
Pm mass specific power density kW/kg
Pv volume specific power density kW/kg
RII breaking stress composite N
t thickness mm
T thrust N
Indices
IVNomenclature
max maximum
min minimum
fc fuel cell
VList of Figures
List of Figures
1 Route Distribution of Commuter Airline Cape Air from [2] . . . . . . . . . . 1
2 Multiview Orthographic Projection . . . . . . . . . . . . . . . . . . . . . . . . 3
3 Swivel Mechanism . . . . . . . . . . . . . . . . . . . . . . . . . . . . . . . . . 4
4 Passenger Cabin Module . . . . . . . . . . . . . . . . . . . . . . . . . . . . . . 5
5 Fuselage Cross Section . . . . . . . . . . . . . . . . . . . . . . . . . . . . . . . 5
6 WTE during climb (left) and during cruise (right) . . . . . . . . . . . . . . . 7
7 Cargo Wagon . . . . . . . . . . . . . . . . . . . . . . . . . . . . . . . . . . . . 14
8 Folding Mechanism . . . . . . . . . . . . . . . . . . . . . . . . . . . . . . . . . 14
9 Number of Flights . . . . . . . . . . . . . . . . . . . . . . . . . . . . . . . . . 15
10 Taxi Way . . . . . . . . . . . . . . . . . . . . . . . . . . . . . . . . . . . . . . 17
11 Ground Run . . . . . . . . . . . . . . . . . . . . . . . . . . . . . . . . . . . . . 17
12 Climb . . . . . . . . . . . . . . . . . . . . . . . . . . . . . . . . . . . . . . . . 18
13 Cruise . . . . . . . . . . . . . . . . . . . . . . . . . . . . . . . . . . . . . . . . 18
14 Descent . . . . . . . . . . . . . . . . . . . . . . . . . . . . . . . . . . . . . . . 18
15 Landing . . . . . . . . . . . . . . . . . . . . . . . . . . . . . . . . . . . . . . . 19
16 Comparison of DOCs: Xargo vs. Pilatus PC12 . . . . . . . . . . . . . . . . . 23
List of Tables
2 Specification of similar Commuter Aircraft . . . . . . . . . . . . . . . . . . . . 2
3 Wing Geometry . . . . . . . . . . . . . . . . . . . . . . . . . . . . . . . . . . . 6
4 Tail Geometry . . . . . . . . . . . . . . . . . . . . . . . . . . . . . . . . . . . 7
5 Comparison of different mass estimation method results . . . . . . . . . . . . 9
6 Component Mass Breakdown . . . . . . . . . . . . . . . . . . . . . . . . . . . 10
7 Comparison of Energy Source Specifications . . . . . . . . . . . . . . . . . . . 11
8 Mass specific Power . . . . . . . . . . . . . . . . . . . . . . . . . . . . . . . . 11
9 Characteristics of a PEFC . . . . . . . . . . . . . . . . . . . . . . . . . . . . . 11
10 Energy Consumption . . . . . . . . . . . . . . . . . . . . . . . . . . . . . . . . 12
11 Time for Descent . . . . . . . . . . . . . . . . . . . . . . . . . . . . . . . . . . 22
12 Compliance with Requirements . . . . . . . . . . . . . . . . . . . . . . . . . . 25
13 Climb from 1,500 ft to 10,000 ft (all engines operable) . . . . . . . . . . . . . i
14 Climb from 10,000 ft to 20,000 ft (all engines operable) . . . . . . . . . . . . i
15 Climb from 20,000 ft to 25,000 ft (all engines operable) . . . . . . . . . . . . i
16 Climb from 1,500 ft to 10,000 ft (one engine inoperable) . . . . . . . . . . . . ii
VI1 Introduction
1 Introduction
1.1 Background
It is no surprise that commercial operation of small aircraft is quite a challenging task from
an airline’s point of view. As the number of seats goes down and flight hours decrease, fix
costs rise tremendously. Furthermore, higher than average expenses on maintenance and
fuel arise leading to an incline in direct operating costs (DOC). This is primarily caused by
frequent takeoffs and landings in relation to total flight hours, demanding sooner inspections
at increasing intervals.
To counteract the tendency of airliners to shift their operation to potentially more lucrative
markets, the United States Department of Transportation established the Essential Air Ser-
vice (EAS). Within this programme the government subsidizes certified air carriers to serve
approximately 175 communities in nearly every state that otherwise would not be able to get
access to any scheduled flight service [1].
However, a close look into America’s largest commuter airline’s route distribution (see
Figure 1) indicates that it cannot rely solely on government grant. 55% of their flights do
not meet the requirements of the Department of Transportation to qualify for EAS. A fleet
of highly efficient aircraft that operate within distances of 100 NM or less is therefore crucial
for the airline’s profitability. Cape Air estimates that 11,000 nine-seated aircraft need to be
replaced in the near future as the majority of the current world-wide fleet is not capable of
commercial operation anymore [2]. Hence, one can conclude that there is vast necessity for
the aircraft industry to come up with more innovative and more importantly more economical
concepts of short-haul commuter planes.
Cape Air Route Distribution by Mileage, 2016 Scheduled Commuter
Figure 1: Route Distribution of Commuter Airline Cape Air from [2]
NASA and DLR have specified their perception of the next generation commuter aircraft
by a list of requirements and characteristics that may be summarized as:
11 Introduction
• short takeoff and landing capability,
• convertable between passenger and cargo configuration in less than one hour,
• unmanned freight operation,
• low noise emission,
• low life cycle cost,
• compliance with 14 CFR Part 135 and Part 23.
1.2 Existing nine-seated Commuter Planes
The current fleet of commuter aircraft with approximately nine seats involve models of man-
ufacturers like Cessna, Pilatus, Piper or Beechcraft. Table 2 compares the most well-known
representatives by their specifications. Like the Cessna 402C or Pilatus PC-12 the majority
of the commuter planes were built in the last century and, as the author of [3] points out,
are not optimized for short-haul operation. After all, as figure 1 indicates, 67% of Cape Airs
flights are less than 100 NM. Recently, the Italien company Tecnam has built their P2012
Traveller which is expected to entry service this year. With relatively short runway length
it gets probably the closest to the requirements of the 2019 NASA / DLR Design Challenge
(DC). However, its piston engines do not provide sufficient power to reach the possible range
in less than 99 minutes which is a major design driver as it restricts the effective range a
commuter aircraft without lavatory onboard can operate in. Furthermore, all contemporary
planes in this category still rely on conventional power supply whereas particularly small
aircraft might benefit the most of alternative propulsion concepts.
Cessna 402C Pilatus PC-12 Tecnam P2012 DC 2019 (Goal)
Range 875 NM 1,845 NM 620 NM 500 NM
Max Cruise Speed 194 KTAS 285 KTAS 210 KTAS >320 KTAS
Takeoff Run 1,763 ft 1,480 ft 1,410 ft 250 ft
Seats 10 11 11 9
Entry into Service 1967 1994 2019 2025
Table 2: Specification of similar Commuter Aircraft (Data from [3])
1.3 Tools and Methods
Most of presented calculations are based upon handbook methods suggested by aircraft en-
gineer and author Daniel P. Raymer. These include both empirical formulae and statistical
interpolations as well as simple analytical equations. For flight performance calculations,
teaching material provided by TU Dresden Professor K. Wolf, head of aircraft engineering
was a main source. Underlying analytical models, assumptions and their limitations are
discussed in chapter 4.
Aircraft conceptual design is a strongly iterative process that requires frequent changes
especially until the final configuration is chosen. This is why a parametric computer model
was built first before using any computer aided design (CAD) software for more sophisticated
design features. NASA’s open source software OpenVSP has been of tremendous use as it
allows for quick and uncomplicated change in aircraft geometry. Performance calculations
were made using spreadsheet software such as Excel as well as Mathcad. Catia V5 was used
for CAD modelling of the final aircraft design and rendering.
22 Design Overview
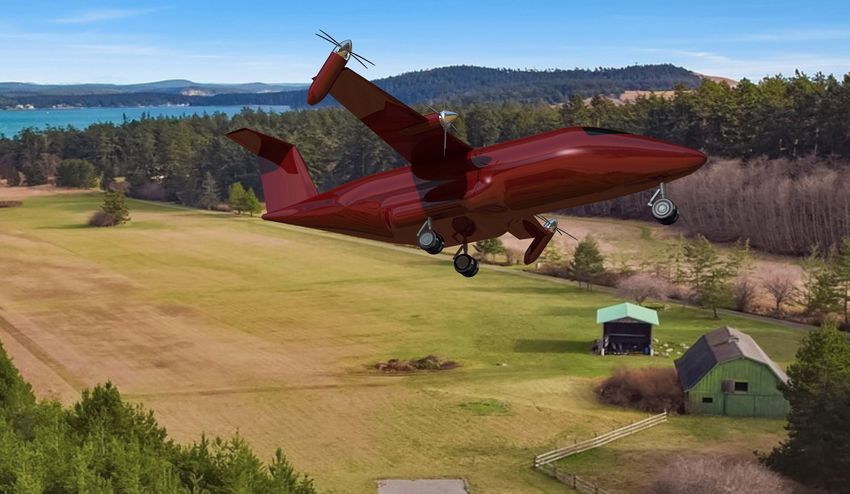
2 Design Overview
2.1 Design Layout
Figure 2: Multiview Orthographic Projection
2.1.1 Fuselage
When looking at Xargo’s fuselage two things in particular stand out that is not seen very
often. Firstly, there are no windows for the passengers to look out and secondly, there are is no
door to enter the aircraft. Windows might still be necessary for long range flight, for missions
of 120 NM distance however, the view outside can be replaced by state-of-the-art transmission
technology that monitors the instantaneous scenery on 180◦ OLED displays covering the walls
around the passenger. This drastically simplifies manufacturing of the fuselage tube made
from carbon fibre reinforced plastics (CFRP) and allows for a more weight saving oriented
design as there are no holes that reduce the fuselage’s stiffness.
The access to the interieur of the aircraft is realized by a swivel mechanism between the
cockpit and the passenger section. Figure 3 schematically illustrates how this may be done.
For stability, a lever is extended to the ground supporting the joint during the opening
movement. This way the nose section can open sideways. The main advantage of this
particular design feature is that it allows for autonomous loading and unloading of both
freight and passengers in a modular manner. Boarding procedure is explained in greater
detail in section 3.1
32 Design Overview
Figure 3: Swivel Mechanism
Both cockpit and payload compartment are separate entities. They are basically enclosed
containers that are detachable of the fuselage structure at any time. Figure 4 exemplarily
shows such a module for the passenger cabin. There are also containers like this for cargo
on freighter missions as well as for the cockpit, respectively. As seen in Figure 4, the cabin
consists of a single aisle and two seating rows allowing occupation of 9 passengers. Addi-
tionally, design comparisons to already existing small airplanes had been drawn to confirm
the design choice. The option of a single aisle, single seat row had been considered due to
aerodynamic benefits, however it was not expected to fullfill enough stability considering the
bending moment caused by the wings. Enough space is provided within the fuselage for the
passengers luggage in the cabinet behind the seating row on the left-hand side of the aisle.
Carry-On (seizing a maximum of 9 x 14 x 22 inch) can be stored there. For Check-In luggage
(seizing a maximum of 36 x 16 x 28 inch) the remaining space behind the cabinet is used.
Here, tension belts secure the luggage during flight. Futhermore, the choice was made to
exclude head compartments in order to gain head space which increases passenger comfort.
To provide a view and hence further comfort, passengers are surrounded by an OLED wall.
Using live-cameras, passengers are able to see the sky during the flight. It is expected due to
fast technology development in photonics [4] and industries investment projection [5], that
OLED screens will be extra slim and affordable in the near future. Instead of the outside
view transmission there are endless possibilities to display, for instance sun set ambience or
even aquarium scenery. The decision in this regard is up to the operating company. The slim
design of the seats was chosen because of the narrow cabin. Furthermore, the design allows
passengers to appreciate the projected view of the OLED screens. The seats are expected
to fullfill the restrictions of the FAAs security standards. The emergency exit for both pas-
sengers and pilot will be one of the cockpit windows. Doors and openings in the modules
42 Design Overview
that may be operated without effort ensure the accessibility for everyone onboard. In case
of an emergency, the designated window slides open by simply pressing a button next to the
pilots head. A rope is provided for passengers to let themselves down the nose safely. Also,
a life-jacket is provided for every passenger which is part of an emergency kit that is stored
underneath the seat.
Figure 4: Passenger Cabin Module
The cross section of Xargo is of circular shape. In figure 5 one can see reason why this
kind of cross section was chosen. The space between the cabin module and the fuselage skin
is used to store additional hydrogen tanks and the required fuel cell packages.
Figure 5: Fuselage Cross Section
2.1.2 Wing
Since Xargo will mainly serve in rural regions where takeoff and landing takes place at mostly
unpaved airstrips, stones flying around or dirt hitting the propeller or engines are a concern
that should not be neglected in the design of the aircraft. Therefore, the choice was made to
place the wing above the fuselage. This allows for shortening the landing gear since there is
52 Design Overview
no crucial floor clearance requirement to consider which also facilitates loading and unloading
precedure.
The required STOL capability is a major design driver when it comes to conceptualizing
the wing. Because of the tilt of the outer engines both wing area and maximum lift coefficient
are still at moderate amounts which favours cruise efficiency dramatically. Wing loading and
thrust-to-weight-ratio were adjusted in several iterative steps for an adequate compromise
between power and wing area. Wing aspect ratio was set as high as possible while taking
the increasing stress into account that results from the high lever of the wing tip engines.
Sweep angle was set according to cruise mach number after [6]. For good-tempered stall
characteristics and to prevent tip stall the wing is twisted geometrically by three degrees.
Considering wing sweep and twist, an optimal taper ratio was selected for best possible
approximation of an elliptical lift-distribution. Dihedral angle affects the response of the
aircraft whenever it is banked. A value based on historical guidelines was chosen. Table 3
contains all relevant parameters.
reference area SW 25m2 taper ratio λW 0, 54
aspect ratio ΛW 9 dihedral angle ΓW 2◦
wing span bW 15m mean aerodynamic chord C̄W 1.705m
sweep angle ϕW 4◦ root airfoil NACA 2414
wing twist 3◦ tip airfoil NACA 2410
Table 3: Wing Geometry
The wing’s position with respect to the fuselage was examined by estimating Xargo’s
center of gravity (CoG). For a stable aircraft it should be located at 30% of the wing mean
aerodynamic chord [6].
Because a maximum lift coefficient of Cl = 2.5 is to be realized, the wing integrates a
shape morphing structure that is able to deflect the entire trailing downwards and therefore
replacing conventional flaps as high lift system. Since there is no space for ailerons left, it is
intended to use spoilers for roll control. Those are also needed for rapidly decelerating the
aircraft after touchdown. Control surfaces were designed based on empirical data presented
in [6].
2.1.3 Empennage
For the empennage a T-tail has been chosen. This configuration promises reduction of both
horizontal and vertical stabilizer reference area by up to 5%. Due to end-plate effect, the
vertical tail may be reduced in size and the horizontal tail can be designed smaller since the
T-tail configuration places it away from propwash and wing wake.
The required tail area is calculated using the tail volume coefficient method for initial
sizing:
LV T SV T
cV T = (1)
bW SW
LHT SHT
cHT = . (2)
C̄W SW
Typical values for twin turboprop aircraft for vertical respectively horizontal tail volume coef-
ficient are cV T = 0.08 and cHT = 0.9, leading to the reference areas shwon in table 4. Vertical
and horizontal tail moment arm LV T and LHT are taken from the CAD model. Regarding
62 Design Overview
aspect ratio and taper ratio, a typical value was selected based on historical guidelines from
[6].
Vertical Tail Horizontal Tail
reference area S 4.31m2 4.97m2
aspect ratio Λ 1.2 4
taper ratio 0.7 0.6
tail span b 2.3m 4.46m
sweep angle ϕW 25◦ 18◦
airfoil NACA 0012 NACA 0012
Table 4: Tail Geometry
According to Raymer, a ratio between elevator chord to horizontal tail chord of 0.36 and a
ratio between rudder chord and vertical tail chord of 0.46 for general aviation aeroplanes is
an adequate first guess when it comes to control surface sizing.
2.1.4 Engine Installation and Propeller Sizing
Xargo is propelled forward by four propellers, driven by an electric motor each. To satisfy
performance requirements, they provide a total power of 2, 000kW . The thrust of the props
is divided such that the two inner engines are solely designed and optimized for cruise flight.
However, they also support the outer engines during takeoff and climb. To accomplish the
maximum range of 833km, motors of 515 kW each were chosen. The wing tip engines (WTE)
are responsible for assuring STOL capability by tiliting the whole assembly of motor and
propeller to an angle optimized for shortest takeoff distance possible. They provide a power
of 485kW each. To minimize the drag tradeoff during cruise, the propeller blades are able to
fold flush to the engine nacelle. Figure 6 illustrates the WTE with in different blade positions.
Figure 6: WTE during climb (left) and during cruise (right)
Equation () was used to calculate optimal propeller diameter as a function of engine power
√
4
DP rop = Kp P (3)
where Kp is the blade coefficient, taken from [6]. The obtained value for propeller diam-
eter must be adjusted such that the helical tip speed does not reach sonic speed and as a
consequence loses efficiency because of shock formation. This is accomplished by checking
inequation ():
72 Design Overview
q m
V 2 + (πnDP rop )2 < 290 (4)
s
where a rotation rate of n = 2, 2000rpm and a cruise speed of V = 140 ms was assumed.
2.2 Key Technologies
This chapter deals with the key technologies behind the concept. They ensure the improve-
ment of the flight performance, with a better flow behavior, protection of the environment
and work more efficiently compared to the common airplanes. The technical possibilities
must be available until 2025, so the founders had to limit thereselves to the most advanced
and tested technologies. For the assessment, they used the technology readiness level, or
short TLR.
The Adaptive Compliant Trailing Edge [7] (TRL 8) represents a significant improvement
over conventional flow control system. The shape morphing allows the airflow to follow the
surface contour ideally. This can reduce fuel consumption by up to 12%. Furthermore, the
control surfaces do not separate from the rest of the wing. This means that a noise reduction
[8] of 30% is achieved during landing and take-off. This is applied to Xargo in the ailerons,
rudder and elevator, so that the induced drag will be reduced. The high-lift-system will
consist of a combination of conventional and morphing wing in order to generate the highest
possible lift. This is of great importance for the STOL properties to start even on the shortest
distances.
To further increase efficiency, we rely on Sharkskin technology (TRL 8) [9]. The Sharkskin
consists of thousands of small-scale structures that are variable in size and shape. This
structure consists of three raised ridges and can be printed in 3-D or directly scratched into
the surface. They are mounted on the suction side of the wing and the upper half of the
fuselage. The Sharkskin works as “high-powered, low profile vortex generator". So, this
structure ensures low frictional resistance and increased the lift-to-drag ratio of the aircraft
surface up to 323% compared to standard airfoils [10]. The Sharkskin Technology favors
the flow behavior and can save up to 1% of the energy in flight. That means the airplane
must carry less hydrogen to fly the full mission. Both technologies are already well developed
and therefore realistic for implementation until 2025. They will significantly increase the
efficiency of Xargo, keeping operating costs low and protecting the environment from noise
and pollutant.
2.3 Mass Estimation and Center of Gravity
To obtain an adequatelly accurate estimation of mass and CoG several methods are employed.
In a first step a rough estimate based on [6] is established. The design takeoff gross weight
(DTGW) W0 is added up by crew, payload, fuel and empty weight. Both crew weight and
payload weight can be taken easily from the design requirements. Fuel weight and empty
weights are replaced by fractions of total weight as they are dependent on DTGW and
therefore must be determined in an iterative process. DTGW can finally be solved with
equation
Wcrew + Wpayload
W0 = . (5)
1 − (Wf /W0 ) − (We /W0 )
Since there is little data known for hydrogen powered four engine aircraft, both empty
weight fraction and fuel weight fraction were calculated using formulae for twin turboprop
for a first estimation. Empty Weight fraction is given by the empirical relation
82 Design Overview
We
= AW0C (6)
W0
which can be further reduced by 5% as Xargo is designed to consist of advanced composite
structure. Coefficients A and C are from [6].
For fuel weight fraction mission requirements for maximum chosen range must be taken into
account. The mission is approximated as a sequence of warmup and takeoff, climb, cruise and
descent, second climb, cruise and descent (consisting 45 min energy reserve and additional 100
NM in case of aborted landing) and landing. For each segment, weight fractions are estimated
based on historical data and Breguet equation is used for cruise segment. Propeller efficiency
was assumed to be ηP = 0.8 and lift-to-drag ration was taken from empirical relationship
between (L/D)max and wetted aspect ratio.
After determining thrust-to-weight ratio and wing loading a more refined sizing method
was employed. Hereby, the empty weight fraction is given by
We hp C3 W0 C4 C5
= a + bW0C1 AC2 Vmax (7)
W0 W0 S
taking into account maximum speed Vmax , wing loading W0 /S and power loading hp/W0 .
Furthermore, fuel weight fractions are adjusted, considering mach number at initial cruise
altitude and actual L/D from performance calculations. This method yields an aircraft mass
of approximately 4000kg, keeping in mind that Xargo’s empty weight might actually be higher
since it has several design features that deviate from a standard twin turboprop configuration.
These are: two additional engines, use of electric motors instead of turbine engines, hydrogen
fuel tank, folding mechanism between cockpit and cargo/passenger compartment, enclosed
and removable cabins for payload and pilot. On the other hand fuel weight can expected
to be reduced by 2/3, according to own calculations. Since both empty and fuel weight
strongly depend on another, for DTGW an additional 500kg were added and required mass
of hydrogen was determined from performance calcuations, assuming an aircraft total mass
of 4500kg. Empty weight was further refined using a component buildup model based on
empirical formulae from both [6] and [11]. Because suggested equations by no means represent
contemporary developments, adjustments are made accordingly. The equations for general
aviation aircraft category are used and a weight breakdown could be examined separating
structural weight, powerplant weight and fixed equipment weight. As presumed, the more
refined component buildup model leads to an increased empty weight in comparison to the
previously conducted mass estimation based on empirical data of twin turboprop aircraft.
This would normally mean that fuel weight must be adjusted however because fuel weight
was calculated with a more conservative weight than obtained by the former method, we see
no need for correction in fuel weight at this point. Table 5 presents the results of the different
approaches.
Mass Estimation Refined Mass Estimation
Component Buildup
(Twin Turboprop) (Twin Turboprop)
Crew 100 kg 100 kg -
Payload 907 kg 907 kg -
Fuel Weight 539 kg 521 kg -
Empty Weight 2,146 kg 2,420 kg 3,712 kg
DTGW 3,692 kg 3,948 kg -
Table 5: Comparison of different mass estimation method results
92 Design Overview
Table 6 provides an overview of the final estimated aircraft mass, including an empty
weight breakdown, crew and payload weight, fuel weight, maximum zero fuel mass (MZFM)
and DTGW as well as a rough estimation of the aircrafts CoG.
Component Mass [kg] Component CoG [m]
Crew 100 2.8
Payload 907 6.8
Empty Weight 3,727 6.78
Structure 1,287 -
Wing 342 6.96
Horizontal Stabilizer 35 14.62
Vertical Stabilizer 34 13.98
Fuselage 620 6.8
Main Landing Gear 197 8.0
Nose Landing Gear 59 1.2
Power Plant 1,739 -
Engines 454 6.33
Fuel System 1,285 7.27
Fixed Equipments 701 -
Flight Controls 137 8.0
Hydraulic System 41 8.0
Electrical System 121 3.0
Avionics 44 2.0
Air Conditioning System 126 5.5
Furnishings 232 5.5
MZFM 4,734 6.7
Fuel Weight (H2) 111 11.7
DTGW 4,845 6.81
Table 6: Component Mass Breakdown
2.4 Propulsion Strategy
2.4.1 Propulsion System Choice
In Table 7, some supply-chain characteristics for different energy sources are listed [12]. To
check them against each other the properties of a battery-system and fuel-cell-system are
related to the characteristics of a conventional kerosene-system (Index: i = battery, fuel cell;
k = kerosene). It shows greatly the advantages and disadvantages in point of efficiency of the
different energy sources. A propulsion chain starting with batteries as energy source leads
the comparison in terms of efficiency and required energy that must be stored. But what
the efficiency cannot make up is that the mass specific energy of actual batteries, batteries
of the next generation or in near future will not be able to store enough energy by moderate
weights to be a serious alternative [13]. What seems to be a good alternative in point of mass
specific density is hydrogen, which is the highest in this comparison. But hydrogen is not that
convenient in handling and storing like kerosene. Also, it must be compressed or liquified,
otherwise it will need up to fifty times of storage volume compared to kerosene [12]. For Xargo
it was decided to consider compressed hydrogen to dodge a complex storage-management for
liquified hydrogen not only on the plane, but on secluded, maybe even isolated airfields which
102 Design Overview
perhaps will not have an adequate developed infrastructure. The last row of Table 7, the
relative fuel mass, figures out, that the mass of batteries will be 13 times higher compared
to Kerosene. Therefore, the mass of hydrogen will split the mass for fuel to nearly a third.
Kerosene Battery Hydrogen (Fuel Cell)
Total Efficiency η [%] 39 73 44
Mass Specific Energie p [Wh/kg] 11,950 500 43,000
Rel. Total Efficiency ηi /ηk 1 1.87 1.13
Rel. Energie Needed Ei /Ek 1 0.54 0.89
Rel. Mass spec. Energie ei /ek 1 0.042 2.51
Rel. Fuel Mass mF,i /mF,k 1 12.9 0.36
Table 7: Comparison of Energy Source Specifications
Table 8 presents mass specific densities of different energy converters to supply the pro-
pellers with shaft power. Fuel cells supple electric energy. That must be considered in this
comparison and an electric motor (e-motor) must be added. To do so the reciprocals of the
power densities are totaled up and inverted back. This results in a mass specific power for
a fuel cell driven propeller of about 1,82 kW/kg. Until 2038 the power density is expected
to be around 13 kW/kg [14]. Extrapolated to 2025 based on already proved electric engine
with power densities around 5,2 kW/kg, the power density is assumed to be approximately
7,6 kW /kg in 2025. In these days values of 7,5 kW/kg are already available (e.g. EMRAX
348), but this is based on peak power what is only available for a short moment [15].
Turbine Engine Electric Motor H2 Fuel Cell [16]
Mass specific Power p∗
[kW/kg] 5-8 7.6 2.8 (2.1 with e-motor)
Rel. Mass spec. Power p∗i /p∗k 1 0.95-1.52 0.26-0.41
Table 8: Mass specific Power
The results of table 7 and table 8 combined show that a fuel cell system (fuel cell, amount
of fuel and e-engine) will save mass in point of fuel but it will be heavier in point of con-
verting energy. Overall it will be a little bit heavier (round about 1,24 times) compared to a
conventional turbine and kerosene system. For Xargo we decided to go for a fuel cell system
with compressed hydrogen and electric engines driving the propellers.
2.4.2 Fuel Cell
There are different kinds of fuel cells available. For the service in an aircraft some of them fit
better than some others. Polymer electrolyte fuel cell (PEFC) systems for example. Table 9
shows the characteristics of a PEFC. PEFC also serves with the highest mass specific power
(up to 2,8 kW/kg).
Operating Cell Electric
Oxidant
Temperature [◦ C] Efficiency [%]
PEFC 80 50 to 68 Hydrogen, Oxygen (pure/air)
Table 9: Characteristics of a PEFC
Mass and Dimensions
The mass and volume power densities Pm,F C and Pv,F C of a PEFC can be assumed with mass
112 Design Overview
specific power density Pm,F C = 2.8kW/kg and Pv,F C = 3.4kW/l [16]. Calculated with an
installed total power of 2,000 kW that will be split into four PEFCs the mass and dimension
of one fuel cell is determined to:
mF C = 178kg
VF C = 147l ≈ 150l.
Specific fuel consumption
The specific consumption bH2 of a hydrogen-oxygen-fuel-cell, as the PEFC, is derived by the
amount (mole) of hydrogen that is necessary for an amount of electrical energy output. This
is estimated with 237 kJ/mol [17]. Converting it by using the molar mass of a H2 molecule
the reciprocal and specific consumption is given to bH2 = 0.00851g/kJ. It is important to
notice, that this is the consumption of hydrogen only. How much oxygen will be used is
estimated by a look on the chemical equation of the fuel cell process [18]:
1
H2 + O2 −−→ H2 O. (8)
2
This equation figures out, that for one H2 molecule there is a half O2 molecule needed, so
that the demand of oxygen is half of the hydrogen consumption, bO2 = 0.00425g/(kWs). It
is intentionally spoken of a demand of oxygen, because the requirement can be supplied by
the airflow around the aircraft.
2.4.3 Storage System
Estimation of the required amount of hydrogen
The amount of hydrogen is estimated by using the results of the performance calculation as
well as using handbook methods. The performance data helps to calculate energy required of
each section. table 10 gives an overview of the energy consumption of each mission section.
Normal Mission
Takeoff Climb Cruise Descent and Loiter Approach
18,267 kJ 1,630,532 kJ 4,664,529 kJ 1,087,266 kJ 658 kJ
Reserve Mission
Extra Fuel (45min) Climb Divert Descent and Loiter Approach
2,540,183 kJ 1,630,532 kJ 268,802 kJ 1,087,266 kJ 658 kJ
Sum: 12,928,675 kJ
Table 10: Energy Consumption
Storage Seizing
To determine the needed storage capacity the calculated amount of energy (12928675 kJ) is
multiplied with the specific consumption (0,008505 g/kJ) of the fuel cell and divided with the
density of compressed hydrogen of 40 kg/m3. As Result there is a storage capacity of 2,75 m3
required. For an optimized stress distribution in the storage structure, the storage geometry
is chosen as circular cylinder with half spherical caps. The capacity of the pressure tank
can then be calculated by the volume of a sphere and a circular cylinder. To reduce weight,
the storage will be made from CFRP. For the following estimation the next assumptions are
made [19]:
• Pressure only results in a force parallel to the fiber direction,
• breaking strength is approximated by RII = RII,F · ΦF ,
123 Flight Mission Analysis
• fiber volume fraction ΦF is set to 60% and
• allowed stress is half of the breaking strength, due to safety considerations.
For a rough weight estimation of the hydrogen storage, its wall thickness is calculated by
the following equation:
ri · p
t= (9)
σ
wherein ri is the inner radius, p is the pressure and σ is the allowed stress. With the
specifications of carbon fibers (ΦF = 0, 6, RII,F = 3900N/mm2 , RII = 2340N/mm2 ) and
the assumptions above the allowed stress is calculated to 1170N/mm2 . The density of the
carbon fiber and matrix material is assumed to ρF = 1, 800kg/m3 and ρM = 1, 200kg/m3 .
For a pressurized cylindric storage the storing capacity grows exponentially with increasing
diameter compared to increasing linear with greater length. Hence, it is more efficient to
choose one big tank than a couple of small ones from a geometric point of view. But it must
be considered that the weight of the storage also grows exponentially. In this regard, it is
more beneficial to split the needed storage capacity into a couple of smaller storages. For
Xargo we splitted the required storing capacity into five tanks. One big storage (capacity
≈ 1, 64m3 ) in the rear of the fuselage and four smaller tanks (capacity ≈ 0, 27m3 each. Total
weight of the storage system is added up to 570 kg.
3 Flight Mission Analysis
3.1 Operation and Logistics
For multimodal operation an interior change has to occur switching from an only passenger
to an only cargo configuration. The passenger cabin provides a door which can be closed
and locked for the time it is not needed and therefore stands on the airport terrain. The
cabin consists of 2 layers. The inner one holds the screens whereas the outer one provides
protection from weather circumstances. The cabin is made of CFRP to provide high stability
and weight advantages. The outer layer is covert with a water proof coating. If attempted
to be stolen or broken into, a 2025 state of the art alarm system is included within the walls.
Figure 7 represents the design of the cargo wagon. It is carried by the same base design as is
the passengers cabin. 2000 pounds are supposed to be carried. The estimation of the cargo
box size, the density of water is the baseline. A cube with the side lengths of 39.4 inch (1 m)
was chosen to fit the cargo goal. For easier loading, the back wall of the box can be detached
by lifting it. A plug-in socket provides the necessary stability. The cargo box is made of
CFRP. Cargo can be put in the box or, if not fitted, bonded in front and/or behind the box
with tension straps. The cargo floor provides 4 eyebolts on each side of the cargo box in
order to prevent loose luggage to shift.
Within the floor, a 2025 state of the art GPS controll- unit and electronical rotors will
provide an autonomous rolling out of the fuselage and to a designated position at the gate of
the designated airport. There, it can be un- and reloaded by the respected logistic company.
The GPS coordinates for parking should be callibrated into the system before the flight for
the respected airport. This requires an available space (hence coordinates) for parking of
the sytem. Furthermore, optical sensors prevent the collition of the system with an other
obstacle. The command of starting the process of rolling out, is starting 5 minutes after the
plane reached the designated gate. In case of a gate change, the operating company will
receive a message by the system, asking for recallibrating the parking position of the box.
133 Flight Mission Analysis
Figure 7: Cargo Wagon
If failed to react, the aircraft will not open automatically and hence, the box will not roll
out. Manually, the aircraft can be opened by an authority for the process to start. It is also
possible for the operating airline to start unrolling via remote control. For stearing back in,
the cargo wagon automatically drives in front of the fuselage opening. Optical sensors allow
the cargo system to roll into the fuselage without collision. This process can be started from
the operating airline via remote control.
Figure 8: Folding Mechanism
Since it could be expected that the aircraft needs to land on small airports possibly provid-
ing a rough or non-paved road, the wheels are made of rubber. The structure is provided with
suspension. The rest of the leg is made of aluminium. The legs are composed of generally
three parts. Similar to a human leg, its mid-joint enables the lower leg to move forward when
the wheels are detouching the rails of the fuselage. Electrical motors includin a control unit
drive the wheels of the legs. Rolling back into the fuselage, elecrical motors on the upper and
mid-joint, lift the device to its original position. The autonomous system is expected to fit
the requirement to switch from only passengers to an only cargo flight.
3.2 Mission Plan
With our aircraft design we offer the possibility to fulfill any kind of task in City areas in
the outback, with passengers or cargo. The protection of the environment and the handling
with a minimum of ground infrastructure at airports is very important for the project. This
is realized by the newest technologies for noise reduction, exhaust pollution, autonomous
loading and unloading as well as the possibility of unmanned flight control. The modular
design of Xargo ensures a rapid ground handling of passengers and cargo. Therefore, the
143 Flight Mission Analysis
turnaround-time is at a minimum in order to fly as many missions as possible. After the
boarding of the passengers or loading of the cargo, as described in the section Operation and
Logistic, the aircraft is ready for departure and maneuvers with the electrically driven landing
gear to the runway. The airplane accelerates with the engines for cruise and the engines at
the wingtip pitched up on a route of 97m and finally lifts off. This is followed by a climb
phase with all engines, up to 10000 ft at velocity CAS (Calibrated airspeed) of 250 kts and
a climb rate of about 10 m/s. After crossing the restricted airspace, it climbs with Cruise
Mach Number of 0.45. At the altitude of 25000 ft the cruising altitude has been reached. In
this part, the tiltable engines are retracted at the end of the wing. Only the cruise engines
continue to run in their optimum range. This significantly reduces energy consumption, noise
emissions and aerodynamic drag. The descent flight path is divided in two sections. Up to
10000 ft with Cruise Mach Number of 0.45 and below limited again with 250 kts. The 24
hours mission plan is separated in two sections. In both parts it is flown with a cruise speed
of about 140 m/s over a distance of 120 nmi (see figure 9). Therefore, it takes 26.5 minutes
for one flight. In the first part the plane transports passengers in the passenger configuration
and at first with the single pilot cockpit. This going to be changed, after unmanned flights
with passengers are allowed. Here every turnaround takes 45 minutes. Over the 12 hours of
the first section, it is possible to cover ten flights. After the 12 hours the plane is going to
be configurated in to the cargo version. So the cockpit is unmanned and the fuselage now
contains the cargo. This section is set to six hours with the same speed, distance and time as
the passenger flights. The turnaround is now 30 minutes and done by the automatic loading
system of the airplane. As shown in Figure 9 Xargo is able to fly 6 missions.
Figure 9: Number of Flights
3.3 Unmanned Operation
One of the most interesting task-position of the design challenge is the autonomous flight. It
will perform cargo missions without a pilot and in a computer-controlled or remote-controlled
aircraft. Currently, modern aircraft have many assistant systems. Thanks to these systems,
pilots are able to achieve safer flight, especially when landing and taking off. In addition,
the autopilot is another system that has been used for many years. The use of all these
systems together allows the aircraft to perform most of their missions autonomously. Xargo
is a fully autonomous aircraft and has the ability to be remotely commanded during take-off
and landing, which is one of the most critical phases of flight. In this way, dangerous situa-
tions that can be experienced, can be eliminated. Autonomous flight consists of two different
perspectives. The first is the devices that are on board and second the infrastructure in
the airport. The aircraft has separate systems for each flight phase. These systems work in
symbiosis with another. Autonomous flight has the ability to fly and route in the same way
as previously scheduled, as well as the ability to detect and react to commands given by air
traffic control. In this way, it is dynamically integrated into air traffic. Secondly, modern
153 Flight Mission Analysis
airports have many infrastructure as ILS. It does not require any additional system for the
operation of the aircraft in such modern and multi-device airports. But due to the short-
distance-aircraft, our aircraft has also the ability to operate in smaller airports. In order to
have this capability, it will be cheaper (instead of the expensive ILS system) and expected to
be developed in the next 6 years Satellite Landing System GBAS.
The following list points out both benefits and challenges that have to be faced with re-
gards to autonomous flight.
Benefits [20]:
• The unpressurized cabin can be used,
• Less danger, nobody will die in the event of an accident,
• No pilot costs,
• Less fuel,
• Less DOC,
• The accident due to the pilots can be avoided with the help of autonomous aircraft
technology,
• Flexible crew planning,
• Ruduce ecological footprint and noise,
• Create new jobs such as: UAS engineers, software developers, manufactures, maintain-
ers etc.
Disadvantages:
• If something goes wrong, the autonomous aircraft can not work spontaneously,
• Critical instruments can fail,
• The passengers do not trust, that means less ticket sales.
In order to make autonomous flight more comprehensible, workflow diagrams were prepared
to show which systems work in coordination with each other for different phases of flight.
Along with the systems already in modern aircraft, some systems have been added to allow
autonomous flight.
3.3.1 Taxi Way
The systems that will be used for Taxi are activated after boarding the passengers or loading
the cargo. The Taxi-Way checklist is checked and all systems have status “operate”. Request
for Taxi has been taken by Airport Ground Control (via Voice Command System). Then,
the lane assist system and the radar control continuously until the runway. The camera and
radar also control around of the aircraft. Any dangerous approach is detected beforehand
and the aircraft stops.
3.3.2 Ground Run
The plane stops when the taxi is complete and the plane reaches the runway. Permission is
taken for departure (via Voice Command System). The take-off checklist is checked and all
necessary controls are provided. Once the takeoff permit is obtained, the aircraft accelerates
163 Flight Mission Analysis
Figure 10: Taxi Way
on the runway. The radar and camera continuously monitor the environment. The sensors
in the engines continuously send information to the control computer of the aircraft against
any engine failure. In case of engine failure, the aircraft follows the procedure as previously
programmed in parallel with the information provided by the speed sensor. After take off, it
continues to climb to a altitude of 1500 ft, thus ending the take-off phase.
Figure 11: Ground Run
3.3.3 Climb
During climb, the aircraft is in communication with air traffic control. It is capable of
reacting immediately to incoming commands. Information from the flight path angle sensor
is continuously checked. Furthermore, the speed of the aircraft is kept constant at 250 kts
until it reaches 10000 ft. The airplane continues to climb in parallel with the pre-programmed
information from the air traffic control. When it reaches ICA, the climb phase ends and the
cruise phase begins.
3.3.4 Cruise
Once the cruise altitude has been reached, the aircraft fix the aircraft speed at 0.45 Mach and
continuously controls it with velocity sensors. The cabin pressure is continuously controlled
and acts the aircraft as pre-programmed if a low cabin pressure is detected. Radar check the
environment continuously in order to detect dangerous approaches in advance. Thanks to
the navigation system, the aircraft moves towards its destination.
173 Flight Mission Analysis
Figure 12: Climb
Figure 13: Cruise
3.3.5 Descent
Engines for descent produce as little thrust as possible. The descent angle and the altitude
sensor are continuously checked. The cabin pressure is continuously controlled and, if a
negative condition occurs, it acts as pre-programmed.
Figure 14: Descent
3.3.6 Landing
Approach angle is continuously controlled before landing.The aircraft makes contact with
Air traffic control and necessary permissions are taken for landing. The landing checklist is
checked and the landing configuration is set. After touch down aircraft brakes on the runway
correctly and smoothly by the lane assist system. Then it makes contact with the Airport
Ground Control and leaves the runway in the appropriate taxi way.
184 Performance Data
Figure 15: Landing
4 Performance Data
4.1 Takeoff
The takeoff distance is limited to at most 1,000 ft taking 35 ft of obstacle clearance into
account. To reach the closest value to the 250 ft takeoff target a low wing loading along with
high maximum lift coefficient is favourable. However, low wing loading negatively affects
climb and cruise performances. The maximum lift coefficient is not expected to exceed val-
ues of 2.5 without a sophisticated high lift system, containg multiple slotted flaps. For these
reasons, we rather have focussed on increasing the thrust-to-weight ratio, which is the third
variable that affects takeoff distance. This mainly allows to simplify the wing geometry und
decrease the otherwise needed large reference area and therefore increases lift-to-drag-ratio
towards its optimal value. By varying the thrust vector of the WTE a vertical force compo-
nent contributes to the lift and this way decreases stall speed and takeoff speed, respectively.
During flare the WTE were determined to have a larger thrust angle than during ground run.
The total distance is determined by two segments: the ground run and the flare [21]
4.1.1 Ground Run
Assumptions [22]:
• aircraft is considered as a mass point,
• smaller angle of attack: α4 Performance Data
The distance for Ground Run is determined from these (1),(2) equations.
Z VLOF
mT O V
sGr = dV (12)
0 T1 + T2 cos σ − µR mT O g − (DR − µR LR ) + µR T2 sin σ
where VLOF is the velocity at liftoff. From equation (3), distance for ground run is calculated:
sGr = 54m. (13)
4.1.2 Flare
Assumptions [22]:
• aircraft is considered as a mass point,
• trajectory is approximately a circular arc,
• constant liftoff velocity VLOF ,
• smaller flight path angle γ4 Performance Data where γ̇ is the angular velocity in s−1 . Assumptions [22]: • flight path angle γ = const, • smaller flight path angle γ
4 Performance Data

The balance of forces is determined [23]:

                                   0 = T cos α − D − mT O g sin γ                       (24)
                                   0 = T sin α + L − mT O g sin γ                       (25)

Descent Velocity w can be found with help of equations (15) and (16):

                                          w = −V sin γ.                                 (26)

                                   Table 11: Time for Descent

4.5 Landing
To fulfill the task of landing distance have thrust the outer motors against the direction of
the weight. So has a thrust angle 90 degrees. This achieves a small landing distance. The
total distance is determined by 2 phases [21]: the flare and the breaking.

4.5.1 Flare

                             mL V̇L = −D − mL g sin γ − T sin γ                         (27)
                                       0 = L − mL g cos γ + T cos γ                     (28)

  Assumptions [22]:

   • aircraft is considered as a mass point,
   • flight path angle γ = const,
   • smaller angle of attack: α
5 Evaluation
4.5.2 Breaking
mL V̇L = T − DR − µB Nz (29)
0 = −mL g + Nz (30)
Assumptions [22]:
• aircraft is considered as a mass point,
• no thrust in flight direction (perhaps reverse thrust),
• no Lift (by use of spoilers),
• no inclination of the runway,
• no wind influence.
sBr = 172m
sT otal = 279m
5 Evaluation
5.1 Costs
To estimate the life cycle costs of Xargo were handbook methods used. To determine RDT&E
(research, development, testing and evaluation) and production cost the modified DAPCA
IV (development and procurement costs of aircraft model) cost model were used [6]. There
were 20% added due to more operational testing of the unconventional propulsion system
and manufacturing of complex composite structures. The purchase cost of Xargo includes
10% surcharge and is about $ 4.829.041 and so 12 % more expensive as a Pilatus PC 12 [24].
But as Figure 16 shows Xargo will save operational costs such as fuel [25], [26]. The direct
operating costs were calculated by the AEA model (Association of European Airlines) [27].
DOC Comparison
Figure 16: Comparison of DOCs: Xargo vs. Pilatus PC12
235 Evaluation
5.2 Risk and Failure Assessment
Along the way of designing Xargo, certain design features have been implemented which pre-
vent failure or damage that could potentionally affect the passenger’s safety or the aircraft’s
structural integrity.
• Swivel Mechanism: During turnaround the nose of Xargo will be swiveld sideways
to open the fuselage for loading or unloading of the payload module. To counteract any
instability or damage to the joint, a lever extends to the ground.
• convertable between passenger and cargo configuration in less than one hour,
• Foldable Propeller Blades: While retracting the propellers of the WTE they must
be positioned in a way that they do not clash with the wing itself. To ensure so, there
is a positioning sensor considered which knows exactly the position of blade and will
force the propeller to rotate into the necessary position to be folded.
• Hydrogen: Hydrogen is highly flammable and, when combined with oxygen in a cer-
tain ratio (for example the oxygen in the air), a highly explosive fuel. Due to that fact,
there must be taken measures to ensure that there is no hydrogen leaking. A 100%
guaranty is barely viable, which is why the entire fuel system has to be covered with an
additional layer. Underneath that layer will be no ignition power big enough to possibly
ignite any released H2. The same safety measure must be ensured at the ground fuel
supply system. Another point of concern was the positioning of the hydrogen tanks.
They are intentionally not placed near the bottom of the fuselage to consider a balked
landing or ditching.
• WTE Failure: a WTE failure happening during flare or approach will be one of the
most crucial safety risks around the key features of Xargo. There will be just a short
time to counteract the sudden roll- and gear moment that Xargo will experience in that
kind of situation. This is as a great challenge for the flying-computers, engine controlls
as well as for the position sensors to react quick enough with reducing the power of the
operating WTE.
246 Conclusion and Outlook
6 Conclusion and Outlook
Xargo fulfils all requirements were set. The modular structure allows a quick conversion
between a passenger setup to a frighter. Table 12 summarizes how Xargo complies with the
requirements.
Threshold Goal Xargo Design Feature
passengers 9 - 9 -
payload 2,000 lbs - 2,000 lbs -
conversion time 60 min - 60 min swiveling nose section
between passenger and modular cabin
and freight mission and cockpit design
maximum range (no 200 NM 500 NM 450 NM compressed H2
reserves)
divert range 50 NM 100 NM 100 NM -
takeoff and landing 1000 ft 250 ft 463 ft / 915 ft tiltable WTE
distance (35 ft (mean sea level,
obstacle clearance) standard temp.)
acoustic level 80 dB(A) 65 dB(A) 80 dB(A) -
DOC - 0 0.72 fuel cell powered and
$/NM/PAX electrically driven
engines
turnarounds - - 10 -
(passenger mission)
turnarounds (cargo - - 6 -
mission)
Table 12: Compliance with Requirements
Although Xargo is already a well-conceived concept, there still is room for improvement
and further adjustments.
Turnaround time can easily be reduced by using more than one module (passenger cabin
or cargo platform). While one module is flying with Xargo to the destination, two others
could be dispatched at the airfields.
There are some potentials for Xargo 2nd generation to increase efficiency. The hydrogen
storage in the back of Xargo could be conducted as module as well, so there would no
unnecessary storage weight (364 kg) that must be carried through flight.
Another advancement can be done to optimize the propeller folding geometry. During
cruise the propeller could be folding in a special way, so that they are extending the wingtip
to create the effect as a winglet. This will increase aerodynamic efficiency of the wing and
reduce required fuel.
Another way to lower fuel costs is possible, if an additional water storage will take place
in Xargo. The water which is produces by the fuel cells during climb and cruise could be
stored. During descent when potential energy is transferred to kinetic energy, some of this
transfer could be used to split the stored water back into fuel (hydrogen) and oxygen by one
fuel cell.
25You can also read