XSI - Xeneta Shipping Index July 2021
←
→
Page content transcription
If your browser does not render page correctly, please read the page content below
XSI® - Xeneta Shipping Index July 2021
XSI® - July 2021

XSI® - Global

The global XSI® skyrocketed by 28.1% in July to 200.42 points, yet another all-time high for the
index. The month-on-month jump blew the previous largest increase out of the water (11.3%)
and has resulted in the benchmark being 78.2% higher than the equivalent period of 2020.
Since the end of 2020, the index has appreciated by 76.4%.

With freight rates across major trends remaining at elevated levels and with no end in sight,
reports suggest more than 300 vessels were ordered in the first six months of the year, with
further orders on the horizon from several big names. This could include a first for Yang Ming,
which is understood to be mulling 24,000 TEU vessels.

While there is no question that demand is currently exceeding supply, carriers must be
acutely aware that by the time these new behemoths are delivered, fundamentals could be
very different. Time will tell as to whether history will repeat itself and the market goes from
boom to bust or if higher freight rates are here to stay.

                                        Fig 1: XSI® - Global

        XSI® - Xeneta Shipping Index                                                      July 2021
XSI® - Europe Imports / Exports
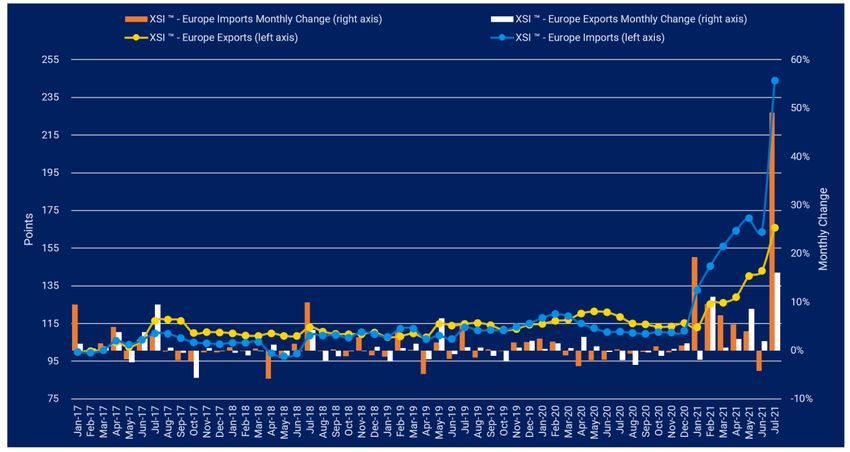
European imports on the XSI® jumped by a massive 49.1% in July to 243.96 points. This
represents by far the largest month-on-month increases on record and takes the benchmark
to an all-time high well above previously recorded levels. The huge spike follows on from
continued rate increases in the spot market that have led to FAK rates surpassing $13k FEU.
Compared to the same period of 2020 the benchmark is up 120.3% and it has risen by 119.3%
since the end of last year. Meanwhile, exports increased by 16.0% in July to 165.81 points. While
less dramatic than on the import trade, this still represents the single largest monthly
increase since the inception of the XSI® Compared to the same period last year, the index is
up 39.8% and has risen by 43.9% since Dec-20.
With vessel reliability flagging and exceptionally high freight rates, we previously reported on
various shippers taking matters into their own hands, including XSTAFF and most recently
Home Depot on the US trades. Now it appears, buoyed by sky-high rates, Wan Hai may re-
enter the European trades. The Taiwanese carrier was forced to drop the Far East - Europe
route back in 2010 due to its smaller ships being uneconomical compared to the competition.
However low freight rates are no longer a barrier to entry, meaning the deployment of
smaller, less cost-effective vessels may now be a viable option. The added flexibility these
smaller containerships provide also means Wan Hai could easily redeploy its ships should
market conditions change, a luxury that is likely to be unavailable to the competition relying
on ultra-large vessels.
Fig 2: XSI® - Europe Imports / Exports
XSI® - Xeneta Shipping Index July 2021XSI® - Far East Imports / Exports
Far East imports on the XSI® increased by 7.3% month-on-month in July to 144.26. This
represents the fourth straight monthly increase and ensures the index is now up 43.2% year-
on-year, while it is 49.6% higher than in Dec-20.
Far East exports recorded an even larger jump this month, rising by 24.2% to 250.30. Like many
other trades, this is the largest monthly increase on record, taking the benchmark to levels
that are 110.4% higher than in Jul-20 and 98.2% higher than at the end of last year.
In a slice of good fortune, Evergreen has been defending its decision to order a dozen 24,000
TEU vessels back in 2019 when lower freight rates posed some to question the timing of the
order. The carrier is confident the new ships can benefit from the recent spike in rates, with a
number of these vessels due to hit the water this year, contributing to an increase in the
carrier’s capacity of 18%. Meanwhile, it is understood that COSCO has entered into
agreements for the construction of 10 containerships, ranging from 14,092 TEU to 16,180 TEU.
Fig 3: XSI ® - Far East Imports / Exports
XSI® - Xeneta Shipping Index July 2021XSI® - US Imports / Exports
US imports on the XSI® jumped by 17.7% in July to 195.52 points. Representing another new all-
time high, the index is up 61.2% year-on-year and has risen by 60.0% since Dec-20. While
smaller, exports also recorded a month-on-month increase, with the XSI® jumping by 11.1% to
105.08. Monthly increases on the export index have been less dramatic and therefore the
benchmark is up by 12.0% compared to the equivalent period of 2020 and by 18.4% since the
end of last year.
With market fundamentals still in the carrier's favor, lines are putting further pressure on
shippers with the implementation of additional surcharges. One such example is a ‘value-
added surcharge’ being implemented by Hapag Lloyd as it seeks to add on an additional
$5,000 FEU onto its Far East - US trades. The German line attributed the decision to implement
the surcharge due to what it describes as extraordinary demand and operational challenges.
Fig 4: XSI ® - US Imports / Exports
XSI® - Xeneta Shipping Index July 2021XSI® Public Indices Report METHODOLOGY
• Rates delivered from freight forwarders and shippers
• Based on long-term contracts only = any contract that is valid for longer than
88 days
• Rates pulled from Xeneta’s ocean freight platform of +280m contracted rates
• Indices based on an aggregation of trade-weighted corridors
• Indices rates surcharges are based on all-in CY/CY pricing methodology
• Global index is a combination of worldwide trade-weighted corridors not
limited to US, Europe and Far East indices
Learn More About Xeneta
Learn more about Xeneta and get ocean freight visibility with a freight spend
analysis on your major trade lanes. Find out where you can optimize your freight
procurement strategy and stay one step ahead of the market no matter the current
rate and capacity conditions. Contact Us Here.
DISCLAIMER
The monthly XSI® Public Indices report gives an indication of the global market movements for the long-term contract
market in the container shipping industry focusing on the biggest regions in the world.
Xeneta does not recommend price setting on this market report as it is based on an aggregation of trade-weighted
uncorrelated corridors. If you are interested in index-based contracting, we recommend our XSI® index-linked
contracting product. For more information, please contact us via www.xeneta.com.
XSI® - Xeneta Shipping Index July 2021Xeneta is the leading ocean and air freight rate benchmarking, market analytics platform
and ocean container rate index, Xeneta Shipping Index (XSI®). Xeneta’s powerful reporting
and analytics platform and data density provides liner-shipping stakeholders the insights
they need to understand current and historical market behavior – reporting live on market
average and low/high movements for both short and long-term contracts. Xeneta’s data is
comprised of over 280 million contracted container rates and covers over 160,000 global
trade routes. Xeneta is a privately held company with headquarters in Oslo, Norway and
regional offices in New York and Hamburg. To learn more, please visit www.xeneta.com.
NOTE: The XSI® public indices reports are based on long-term contracts only.
© 2021 Xeneta AS
XSI® - Xeneta Shipping Index July 2021You can also read