YEAR IN SPORTS MEDIA REPORT 2016 - 2016 NIELSEN SPORTS REPORT
←
→
Page content transcription
If your browser does not render page correctly, please read the page content below
YE AR IN
                             SPORTS
                             MEDIA
                             REPORT
                             2016

2016 NIELSEN SPORTS REPORT
YE AR IN
                                                                            game in 25 years and had an audience 71% greater than Game 7 of
                                                                            the World Series in 2014.

    SP O RT S
                                                                            In Rio this summer, Team USA enjoyed another dominating Olympics
                                                                            in the pool, at the track and on the gymnastics floor, winning
                                                                            an astounding 121 medals. NBC treated Olympics fans to an

    M ED I A
                                                                            incredible 6,755 hours of content, including 2,084 hours on linear
                                                                            television and over 4,500 hours streamed digitally. Although the
                                                                            average primetime audience was down versus the London 2012
                                                                            Games, close to 80% of U.S. TV homes tuned in to the Rio Games,

    R EP O RT 2016                                                          as it reached 198 million viewers on TV alone.

                                                                            It was also a busy summer on the pitch, as Leicester City completed
                                                                            the seemingly impossible, overcoming 5,000-to-1 odds to win
                                                                            the Premier League. While Leicester City was the club that stole
                               STEPHEN MASTER                               many of the headlines, Cristiano Ronaldo and Lionel Messi
                               Regional Head of Revenue                     continued to cement their legacies as superstars. Each player led
                               Nielsen Sports                               his respective country to the finals of the 2016 Euros and the Copa
                                                                            America Centenario. U.S. soccer fans tuned in at a high rate, as the
                                                                            Euros final drew 5.3 million average viewers and the Copa America
                                                                            8.7 million, up 593% from the Copa America Final in 2015. In
    Welcome to Nielsen’s Year in Sports Media 2016 Report, a compila-       addition, Ronaldo and Messi continued to grow their personal
    tion of media highlights, advertising and sponsorship trends and        brands and enjoyed high levels of marketability, as they share the
    consumer insights across leading sports properties. This year,          highest N-Score (67) among active male soccer players.
    Nielsen Sports’ “FANALYTICS” platform – what we refer to as the
    collective intelligence and insights around sports consumers –
    continued to evolve. With the addition of Repucom and Pointlogic’s
    solution portfolios, we are now even better positioned to help our
                                                                            “D ESPITE THE PROLIFERATION
    clients gain a deeper understanding of the sports fan.                    OF DEVICES AND
    In many respects, 2016 was a challenging year off the field, as we
                                                                              UNPRECEDENTED MEDIA
    lost some of the most iconic legends in the sports world, including       FRAGMENTATION,
    Arnold Palmer, Muhammad Ali, Pat Summitt and Gordie Howe.
    Additionally, we endured a challenging political season that              SPORTS PROGRAMMING
    garnered many headlines, including Brexit and the U.S. presidential       CONTINUES TO THRIVE...”
    election. And yet, despite all of the tumult, when we turned to
    sports for salvation (or escape), sports delivered some of the finest
    moments and most indelible images of 2016.                              Stephen Curry won the MVP award in a unanimous vote while
                                                                            leading the Golden State Warriors to the best record (73 – 9)
    UNQUESTIONABLY, THE MOST HISTORIC EVENT OF 2016 WAS                     in NBA history. However, the 2015-16 season will be most remem-
    SOMETHING ALMOST NO ONE ALIVE HAD WITNESSED BEFORE:                     bered for LeBron James’ heroics in the Finals, as he helped
    In a thrilling series, which saw a meeting between two franchises       Cleveland finally end its 52-year championship drought. In a
    that hadn’t won a World Series in a combined 168 years, the             rematch of the prior year’s Finals, the Cavaliers–Warriors sequel
    Chicago Cubs and Cleveland Indians stepped up to the plate to           was even better than the original, as close to 31 million viewers
    deliver a true Fall Classic. Despite trailing three games to one, the   tuned in to Game 7. In fact, the 2016 series was the most-watched
    Cubs rallied to break the curse. An average of over 40 million          NBA Finals since Michael Jordan’s Bulls won their last champion-
    viewers tuned in to watch an epic Game 7, in what will certainly be     ship 18 years earlier. While James’ marketability suffered a hit
    remembered as one of the most iconic games in MLB history. The          when he first took his talents to South Beach, it has soared since
    Cubs’ run to their first championship in 108 years captured the         he’s returned to his hometown. His current N-Score of 78 is the
    imagination of the country, as Game 7 was the most-watched MLB          highest in the NBA.

2                                                                                                       YEAR IN SPORTS MEDIA REPORT 2016
Led by rookies Dak Prescott and Ezekiel Elliott, the resurgence of the
Dallas Cowboys was the biggest storyline of the NFL regular season.         CONTENTS
The NFL’s TV ratings challenges also drew headlines, but perhaps
the league just needed to put the Cowboys in the national TV window
every week, as they proved once again to be “America’s Team.”
Dallas played in four of the top five most-watched games this season,         TRENDS                04
including their Thanksgiving game (35.1 million viewers), which was
the most viewed NFL regular-season game in FOX’s history. The                 OLYMPICS              08
Cowboys’ thrilling playoff game against the Packers drew 45 million
viewers, and was the most-watched divisional playoff game in NFL
history. However, with the Cowboys’ early exit in the playoffs,               NFL                   10
Tom Brady and the Patriots became yet again the focus of the NFL
postseason, as Brady deflated the Falcons with an epic comeback
seen by an average audience of 111.3 million viewers.                         NBA                   12

The college football season reaped the benefits of having some
traditional football powers enjoy a resurgence, including Michigan,           MLB                   14
USC and Penn State. Like the NBA, college football fans were
given a rematch in the championship, as Alabama and Clemson
squared off. Part II of this rivalry proved even more dramatic, as            NHL                   16
Deshaun Watson secured the Tigers’ first championship in 35 years
on the final play. Although the 25 million viewers for the 2016
championship game was down slightly from the prior year (-3%),                SOCCER                18
college football fans still seemed to enjoy tuning in for bowl
season, as the New Year’s Six bowls averaged over 13 million viewers
per game, up 13% from last season.                                            GOLF                  20

If sports in 2016 taught us anything, it’s that despite the proliferation
of devices and unprecedented media fragmentation, sports                      UFC                   22
programming continues to thrive. As connectivity rises, connections
suffer, but sports provide an ideal vehicle for brands to integrate
with content and reach passionate consumers. More than 8,000                  NCAA BASKETBALL       24
parent brands were tracked in Nielsen’s North American Sport24
syndicated sponsorship media valuation database, garnering
$7.4 billion in QI Media value. Gatorade led all brands tracked               NCAA FOOTBALL         26
in Sport24, with a presence across every major league and an
amazing 53% of its exposure value coming from NFL game broad-
                                                                              NASCAR                28
casts. State Farm received the second-highest QI Media Value,
with 75% of it coming from NBA broadcasts.

                                                                              INDYCAR               30
I hope you enjoy these highlights from across Nielsen’s wealth of
consumer and media insights. 2016 continued to prove that sports
content across all media platforms continues to flourish and
                                                                              BOXING                31
prosper!

                                                                              SOURCING              32

Stephen Master
stephen.master@nielsen.com

Copyright © 2017 The Nielsen Company                                                            3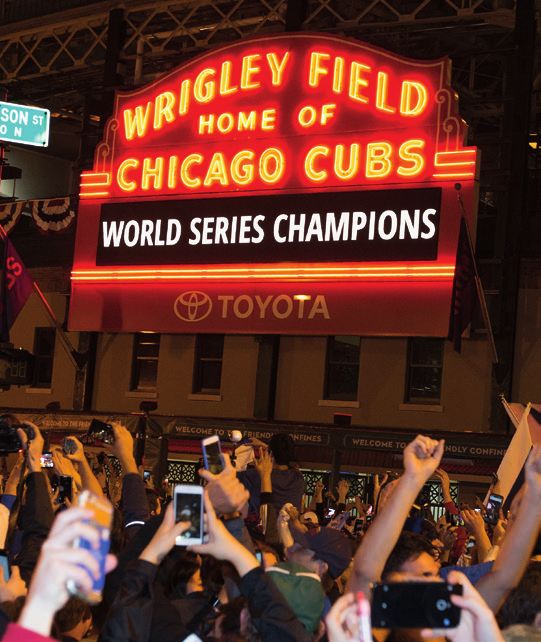
THE SCIENCE BEHIND WHAT’S NEXT
    Nielsen Sports is committed to placing a greater emphasis on            media companies and the athletes themselves to more effectively
    understanding the science behind “what’s next,” as it relates to        engage fans. As Nielsen Sports’ “FANALYTICS” platform
    measuring fans’ consumption behavior, monetizing content                continues to grow, we have highlighted five key commercial trends
    across platforms and creating deeper partnerships across the            that shaped the North American sports marketing landscape
    sports ecosystem. Rapidly evolving technology and access to             in 2016 that we will be closely watching in 2017.
    increasingly sophisticated fan data is allowing properties, brands,

                    1. ESPORTS HAVE EVOLVED FROM NICHE TO MAINSTREAM

                     THE U.S. ESPORTS                       The world of competitive gaming dramatically expanded its U.S. footprint in 2016
                     FAN BASE GREW TO                       with an unprecedented level of investment and enormous growth in interest and

                     45.3
                                                            fans. The 2016 Nielsen eSports Report shows that the U.S. eSports’ fan base grew
                                                            to 45.3 million people, compared to 25.7 million in 2015 (+76%). Almost 24%, or
                                                            10.9 million eSports enthusiasts, consider themselves avid eSports fans and
                     MILLION PEOPLE                         engage with the sport at least 5 hours per month. Not surprisingly, 83% of the
                     compared with 25.7 million in 2015     avid eSports fans are male, and 78% of them are between the ages of 13 – 34.

    SPONSORSHIP INVESTMENT             ESPORTS ON CAMPUS                    ESPORTS SHOWS                      NEW SOURCE OF CONTENT/
    FROM BLUE CHIP BRANDS                                                   CROSSOVER APPEAL                   PROGRAMMING FOR
                                       Michigan vs. Ohio State has
                                                                                                               TRADITIONAL MEDIA
    The 2016 Nielsen eSports           been considered the biggest          There is a great deal of overlap
    Report shows that almost 60%       rivalry on the football field, but   between fan bases, as NBA          While Twitch is the platform
    of avid eSports fans have a        it will be interesting to see        fans are 114% more likely than     of choice for fans to engage
    household income of over           how their rivalry plays out in       the general population to be       with eSports content, other
    $50,000, and 85% of eSports        the eSports arena. Collegiate        eSports fans. This means that      more “traditional” media
    fans 21+ have attended college.    eSports are receiving large          while the Miami Heat tip off       companies have successfully
    Coupling the facts that avid       financial investments and            against the Philadelphia 76ers,    jumped into the fray, giving
    eSports fans are predominately     resources from major college         it is possible that plenty of      eSports a broader platform to
    young males who are highly edu-    conferences, including the Big       fans will be engaged in another    reach new fans. In 2016, Turner
    cated and have high disposable     10 and Pac-12. This makes sense      matchup between the Misfits        Sports partnered with WME-
    incomes has resulted in the        given the fact that the college      and Team Dignitas, who are         IMG to form ELeague, whose
    sport attracting significant       age demo, persons 18–34,             owned by each NBA franchise        top telecast saw 402,000
    investment from non-endemic,       makes up 33% (3.6 million) of        respectively. Investment           viewers on November 18, 2016.
    blue-chip brands including         avid eSports fans. Top players       in eSports teams by other          ESPN also launched a dedicated
    Coke, Audi and Anheuser-Busch.     are receiving college scholar-       traditional team sports owners     eSports vertical earlier this year.
                                       ships, and through partnerships      and former athletes is a trend     The network’s efforts to cover
                                       with game publishers, college        that will continue to strengthen   it like any other traditional sport
                                       conferences are creating season-     the business of eSports.           has paid off, as 20% of fans
                                       long and conference champion-        These investors will bring         consider it a “go-to source” for
                                       ship competitions. All of these      their expertise in sponsorship,    eSports news.
                                       events will be broadcast on          media, merchandising
                                       linear TV and streamed digitally.    and ticket sales to the eSports
                                                                            ecosystem.

4                                                                                                       YEAR IN SPORTS MEDIA REPORT 2016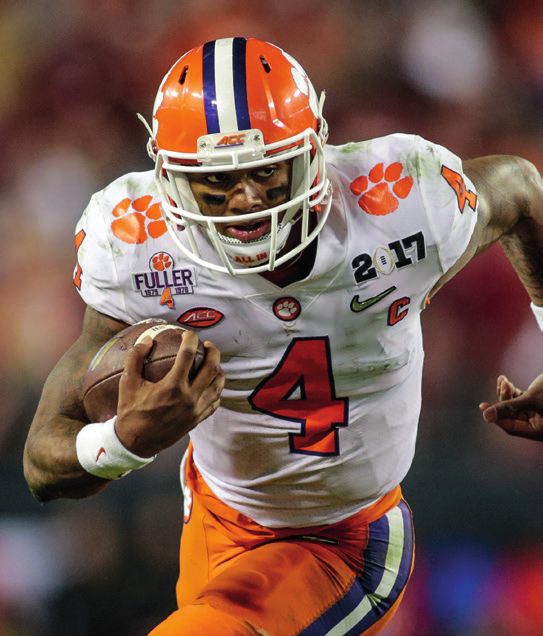
2. RICHER, DEEPER PARTNERSHIPS
              ACROSS THE SPORTS ECOSYSTEM BUILT AROUND CONTENT

When Kevin Durant decided to leave the Oklahoma City Thunder
                                                                               AVERAGE SPONSORSHIP VALUE PER POST
to join the Golden State Warriors, he personally explained his
decision to fans through the Players’ Tribune. The proliferation of
new sites and technologies has allowed athletes to control their
message and engage with their fans directly. Athletes are also                                                               $421
using social media to build and monetize their personal brands by                                                            TWITTER
curating content and organically integrating sponsorship and
                                                                                                         $2,108
endorsement messages.                                                           $2,723                   FACEBOOK
                                                                                INSTAGRAM
TEAMS AND BRANDS LEVERAGE SOCIAL MEDIA
Teams and leagues are becoming more effective at leveraging               THE FUSION OF ENTERTAINMENT AND SPORTS
their large social media followings to deepen their partnerships          Many brands have also benefited from the crossover of entertain-
with brands. Nielsen Sports did an in-depth analysis across               ment and sports. While iconic music acts have been playing
U.S. leagues and teams, which showed that the top 20 most                 at the Super Bowl and other major sporting events for a long time,
active sponsors earned an aggregate of $2.5 to $3 million dollars         sponsors have become more effective with marketing channels
of media value per team over the course of the season through             such as social media to integrate and wrap their brands around
controlled social media accounts. While Facebook is the top               content. This is reflected in the engagement from fans. The ten
valued platform due to its large follower base, Instagram proves          most-watched minutes of Super Bowl 50 were the Pepsi Halftime
to be the most efficient platform in driving sponsorship value.           Show. In addition, #pepsihalftime ranked in the top 10 hashtags
Twitter shows the lowest value, which is primarily due to the quick       used on Twitter in conversation surrounding the game. This
refresh of content that prohibits large impression numbers.               hashtag was included in three times as many Tweets as #forma-
                                                                          tion, the title of Beyonce’s song premiered during the show.

                   AVERAGE AUDIENCE MINUTE-BY-MINUTE RATING DURING SUPER BOWL 50

   P2+                 45
                                                                                                                 We can see ratings drop
   F2+
                                                                                                                 immediately after the first
                      40                                                                                         half ends, and then come
                                                                                                                 back to a peak during the
                                                                                                                 halftime show, particularly
                       35
                                                                                                                 for females.

                       30

    AA RATING %        25

TEAMS FORM DEEPER RELATIONSHIPS THROUGH                                   the Stars” event. This allowed fans to engage with the team and
EXCLUSIVE CONTENT                                                         its new recruits in a more unique and creative way. The program
Sports properties are also showcasing behind-the-scenes action            integrated its sponsors and raised significant dollars and awareness
and events beyond their core games to form deeper relationships           for the ChadTough Foundation. This type of direct, unfiltered
with fans. In lieu of just posting the recruiting class on its website,   communication is forming deeper relationships off the playing
or sending out a press release, Michigan football coach Jim               field throughout the sports ecosystem.
Harbaugh aligned with the Players’ Tribune to create a “Signing of

Copyright © 2017 The Nielsen Company                                                                                                             5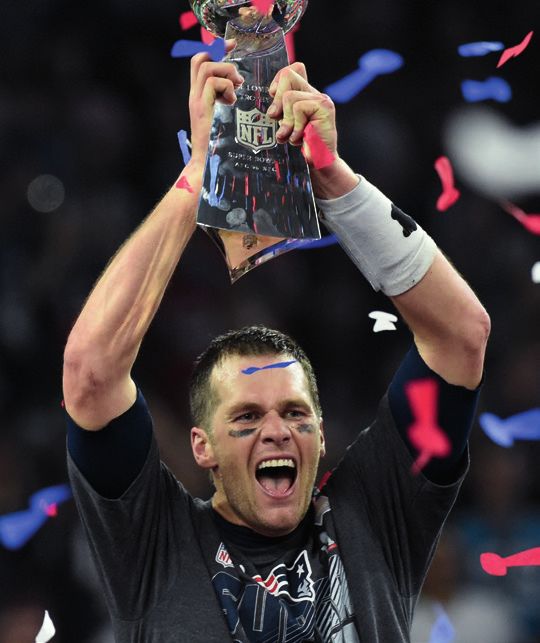
3. OT T, SOCIAL MEDIA AND OUT-OF-HOME VIEWING
                              CREATING A TRULY OMNICHANNEL ENVIRONMENT

    Device proliferation, media fragmentation and evolving consumer               smartphones (app/web) or tablets (app/web) has increased
    habits are rapidly transforming the media business. And although it           substantially.
    is more complex, overall media consumption across devices grew
    13% in 2016.                                                                  Declines in live TV usage among U.S. adults display signs of
                                                                                  slowing. According to the 2016 Nielsen Total Audience Report for
    MEASURING CONSUMPTION AND                                                     Q3, U.S. adults spent an average of 4 hours and 6 minutes tuning
    THE TOTAL AUDIENCE ACROSS EVERY DEVICE                                        into live TV per day, about 1 minute less than in Q3 2015, and about
    Fans are still engaging with sports in large numbers, but technology          7 minutes less than in Q3 2014. Meanwhile, time spent on PCs,
    has enabled them to step out of their living room and consume                 smartphones or tablets has increased substantially (+45%). The
    content in new ways. While time spent watching live television is             one medium that has remained steady is radio, as it still accounts
    down across all demos except P50+, time spent on PCs (internet),              for a significant portion of the total media consumption.

                                                    AVERAGE TIME SPENT PER ADULT 18+ PER DAY

                                                                                                     0:16
        LIVE TV                                                                         0:29       0:07 0:57                  0:27
        DVR/TIME-SHIFTED TV                                  Q3 2016                 4:06       1:52                2:10
        AM/FM RADIO
                                                                                                       0:13
        DVD/BLU-RAY DEVICE                                                                             0:13
                                                                                        0:28               0:51        0:23
        GAME CONSOLE
                                                             Q3 2015                 4:07       1:50            1:14
        MULTIMEDIA DEVICE
                                                                                                 0:08 0:10
        INTERNET ON PC

        APP/WEB ON SMARTPHONE                                                           0:28             0:47      0:20

        APP/WEB ON TABLET                                    Q3 2014                 4:13       1:52

                                                                                                 0:09 0:05             0:58
    Panel enhancements made in March and August 2016 impacted mobile reporting.                     0:11

    MILLENNIALS HAVE OFFICIALLY BECOME                                            their smartphone as a second screen, 25% of them are looking up
    THE MOBILE-FIRST GENERATION                                                   information about athletes, teams, actors or plotlines.
    According to the 2016 Nielsen Total Audience Report for Q3, on
    average, U.S. adults ages 18-24 spent over 57 hours per week                  OUT-OF-HOME DELIVERS SIGNIFICANT
    consuming media. Over 20 hours (35.6%) of their media time was                INCREMENTAL VIEWERS
    spent on their smartphones, while 15.5 hours (27.1%) was spent                As fans continue to gather with friends to watch their favorite teams
    watching TV. This was the first year that consumption on mobile               play in the big games at bars or parties, Nielsen is capturing and
    devices surpassed television across any demo. These consumption               measuring fans’ out-of-home viewing to ensure the total audience
    patterns will have many implications for the sports marketing                 across screens is being counted. Many fans, particularly those
    industry moving forward, as leagues, teams and brands try to                  18–34, chose to watch the epic seven-game showdown between
    engage their younger fans. Smartphones are also being used as a               the Cavaliers and the Warriors outside of their home. ABC received
    “second screen,” with 30% of consumers using their smartphone                 a 17% lift in average P6+ viewership across the seven games of the
    several times a day while watching TV. Of those consumers using               NBA finals. This lift jumped to 25% among those 18–34.

6                                                                                                                 YEAR IN SPORTS MEDIA REPORT 2016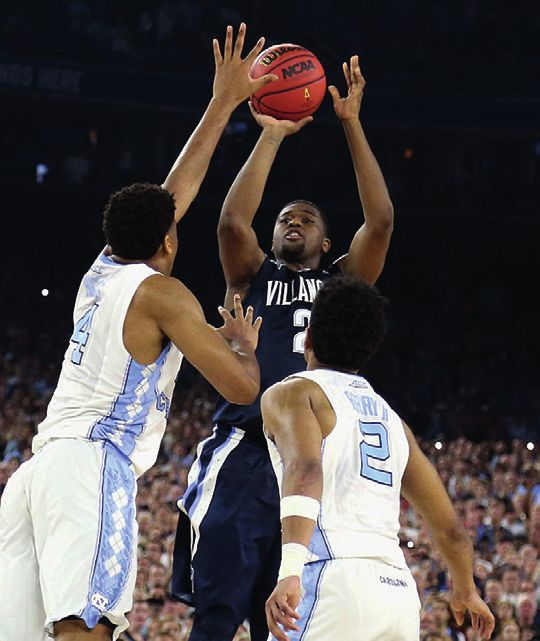
4. EDGING CLOSER TO CRACKING THE CODE ON ROI

                                                            Despite the high stakes and investment in sponsorship marketing, precise
  MEASURING SPONSORSHIP IMPACT
                                                            measurement and attribution for sports sponsorship ROI remains elusive.
                                                            However, using enhanced technology, sophisticated modeling and detailed
           PRIOR TO SPONSORSHIP                             fan behavioral and purchase data, Nielsen is leading the way in helping the
                                                            industry crack the code on ROI.
                       2011
                95 Penetration Index
                                                            UNDERSTANDING THE VALUE AND IMPACT OF A SPONSORSHIP INVESTMENT
             In 2011, fans of this MLB team                 One critical piece of measuring a brand’s sponsorship impact is understanding
               were 5% less likely than the                 whether the investment drove incremental sales among fans of that property. Linking
                average household in their                  sports media consumption, valuation data and consumer purchase information,
              market to purchase a product
                                                            Nielsen works with properties/brands to evaluate the return on sports marketing
                  from this spirits brand
                                                            investments. A recent Nielsen study was focused on helping an MLB club and its
                                                            spirits sponsor understand the value of the investment. The study showed the
                                                            proportion of MLB fans of this club purchasing the sponsor spirits brands increased
                                                            significantly over the five years of the partnership, indicating growth in penetration
                                                            development among that team’s fans and the success of the campaign.

             AFTER SPONSORSHIP
                                                            OPTIMIZING MEDIA SPEND TO DRIVE TUNE-IN
                       2016                                 Media fragmentation and the proliferation of devices are making it increasingly
                103 Penetration Index                       challenging for sports properties and media companies to understand the mix of
                                                            marketing activities and channels that drive engagement and viewership. By
            In 2016, fans of this MLB team
                                                            matching Nielsen TV viewership and purchase data with the client’s proprietary
             were 3% more likely than the
               average household in their                   CRM behavior data, Nielsen Pointlogic is able to build advanced viewing models
             market to purchase a product                   that optimize our clients’ cross-platform campaigns and maximize viewership
                 from this spirits brand.                   for upcoming games.

                      5. DATA BECOMING DRIVING FORCE IN OPTIMIZING
                       FAN REL ATIONSHIPS AND MAXIMIZING REVENUE

It is critical for sports properties to tailor messaging that will          DATA SEGMENTATION — LINKING TO MARKETING CLOUD
resonate most with fans in order to optimize the relationship.              The future of fan relationships will be characterized by a more
                                                                            direct and customized interaction, which is based on data-driven
DATA COLLECTION — BUILDING THE FAN COUNCIL                                  solutions. Building distinct fan segments that link to the Nielsen
In partnership with Vision Critical, Nielsen works with leagues and         Marketing Cloud allows teams to build a deep profile of each
teams to build online communities and strengthen their relation-            segment, including media consumption, social media activity and
ships with fans. The development of fan councils allows sports              offline purchase behaviors.
properties to recruit fans from their databases, and with a lens on
specific segments, the property can engage with thousands                   DATA APPLICATION — DRIVING PERSONALIZED APPROACH
of highly profiled fans. Through better use of technology and the           Teams that effectively get a holistic understanding of each segment
creation of mobile apps, properties are able to collect enormous            profile will be able to develop a more personalized marketing
amounts of data and insights about their fans that were previously          approach that resonates with fans. Most importantly, they will
unavailable.                                                                enhance overall fan satisfaction and more effectively monetize
                                                                            their fan base.

Copyright © 2017 The Nielsen Company                                                                                                                 7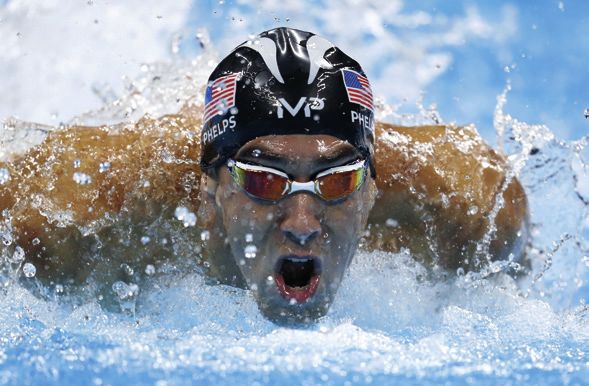
THE OLYMPICS

                    Despite trepidation and negative news surrounding
            Rio’s preparation for the 2016 Summer Olympic Games,
            the city offered a spectacular setting and events went off
            without a hitch. This is unless you count Ryan Lochte’s
            mess of his own making.

            Not only was Rio 2016 a success on the ground, but it was
            also the biggest television event of the summer, captivating
            audiences for two weeks and reaching about 198 million
            unique viewers across nine television networks. The Olympics
            offered audiences an amazing opportunity to come together
            with 200+ countries and cheer for the athletes on Team USA
            and the incredible talent across the globe.                           ichael Phelps and Team USA earn a gold medal in the
                                                                                 M
                                                                                 4 x100m medley relay.

    SWIMMING LAPS THE FIELD                                                                     TOP 5 ANTICIPATED EVENTS

    The top-rated telecasts reflect the most-anticipated events among Summer
                                                                                       1    SWIMMING
    Olympics fans, according to Nielsen’s Sports360 research report. Rio’s biggest
    night was August 9, when an average U.S. audience of 33 million watched the        2    GYMNASTICS (ARTISTIC & RHYTHMIC )
    broadcast featuring Michael Phelps winning gold medals 20 and 21, and the
    U.S. women’s gymnastics team winning gold in a dominating performance over
                                                                                       3    DIVING

    Russia. When looking across various demographic groups, this list of events        4    TRACK & FIELD
    shifts. Boxing, fencing and tennis become some of the most anticipated
    events among Hispanics, Asian Americans and African Americans, respectively.       5    VOLLEYBALL

    BOLT LEADS TWITTER BUZZ                                                MEN’S 100M TRACK & FIELD FINAL (PM)

    For key events during the Rio 2016 Games, TV viewer-
    ship and social chatter would peak together as fans        USAIN BOLT GOLD MEDAL                   TWEETS           P2+ AA PROJ (000)
    watched the events unfold. The effect was even more
    dramatic for those most newsworthy events, such as
                                                                14,000                                                                      40,000
    the Men’s 100m Track & Field Final on August 14, when                                                                                   35,000
                                                                12,000
    Usain Bolt became the first athlete to win three gold                                                                                   30,000
                                                                10,000
    medals in this event.                                                                                                                   25,000
                                                                8,000
                                                                                                                                            20,000
                                                                6,000
    There were nearly 14,000 Tweets the minute following                                                                                    15,000
                                                                4,000
    his race at 9:28pm, while the average TV audience                                                                                       10,000
                                                                2,000
    jumped to 38.4 million viewers. For comparison,                                                                                         5,000
    the entire primetime broadcast had an average of
    26.8 million viewers.                                          09:15      09:20     09:25       09:30       09:35      09:40         09:45

8                                                                                                      YEAR IN SPORTS MEDIA REPORT 2016
ENGAGEMENT WITH OLYMPIC ATHLETES RINGS STRONGER
Olympic athletes are perceived to have something more authentic                                          The remarkable stories and successes of both Katie Ledecky and
and genuine about them than athletes in professional sports                                              Simone Biles won over the American public. The Nielsen N-Scores
leagues. Their backstories are almost as important as their talent                                       for both women elevates them to professional athlete stars like
and presence at the games, which bodes well for the success of the                                       Serena Williams (N-Score 82) and LeBron James (N-Score 78).
Olympic Channel. According to Nielsen’s Sports360 research                                               On the other hand, Ryan Lochte’s false report of events caused
report, 42% of avid Olympic fans are aware of who is competing in                                        a sharp increase in his N-Score for offensive to 39, which surpasses
specific events prior to the Olympics, and 49% are more likely to                                        the average athlete and even beats the offensive scores for
cheer for athletes when they know their personal history.                                                Floyd Mayweather and Draymond Green.

                                                                        NIELSEN TALENT ANALY TICS

                                                                      KATIE                             SIMONE                              RYAN                           AVERAGE
                                                                     LEDECKY                             BILES                             LOCHTE                          ATHLETE

                 N-SCORE                                                 81                              86                                  48                                  60
            AWARENESS                                                   48                                62                                  61                                 27
             LIKEABILITY                                                 82                               83                                  28                                 59
             OFFENSIVE                                                    0                                 1                                 39                                 5
* Nielsen’s N-Score Talent Tracker quantifies a celebrity’s marketability, taking into account Awareness and Likeability, in addition to 10 other attributes such as:
   “Influential,” “Stylish” and “Social Media Savvy.” The weighted N-Score is on a scale of 1-100.

ADVERTISING GOLD                                                                                      AD PERFORMANCE COMPARISON

Fans of the Summer Olympics don’t
just pay attention to the competition and                                  D PERFORMANCE
                                                                          A                                                 +15%
                                                                          IN RIO OLYMPICS
athletes. They also take note of commer-
                                                                                                                                                   +25%
cials. When evaluating ad effectiveness, we                                                                              47%                                              +22%
                                                                           AME BRANDS IN
                                                                          S                                      41%
see that ad memorability and brand                                                                                                                                                        +25%
                                                                          BROADCAST/
memorability of ads within the Rio 2016                                   CABLE SPORTS                                                          30%
                                                                          PROGRAMMING                                                   24%                              22%
Olympics are about 15% and 25% more                                                                                                                            18%
effective than the average sports pro-
                                                                                                                                                                                 12% 15%
                                                                          CHANGE
gramming ad outside of the Olympics.                                                                               Ad                   Brand                 Message             Likeability
                                                                                                                Memorability          Memorability           Memorability

Copyright © 2017 The Nielsen Company                                                                                                                                                             9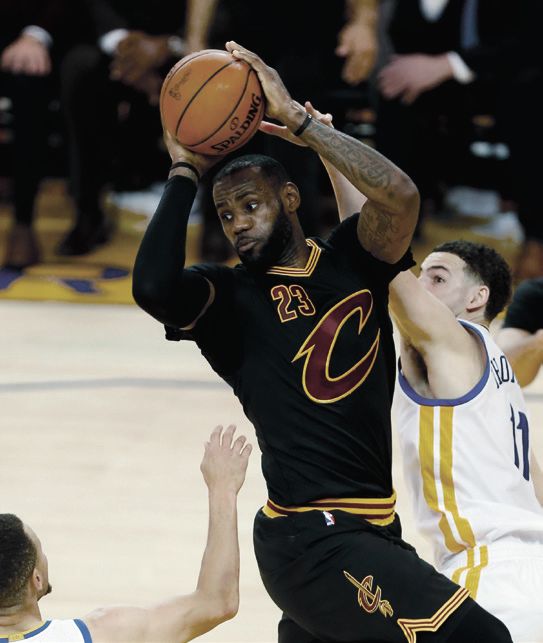
NFL

                      The NFL season ended in thrilling fashion, as Tom
              Brady led the New England Patriots to the greatest comeback
              victory in Super Bowl history. The improbable overtime win
              had an average audience of 111.3 million viewers, which was
              slightly down from the prior year due to viewers tuning out
              when the game was lopsided, as the Falcons led by as many
              as 25 points in the third quarter.

              Despite widespread media coverage citing concerns on
              ratings performance, the NFL maintained its foothold as the
              most-watched programming with 90 regular-season games
              having a unique reach of over 25 million viewers. There was a
              12% decrease in the number of average minutes viewed
              versus the prior year, as viewers diverted their time to news
              coverage leading up to the presidential election. Eight of the
              top 10 rated regular-season NFL games occurred after the
              2016 presidential election.

                                                                                                    om Brady celebrates after the New England Patriots’
                                                                                                   T
                                                                                                   victory over the Atlanta Falcons in Super Bowl LI.

                                                TIMELINE OF T V VIEWERSHIP HIGHLIGHTS

            AVERAGE # OF U.S. T V VIEWERS IN MILLIONS                                 SOCIAL T V INTERACTIONS IN MILLIONS

     THURSDAY NIGHT                       CHRISTMAS DAY                           NFC DIVISIONAL                          AFC CHAMPIONSHIP
        KICKOFF                            Denver Broncos vs.                        PLAYOFF                               Pittsburgh Steelers vs.
      Denver Broncos vs.                   Kansas City Chiefs                     Green Bay Packers vs.                    New England Patriots
      Carolina Panthers                                                              Dallas Cowboys
                                                 NBC                                                                                CBS
             NBC                                                                          FOX

                           THANKSGIVING                         NFC WILD CARD                        NFC CHAMPIONSHIP                            SUPER BOWL LI
                              CLASSIC                           New York Giants vs.                    Green Bay Packers vs.                  New England Patriots vs.
                      Washington Redskins vs.                   Green Bay Packers                         Atlanta Falcons                        Atlanta Falcons
                         Dallas Cowboys
                                                                       FOX                                     FOX                                     FOX
                               FOX

     2016   09/08              11/24             12/25      2017      01/08              01/15                 01/22               01/22              02/05

            25.2              35.1              21.4                 39.3                48.5                46.3                48.0                 111.3
              6.8                11.4               2.3                 13.8                52.9                24.3                 26.4                  190.8

10                                                                                                                     YEAR IN SPORTS MEDIA REPORT 2016
NFL DOMINATES FIRST AND SECOND SCREENS
The NFL owns Sundays on both television and social media. In hand, conversation on social media reached its highest point when
fact, from September to November, 43% of weekly activity (related the Patriots won in overtime, as 7.5 million interactions occurred
to TV programs) on Facebook and 33% on Twitter occurred on between 10:30pm and 10:34pm EST.
Sunday. Much of this social media activity can be attributed to NFL
games. Super Bowl LI was no different, as it generated 190.8 Throughout the game, the average TV audience would peak during
million interactions, with 175.5 million on Facebook and 15.2 million key moments, and the number of social interactions would soon
on Twitter. Advertisers leveraged these platforms to gain incremental follow. However, there were some instances when social media
reach. Airbnb and Coca-Cola tweeted their ads and received interactions would peak while the average audience was at a
14,000 and 9,000 retweets respectively, which ranked in the top relatively low point. This indicates that some viewers changed the
40 among most retweets during the game. channel during breaks in the action, but still used a second-screen
device to remain engaged with the game. This happened in the
The most viewed moment of the night was when 120.2 million moments following Lady Gaga’s performance and between the end
people watched Lady Gaga’s halftime performance. On the other of regulation and start of overtime.
SUPER BOWL LI: MINUTE BY MINUTE (PM)
P2+ AA PROJ TWEETS NEW ENGLAND TIES THE GAME, 28–28 OVERTIME
125M NEW ENGLAND CUTS 180K
HALFTIME SHOW THE LEAD 28–20
END OF THE FIRST HALF
ATLANTA TAKES
A 21–0 LEAD
ATLANTA TAKES
A 28–3 LEAD
100M 10K
06:30 07:00 07:30 08:00 08:30 09:00 09:30 10:00 10:30
TOP ADVERTISERS
THE NFL GOES HOLLYWOOD
Fans in St. Louis seem to be sticking with the Rams despite their relocation at the start of the Q4 2015 – Q3 2016
2016 season. In fact, when looking at the same six games that were aired in both LA and
St Louis, ratings in LA were only marginally higher than in St. Louis (9.7 versus 8.3). The Rams
averaged an 8.5 rating across all games in the LA market, which is the lowest home market
1 VERIZON WIRELESS
rating for an NFL team.
2 McDONALD’S
It remains to be seen if the Chargers’ relocation to LA will prove to be a success. The nine games
of the 2016 season that were shown in LA drew a 6.2 local TV rating, while the same games
3 DIREC TV
drew an average rating of 24.6 in San Diego.
4 APPLE i PHONE
Further, the Oakland Raiders’ TV ratings performance in the LA market came in at a 9.4, exceed-
ing both the Chargers and Rams ratings in LA, despite the Raiders exploring a move to Las Vegas. 5 FORD F-150 TRUCKS
Copyright © 2017 The Nielsen Company 11NBA
The Cleveland Cavaliers and Golden State Warriors
monopolized the NBA season for the second year in a row.
LeBron James finally led his home team to victory, as the
Cavaliers took home their first-ever NBA championship.
Averaging 31 million viewers nationally, the Cavaliers’ victory
over the Warriors ranked as the highest-rated NBA game
ever on ABC, up 10% over Game 7 of the 2010 NBA Finals,
which was previously the highest-rated NBA telecast on
ABC to date.
Meanwhile, Stephen Curry led the Warriors to a record-
breaking 73-win season. The game against the Memphis
Grizzlies that broke the record earned a local rating of 24.2
in the San Francisco market, making it the highest locally
rated regular-season game in team history. On the same day,
the league said goodbye to a legend, as Kobe Bryant played
his final game for the Los Angeles Lakers. His 60-point
performance dominated the conversation on Twitter, with
1.1 million unique authors posting a total of 4.6 million
Tweets about his final game. LeBron
James in action during Game 7 of
the NBA Finals.
TIMELINE OF T V VIEWERSHIP HIGHLIGHTS
AVERAGE # OF U.S. T V VIEWERS IN MILLIONS SOCIAL T V INTERACTIONS IN MILLIONS *Twitter only
NBA ALL-STAR GAME EASTERN NBA DRAFT
TNT, TBS
CONFERENCE FINALS ESPN
Cleveland Cavaliers vs.
WESTERN Toronto Raptors – NBA FINALS NBA
CONFERENCE FINALS 6 Games Cleveland Cavaliers vs. CHRISTMAS DAY
Golden State Warriors vs. ESPN Golden State Warriors – Cleveland Cavaliers vs.
Oklahoma City Thunder – 7 Games Golden State Warriors
7 Games
ABC ABC
TNT
02/14 05/16–30 05/17–27 06/02–19 06/23 12/25
7.6 9.9 5.6 20.2 2.9 10.1
1.4* 7.2* 2.2* 18.9* 1.5* 4.9
Tweets were added up across all events in the Western Conference Finals, Eastern Conference Finals and NBA Finals.
12 YEAR IN SPORTS MEDIA REPORT 2016GOLDEN STATE MAKES A MULTIMEDIA SPLASH
It should come as no surprise that the Golden State Warriors, engagement for the 2015–16 regular season. These three teams
Cleveland Cavaliers and Los Angeles Lakers take the top three were led by superstars who transcend basketball: Stephen Curry,
spots for overall media exposure across TV, online and social LeBron James and Kobe Bryant.
NBA MULTIMEDIA RANKING: TOP 10
TEAM LOCAL RSN NATIONAL SOCIAL WEBSITE APPEARANCE
RANKING RANKING RANKING RANKING RANKING
1 GOLDEN STATE WARRIORS 1 1 1 1 2
2 CLEVELAND CAVALIERS 2 2 3 6 1
3 LOS ANGELES LAKERS 17 8 2 2 8
4 OKLAHOMA CITY THUNDER 4 4 4 14 3
5 SAN ANTONIO SPURS 3 3 6 4 6
6 CHICAGO BULLS 8 5 5 7 4
7 LOS ANGELES CLIPPERS 24 6 9 10 5
8 HOUSTON ROCKETS 18 9 8 22 7
9 MIAMI HEAT 5 10 10 16 9
10 BOSTON CELTICS 10 16 13 3 12
ARE POWER TEAMS GOOD FOR THE NBA?
The Golden State Warriors and Cleveland Cavaliers continue to spark national interest and grow fan bases
beyond their regions. When matched up against the Warriors or Cavaliers, opposing teams’ local markets TOP ADVERTISERS
saw average lifts of 49% and 21%, respectively. For example, the Washington Wizards saw an average lift
of 191% in the Washington, DC, market when playing the Warriors, whereas the Houston Rockets saw an
average lift of 72% in the Houston market when playing the Cavaliers. 1 SAMSUNG
GALAXY S7 EDGE
2 TACO BELL
FAN BASE OUTSIDE OF HOME REGION
3 AMERICAN EXPRESS
HOW TO READ: IN 2016, 61% OF WARRIORS FANS WERE OUTSIDE OF THE WEST REGION
4 C ORONA EXTRA
61%
54%
47% 45% 5 D IRECTV
2014
36%
2015 27%
2016
GOLDEN STATE WARRIORS CLEVELAND CAVALIERS
Fan = Favorite Team Fan base Outside West Region Fan base Outside Midwest Region
Copyright © 2017 The Nielsen Company 13MLB
The 2016 World Series reached over 113 million viewers
across the seven games, as the national interest in this year’s
Fall Classic was high. The Chicago Cubs hadn’t won the title
since 1908, and last made it to the Series in 1945. The Indians
have only won two World Series championships – back
in 1920 and 1948 – and now have the longest current World
Series championship drought.
Not only was the 2016 series the most-watched World Series
since the Red Sox broke their curse in 2004, but the audience
was younger than in recent years. The average 18-to-34-year-
old audience for 2016 was 3.7 million, which was the highest
18–34 audience a series has seen since 2004. This younger
18–34 audience is also 76% higher than last year’s series
(2.1 million). This may have something to do with the young
talent on the field, who have national marketing appeal and
the potential to play deep into October for a number of years in
the future. This is positive news for the MLB, who is aggres-
sively trying to lower its average TV audience age and engage
with younger fans. Fans celebrate the Chicago Cubs World Series victory
over the Cleveland Indians outside of Wrigley Field.
TIMELINE OF T V VIEWERSHIP HIGHLIGHTS
AVERAGE # OF U.S. T V VIEWERS IN MILLIONS SOCIAL T V INTERACTIONS *Twitter only
MLB OPENING DAY AL WILD CARD GAME NLCS PLAYOFFS WORLD SERIES
Cardinals vs. Pirates, Blue Jays vs. Orioles Dodgers vs. Cubs – Indians vs. Cubs –
Blue Jays vs. Rays, 6 games 7 games
TBS
Mets vs. Royals
FS1 FOX
ESPN, ESPN2
MLB ALL-STAR NL WILD CARD ALCS PLAYOFFS
GAME GAME Blue Jays vs. Indians –
FOX Giants vs. Mets 5 games
ESPN TBS
04/03 07/12 10/04 10/05 10/15–22 10/14–19 10/25/–11/02
2.0 8.7 4.2 7.4 7.0 3.4 23.4
266K* 370K* 967K 3.7M 39.6M 6.7M 31.6M*
Tweets were added up across all events in the NLCS Playoffs, ALCS Playoffs and World Series.
14 YEAR IN SPORTS MEDIA REPORT 2016BREAKING THE CURSE
2016 was one of the most memorable World Series in recent these large ratings were coupled with large social TV interactions.
history, and not many were willing to miss the action. Across the Game 7 made up a shocking 77% of all Twitter TV interactions on
seven games, 113.7 million unique people were reached on TV, with November 2. Even MLB.com saw jumps in the 2016 postseason, as
the average viewer watching 300 minutes of the series. During the unique audience in October saw a 24% increase from 2015 to
the final game alone, people watched about 123 minutes on 2016 and a 66% year-over-year increase for the month of November.
average, or just under half of the 4.5-hour broadcast. Those who
were not able to watch the games could have caught the highlights This engagement was strongest among local fans, as viewership in
on ESPN SportsCenter. During the World Series, the Cubs and Chicago and Cleveland for Game 7 was incredible. Chicago roped in
Indians together made up 16.9% of all sports coverage on ESPN a 71% share, while Cleveland delivered a 69% share, meaning out of
SportsCenter. Both teams had their highest monthly volume of those with their TVs on in each market, 71% and 69% were tuning
coverage since Nielsen Sports started analyzing SportsCenter in 2012. into Game 7. Indians fans also clearly enjoy engaging with America’s
favorite pastime via radio. The Indians’ radio share was higher than
As the average U.S. adult spends almost a quarter of his or her weekly the Cubs’ during the regular season; a margin that substantially
media time on social media (22%), it comes as little surprise that increased in the postseason.
LOCAL MARKET AUDIENCE SHARE TOP ADVERTISERS
CLEVELAND REGULAR SEASON WORLD SERIES 1 T-MOBILE
CHICAGO
2 TACO BELL
62.4 58.3 58.0
TV Average
Household 3 DIRECTV
Audience Share % 12.3 11.7 10.3 31.4
19.5
Radio P6+ 4 GEICO
Audience Share %
5 CIALIS RX
DEEP PLAYOFF RUNS RESULT IN HOME RUNS FOR SPONSORS
CHICAGO CUBS CLEVELAND INDIANS
Overall signage exposure duration is up 6%, and Overall signage exposure duration is up 15%, and
QI Media Value is up 73% year-over-year (postseason included) QI Media Value is up 223% year-over-year (postseason
included; Indians did not make playoffs in 2015)
Including the postseason, outfield wall duration is up
9%, QI Media Value is up 131% (OF wall was the most Including the postseason, outfield wall duration is up
valuable location during the postseason) 20%, QI Media Value is up 515% (OF wall was
the most valuable location during the postseason)
73% of the Cubs’ QI Media Value was generated
during the postseason 53% of the Indians’ QI Media Value was generated
during the postseason
QI Media Value is Nielsen Sports’ global industry standard for sponsorship measurement. The quality index, or “QI,” is calculated based on a proprietary method that considers
size, duration, location and number of concurrent brand exposures. The QI Media Value takes into account the quality and weight of exposure, audience size and cost per thousand.
Copyright © 2017 The Nielsen Company 15NHL
The 2015-2016 NHL season saw an uplift in viewership,
especially on cable, with 8% more viewers tuning in for the
average NHL game on NBCSN compared to the prior year.
2016’s new All-Star format, with each division as its own team
in a three-on-three single elimination tournament, was a hit
with fans. Team selection was put up to a fan vote, resulting in
little-known John Scott being chosen. The changes grabbed
the interest of the public, as fan engagement for the All-Star
Game was extremely high on Twitter and TV. At 8:21pm, during
the announcement of John Scott’s MVP, 8,599 Tweets were
sent. The viewership for the game was the highest U.S.
audience ever for an NHL All-Star game on cable, and up 34%
from 2015’s contest in Columbus.
The 2016 Stanley Cup Finals matchup between the Pittsburgh
Penguins and San Jose Sharks had an average of nearly
4 million television viewers, but was down from 2015.
The battle between the nation’s two coasts ended in six games,
with Sidney Crosby leading Pittsburgh to victory en route
to hoisting his second Cup and first Conn Smythe Trophy. 2016
NHL All-Star MVP John Scott during the
Pacific vs. Central matchup.
TIMELINE OF T V VIEWERSHIP HIGHLIGHTS
AVERAGE # OF U.S. T V VIEWERS IN MILLIONS SOCIAL T V INTERACTIONS *Twitter only
WINTER CLASSIC 2016 WESTERN CONFERENCE FINALS STANLEY CUP FINALS WINTER CLASSIC 2017
Montreal Canadiens vs. St. Louis Blues vs. San Jose Sharks Pittsburgh Penguins vs. San Jose Sharks Chicago Blackhawks vs.
Boston Bruins 6 games 6 games St. Louis Blues
NBC NBC, NBCSN NBC, NBCSN NBC
NHL ALL-STAR GAME EASTERN CONFERENCE WORLD CUP OF
FINALS HOCKEY
NBCSN
Pittsburgh Penguins vs. Canada vs. USA
Tampa Bay Lightning
ESPN
7 games
NBCSN
2016 01/01 01/31 05/15–25 05/13–26 05/30 – 06/12 09/20 2017 01/02
2.8 1.6 1.5 1.9 3.9 0.7 2.6
55K* 326K* 439K* 710K* 1.34M* 146K 754K
Tweets were added up across all events in the Stadium Series, Western Conference Finals, Eastern Conference Finals and Stanley Cup Finals.
16 YEAR IN SPORTS MEDIA REPORT 2016GLOBAL ICE ACTION HEATS UP
2016 was filled with many events that do not come around every Hockey game. This figure was up 41% compared to the USA’s 2004
year, but the fun was not just confined to the Olympics. Hockey had semifinal game against Finland (542K), and up 55% compared to the
its own excitement, with the third annual World Cup of Hockey USA’s 1996 championship win against Canada (492K).
held just north of the border in Toronto.
The excitement was not limited to the U.S. Five of the participating
Although the tournament competed with the NFL regular season and countries had their most-viewed game capture at least 10% of the
MLB playoffs, a record number of U.S. viewers tuned in to America’s viewing market share, with the top share-getters being Finland
Group Stage matchup against Canada. The game saw a P2+ average (43%) during its matchup against Sweden, and Sweden (26%) for
audience of 766K: the highest U.S. audience ever for a World Cup of its bout against Team Europe.
MOST VIEWED GAMES – PARTICIPATING COUNTRIES
COUNTRY
Matchup SWEDEN RUSSIA
Sweden vs. Europe / Semifinals FINLAND
Date Russia vs. Finland
Rating (Demographic) 9/25/2016 Finland vs.
9/22/2016
Share 9.2% (P3+) Sweden
2.8% (P4+)
26.1% 9/20/2016
12.4%
9.1% (P4+)
CANADA DENMARK 43.3%
Canada vs. Europe Czech Republic vs. Europe
Finals Game 9/19/2016
9/29/2016 0.2% (P3+)
6.4% (P2+) 0.3%
18.8%
GERMANY CZECH REPUBLIC
Czech Republic Czech Republic vs. Europe
AUSTRIA 9/19/2016
USA vs. Europe
9/19/2016 Russia 5.0% (P4+)
USA vs. Canada 18.1%
9/20/2016 0.2% (P3+) vs. Sweden
0.8% 9/18/2016
0.3% (P2+) European TV data via Eurodata: Yassine-Guillaume Berhoun,
0.1% (P3+)
0.8% Sport Manager; MediaMetrie/Eurodata TV Worldwide,
0.5% Email: ygberhoun@eurodatatv.com
VIRTUAL GLASS:
VIRTUAL GL ASS EXPOSURE TOP ADVERTISERS
AN EXPOSURE ASSIST
Teams ranked by QI Media Value of Virtual
Just a few years since a handful of NHL teams first Glass Sponsorship Location
experimented with virtual glass signage behind the goal, 1 GEICO
the sponsorship location became the third-most-valuable 1 NEW YORK RANGERS
location during the 2015–16 season. Graphical images 2 DISCOVER
unseen to spectators inside the arena are superimposed 2 CHICAGO BLACKHAWKS
on the glass by the broadcast cameras. The sponsorship
3 SUBWAY
location garnered more than $31.1 million in QI Media 3 PHILADELPHIA FLYERS
4 COORS LIGHT
Value during home game television broadcasts.
4 MONTREAL CANADIENS
QI Media Value is Nielsen Sports’ global industry standard for sponsorship
5 H ONDA HR-V
TRUCKS
measurement taking, into account the quality and weight of exposure,
audience size and cost per thousand.
5 LOS ANGELES KINGS
Copyright © 2017 The Nielsen Company 17SOCCER
2016 was a busy year on the pitch, as four tournament
or league titles were decided by penalty kicks, and the Euros
settled in extra time. The MLS Cup contest was a battle for
North America, with a record average of 3.5 million viewers
across U.S. and Canada watching the Seattle Sounders defeat
Toronto FC. The U.S. alone accounted for just over 2 million,
a 71% bump from the 2015 final.
Across the pond, Leicester City’s improbable EPL champion-
ship was the story of the season. While the 37,000 average
audience for the club’s matches still trailed that of other clubs,
Leicester City saw U.S. coverage duration of its matches
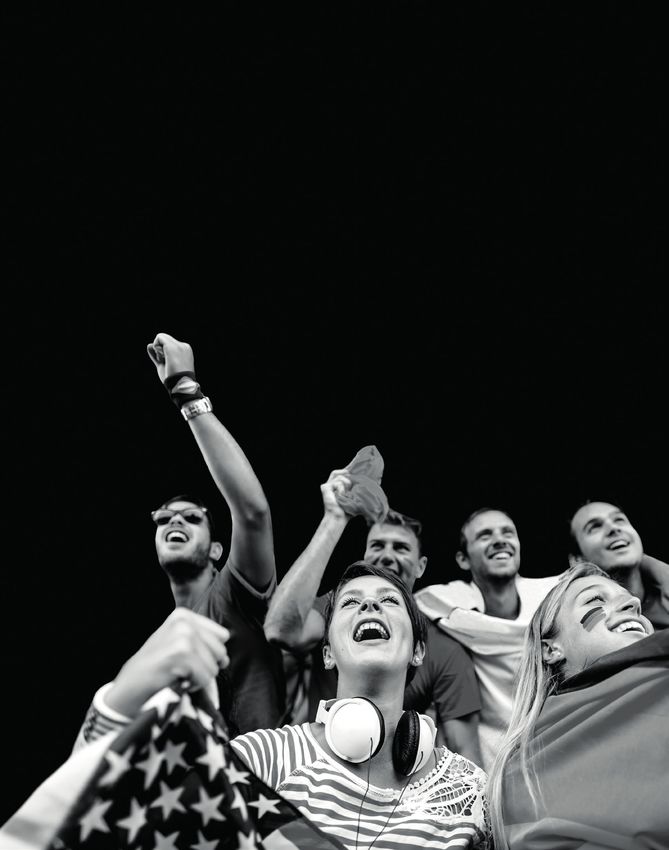
increase 80% from 2015. Cristiano Ronaldo had a historic year,
including Portugal’s defeat of host France in the 2016 Euros
final, with 3% more people viewing than for Spain’s 2012
victory. Chile brought home its second Copa America title in as
many years, once again besting Lionel Messi–led Argentina on
penalties. Average audience viewership for the final was over
8.7 million, representing a 593% lift from 2015’s beIN Sports–
covered tournament. Ricardo
Quaresma and Cristiano Ronaldo celebrate
Portugal’s win over France in the Euro 2016 Final.
TIMELINE OF T V VIEWERSHIP HIGHLIGHTS
AVERAGE # OF U.S. T V VIEWERS IN MILLIONS SOCIAL T V INTERACTIONS *Twitter only
EPL LIGA MX CLAUSURA EUROS FINAL LIGA MX APERTURA
Manchester City vs. FINAL France vs. Portugal FINAL
West Ham Monterrey vs. Pachuca Club América vs.
ESPN, ESPND
Tigres UANL
NBC UDN, UNI
UDN, UNI
UEFA CHAMPIONS LEAGUE COPA AMERICA FINAL MLS CUP
FINAL Argentina vs. Chile Seattle Sounders vs.
Real Madrid vs. Toronto FC
FS1, UNI
Atletico Madrid
FOX, UNIMAS
ESPND, FOX
01/23 05/28 05/29 06/26 07/10 12/10 12/25
1.2 2.9 2.6 8.7 5.3 2.0 3.1
14K* 451K* 15K* 609* 681K* 1.1M 451K
For multicast events, networks are listed alphabetically and metrics reflect the highest Tweets across all airing networks, denoted with an asterisk.
18 YEAR IN SPORTS MEDIA REPORT 2016HISPANICS TUNE IN AT A DIFFERENT PITCH
In looking to create a deeper understanding of the heterogeneous identity seems to factor into the telecast language preference of
Hispanic community, Nielsen and Culturati partnered to examine Hispanics, as the reach figures for Latinistas across all four leagues
values, cultural blending and media consumption among Hispanics. were composed of around 60% or more “Spanish-only” viewers.
An analysis of U.S. P2+ reach was conducted for four different
segments: Latinistas, Heritage Keepers, Savvy Blenders and Ameri-
Fans. These segments range from those who are very traditional LATINISTAS AMERI-FANS
and Hispanic-centered to those who are less focused on preserving
Unacculturated, • Acculturated,
Hispanic heritage. The reach within each segment for live broadcasts culturally Hispanic culturally American
of soccer games was analyzed, and the Latinistas and Ameri-Fans
segments were specifically compared. Very traditional •
Less focused on preserving
and Hispanic-centered Hispanic heritage
The reach and avidity of soccer viewing appears to decrease for all
four leagues as the level of Hispanic culture dominance decreases •
More than 90% prefer
(i.e., are truly bicultural or culturally American). In addition, cultural to speak English
REACH BY SOCCER LEAGUE USING CULTURATI SEGMENTATION (U.S. P2+ A A REACH %)
LATINISTAS AMERI-FANS
AMERI-FANS
LIGA MX 52 52 LIGA MX 18 18 SPANISH ONLY
ENGLISH ONLY
MLS 25 3 4 32 EPL 42 9 15 BOTH
1 TOTAL REACH
EPL 17 3 6 26 MLS 7 6 14
HOW TO READ:
1 2
52% OF LATINISTAS
LA LIGA 12 5 3 20 LA LIGA 3 6
WATCHED LIGA MX
TOP ADVERTISERS
MLS TO KICKOFF IN NEW CITIES
MLS Only
In December, the MLS announced its plan to expand to 24 teams by 2020, beginning with
the addition of Atlanta United and Minnesota United FC next season.
1 HEINEKEN
ATLANTA MINNEAPOLIS
2 WELLS FARGO
47.9% of adults in Atlanta who are very 17.0% of adults in Minneapolis who are
interested in the MLS are of Spanish/ very interested in MLS are of Spanish/ 3 AUDI
Hispanic origin Hispanic origin
84.8% of adults in Atlanta who are 79.1% of adults in Minneapolis who 4 CONTINENTAL TIRES
very interested in the MLS are also very are very interested in MLS are also very
interested in European soccer interested in European soccer 5 AT&T
Copyright © 2017 The Nielsen Company 19GOLF
While Jordan Spieth’s 2015 major championship
victories helped drive ratings growth, viewership for final-round
coverage was down for three of the four majors. British Open’s
switch to NBC helped with the 46% bump in viewership
year over year. The Ryder Cup, held every other year, returned
to U.S. soil in 2016. An average of over 4.2 million viewers
watched the Americans win, a victory dedicated to golf legend
Arnold Palmer, who had passed earlier in the week. The tune-
in for final-round coverage was up 94% compared to 2014’s
final round from Scotland. The U.S. Women’s Open saw
an impressive 35% increase over 2015’s last day, as an average
1.3 million viewers tuned in for Brittany Lang’s victory.
After a 112-year absence, golf made its return as an Olympic
sport during Rio 2016. Live coverage of the four days of play had
an average audience of 579,000 viewers, which is a great figure
considering that top players, including Jordan Spieth and Rory
McIlroy, declined to participate. The final round, which saw the
lone American medalist, Matt Kuchar, earn bronze, had an
average audience viewership of 1.5 million on the Golf Channel. Team USA’s Jordan Spieth hits out of a bunker during
the Ryder Cup at Hazeltine National Golf Course.
TIMELINE OF T V VIEWERSHIP HIGHLIGHTS
AVERAGE # OF U.S. T V VIEWERS IN MILLIONS SOCIAL T V INTERACTIONS *Twitter only
THE MASTERS U.S. OPEN BRITISH OPEN RYDER CUP
Winner: Danny Willett Winner: Dustin Johnson Winner: Henrik Stenson Winner: USA
CBS FOX NBC NBC
KPMG WOMEN’S U.S. WOMEN’S OPEN PGA CHAMPIONSHIP
PGA CHAMPIONSHIP Winner: Brittany Lang Winner: Jimmy Walker
Winner: Brooke Henderson
FOX CBS
NBC
04/10 06/12 06/19 07/10 07/17 07/31 10/02
12.4 0.8 5.4 1.3 4.9 5.3 4.3
385K* 2K* 337K* 9K* 76K* 42K* 1.1M
Only the final day of each tournament is listed
20 YEAR IN SPORTS MEDIA REPORT 2016GOLF HITS AN ACE WITH RISING STARS
Jason Day, the World Golf Rankings no. 1 golfer, provided the highest place rank in sponsorship exposure based on 100% U.S. media
sponsorship exposure value to his brands, when looking at both equivalency. Golf’s third member of the “New Big Three,”
the U.S. and abroad. Day earned three PGA Tour wins in 2016, which Rory McIlroy, managed to finish the year at no. 3 in the World
contributed to his high coverage time and exposure. Golf Rankings, but failed to make the cut in two of the four majors,
leading to a sponsorship exposure rank of 5th. Tiger Woods’ long-
Jordan Spieth’s success in 2015 seemed to carry over into 2016, at awaited return to golf came at December’s Hero World Challenge
least when it came to sponsorship branding. Despite not winning a event, and despite finishing 15th overall in his only event of the year,
major, his star power and success on the course led to a second- Woods led all golfers in time on screen for that one event.
TOP GOLFER SPONSORSHIP BRANDING
1 JASON DAY 2 JORDAN SPIETH 3 DUSTIN JOHNSON 4 PHIL MICKELSON 5 RICKIE FOWLER
TOP SPONSORSHIP LOCATIONS (TEAM ASSETS ONLY) TOP SPONSOR BRANDS
1
PLAYER HAT
1 TAYLORMADE GOLF
5 36%
CADDIE HAT 2 ADIDAS
3%
3 UNDER ARMOUR
4 NIKE
4
5 CALLAWAY GOLF
PLAYER SHOES
8%
3
EQUIPMENT BAG
14%
2
PLAYER SHIRT
*value out of total team/player sponsorship assets
100% Media Equivalency: Gross Advertising Equivalent 33%
Copyright © 2017 The Nielsen Company 21UFC
The Ultimate Fighting Championship made big strides
in 2016 with the legalization of mixed martial arts in New York
state and its acquisition by global sports and entertainment
powerhouse WME-IMG. The appeal of UFC and MMA has seen
growth not only in the U.S., but also across international
markets. According to Nielsen SportsDNA, which is surveyed
across 33 countries, interest in UFC rose 6.3% in Russia,
5.0% in Spain and 4.5% in Poland since 2014. Still, the top five
countries for the sport in 2016 include Thailand, Malaysia,
Turkey, Singapore and Brazil.
In 2016, “the Notorious” Conor McGregor was the biggest draw
for pay-per-view sales in the U.S., and became the first man to
simultaneously hold title belts in two weight classes. Although
many were excited for Ronda Rousey’s return to the octagon,
she was defeated in a remarkable 48 seconds by incumbent
bantamweight champion Amanda Nunes. According to Nielsen
Social, there were 6.6 million social TV interactions around
this UFC 207 fight, and over 17,000 interactions during the peak
minute immediately following Nunes’ victory. Conor
McGregor celebrates after winning UFC 205
over Eddie Alvarez.
TIMELINE OF T V VIEWERSHIP HIGHLIGHTS
AVERAGE # OF U.S. T V VIEWERS IN MILLIONS SOCIAL T V INTERACTIONS *Twitter only
UFC FIGHT NIGHT UFC FIGHT NIGHT UFC 205 PRELIMS UFC 207 PRELIMS
Johnson vs. Bader Holm vs. Shevchenko Alvarez vs. McGregor Nunes vs. Rousey
and Prelims
FOX FS1 FOX
FOX
UFC FIGHT NIGHT UFC FIGHT NIGHT UFC FIGHT NIGHT
Teixeira vs. Evans Maia vs. Condit Vanzant vs. Waterson
FOX FOX FOX
01/30 04/16 07/23 08/27 11/12 12/17 12/30
2.7 2.5 3.0 2.0 1.8 2.8 1.5
55K* 46K* 55K* 227K 73K 302K 52K
22 YEAR IN SPORTS MEDIA REPORT 2016THE McGREGOR EFFECT
Since his record-setting 13-second knockout of Jose Aldo in December average across the eight other FS1 PPV prelims. Two of these
2015, charismatic and one-of-a-kind star Conor McGregor has telecasts were in the top four most-viewed since UFC moved to
been thrust into the spotlight. The buzz around the Irish fighter FOX Sports in 2013. For his prelims, the median age of the viewer
continued, and in 2016 his three fights drew the attention of sports was 39.4 versus 43.6 for the other eight PPV prelims, which was
fans to the UFC. When looking at U.S. viewership and TV coverage driven by the high P18–34 audience.
for the UFC, McGregor’s magnetism appeared to increase viewer-
ship for his lead-in prelim fights on FOX Sports 1, coverage across As a result of both McGregor’s prowess in the octagon and his
sports news and interest from younger fans. personality outside of it, ESPN SportsCenter increased the amount
of coverage devoted to UFC. In 2016, two of the top three highest
McGregor’s three pay-per-view prelim fights on FS1 had an months of UFC coverage on ESPN SportsCenter were March
average audience of 1.6 million, which was 80% larger than the and August, when McGregor had his UFC 196 and UFC 202 fights.
UFC # OF MINUTES OF ESPN SPORTSCENTER COVERAGE TOP ADVERTISERS
1 METRO PCS
2016 359 min 2 BUD LIGHT
2015 23739%
min 3 GEICO
2014 41 min 4 APPLEBEE’S
5 KFC
UFC FAN INSIGHTS: UFC FANS COMPARED TO THE AVERAGE U.S. ADULT TOP COUNTRIES
FANS ARE DEFINED AS THOSE SOMEWHAT OR VERY INTERESTED IN UFC MOST INTERESTED IN MMA
IN 2016
Monster Energy’s partnership with UFC seems to be paying off, as fans of the sport are much
more likely than the average U.S. adult to consume the energy drink. In addition, UFC fans are more
likely to drink Bud Light and eat at KFC, which are two of UFC’s top advertisers. 1 THAILAND
2 MALAYSIA
153% 3 TURKEY
91% 91% 89% 36% 4 SINGAPORE
42%
5 BRAZIL
more likely more likely more likely to more likely more likely more likely
to drink to watch live attend a R&B/ to drink to eat at to be
Monster Energy sports on rap/hip-hop Bud Light KFC single
the internet concert
Copyright © 2017 The Nielsen Company 23NCAA BASKETBALL
Interest in NCAA Men’s Division I Basketball clearly
grows throughout the season. The average audience for regular-
season games in March was 79% higher than at the start of
the season in November. This buildup to March Madness
did not disappoint. The championship game came down
to a three-point buzzer beater and a resurgence of the “Crying
Jordan” meme. Almost 16 million people watched one of
the most dramatic finishes in the history of college basketball
as Villanova defeated North Carolina on April 4.
Despite this nail-biting finish, the ratings across TBS, TNT and
TruTV were down from 2015. However, the final minutes of the
championship game on TBS saw ratings as high as 19 million
viewers. Regardless of ratings, March Madness and NCAA
Basketball attracts a sought-after audience. Seventy-six percent
of the tournament audience has had at least some college
education, and 52% have an income of $75,000 or more, which
is a higher audience composition than many professional sports.
Villanova’s
Kris Jenkins makes a buzzer beater to defeat
North Carolina in the NCAA Championship Game.
TIMELINE OF T V VIEWERSHIP HIGHLIGHTS
AVERAGE # OF U.S. T V VIEWERS IN MILLIONS SOCIAL T V INTERACTIONS *Twitter only
ROUND OF 64 SWEET 16 FINAL FOUR
CBS, TBS, CBS, TBS TBS, TNT, TRUTV
TNT, TRUTV ROUND OF 32 ELITE EIGHT CHAMPIONSHIP
CBS, TBS, CBS, TBS GAME
TNT, TRUTV TBS, TNT, TRUTV
03/17–18 03/19–20 03/24–25 03/26–27 04/02 04/04
2.0 4.7 5.1 9.2 10.7 15.8
2M* 1.4M* 796K* 908K* 845K* 1.8M*
Tweets were added up across all events in the Elite Eight and Final Four.
24 YEAR IN SPORTS MEDIA REPORT 2016THE METHOD BEHIND THE MADNESS
First-round upsets busted many 2016 March Madness brackets, To get full social capital from these pools, participants have to
but, fortunately, social camaraderie and bragging rights among be in the know and watch the games live. The TV screen is
family and friends are just as important to bracket participants unrivaled as the primary means of engaging with March Madness.
as winning money. This is a comforting notion, since 13% of Among bracket participants, 71% watch or track the tournament
participants select their winners based on team colors. These on television, with checking scores online via a computer or
drivers are further illustrated by the types of pools that bracket tablet coming in a distant second and third. Twenty-six percent of
participants are most likely to join. A pool with family or friends participants prefer to do their trash-talking in person, while 17%
is nearly twice as likely to be joined when compared to others of fans take to social networks. This past year, there were 1.8
composed of coworkers, a public forum or independent/ million Tweets surrounding the championship game broadcast,
non-group participants. which made up 50% of all Twitter TV interactions on April 4.
REASONS FOR PARTICIPATING TOP WAYS TO FOLLOW
Social Camaraderie 42 %
71%
To Win Money 39%
24% 20%
For Bragging Rights Among My
38% 12% 8% 7%
Friends, Family or Co-Workers
To Enhance My
37%
Watching Experience
Other 7%
TV, Home/ Check Scores Check Scores TV, Public Stream on Stream on
Don’t Know 4% Private on Computer on Phone/ Location Computer Phone/
Residence Tablet Tablet
TOP 5 LOCAL NCA A BASKETBALL FAN BASES TOP ADVERTISERS
1. KENTUCKY WILDCATS (Lexington) | 68% 1 AT&T
2. SYRACUSE ORANGE (Syracuse) | 51%
3. LOUISVILLE CARDINALS (Louisville) | 46% 2 CAPITAL ONE
4. IOWA STATE CYCLONES (Des Moines) | 38%
5. ARIZONA WILDCATS (Tucson) | 38%
3 NORTHWESTERN
MUTUAL FINANCIAL
4 L OWE’S HOME
% OF POPULATION THAT IMPROVEMENT
HAS WATCHED, ATTENDED
OR LISTENED TO THE TEAM
5 COCA-COLA CLASSIC
IN THE PAST 12 MONTHS
(SCARBOROUGH)
Copyright © 2017 The Nielsen Company 25You can also read