Your perfect pool experience - Strategic Plan - Investor Relations October 2019 - Fluidra
←
→
Page content transcription
If your browser does not render page correctly, please read the page content below

Your perfect pool
experience

Strategic Plan – Investor Relations
October 2019
2
Disclaimer
This document is for information purposes only and does not constitute an offer to sell, exchange or buy, or an invitation to make offers to buy,
securities issued by any of the companies mentioned. This financial information has been prepared by Fluidra, S.A. ("Fluidra", and with all its
subsidiaries, the "Fluidra Group") in accordance with International Financial Reporting Standards (IFRS). Taking into consideration the recent
merger of Fluidra and the Zodiac Group, please note that the companies within the Fluidra Group coming from legacy Zodiac have reported on a
September fiscal year, using US Dollars as its functional currency and under IFRS accounting standards. In this presentation, financials have thus
been calendarized to December year-end based on management accounts. Financials have been converted to Euros at Fluidra reporting FX rates.
The assumptions, information and forecasts contained herein do not guarantee future results and are exposed to risks and uncertainties; actual
results may differ significantly from those used in the assumptions and forecasts for various reasons.
The information contained in this document may contain statements regarding future intentions, expectations or projections. All statements,
other than those based on historical facts, are forward-looking statements, including, without limitation, those regarding our financial position,
business strategy, management plans and objectives for future operations. Such forward-looking statements are affected, as such, by risks and
uncertainties, which could mean that what actually happens does not correspond to them.
These risks include, amongst others, seasonal fluctuations that may change demand, industry competition, economic and legal conditions, and
restrictions on free trade and/or political instability in the markets where the Fluidra Group operates or in those countries where the Group's
products are manufactured or distributed. The Fluidra Group makes no commitment to issue updates or revisions concerning the forward-
looking statements included in this financial information or concerning the expectations, events, conditions or circumstances on which these
forward-looking statements are based.
In any event, the Fluidra Group provides information on these and other factors that may affect the Company's forward-looking statements,
business and financial results in documents filed with the Spanish National Securities Market Commission (Comisión Nacional del Mercado de
Valores). We invite all interested persons or entities to consult these documents.
3

The new Fluidra: merger of two successful companies

                                           Overview                                                      Highly profitable and cash generating business
                                                                                                     (In €m)
• Global leader in pool equipment and wellness solutions                                                                               10% PF SALES CAGR

• Innovative, user-focused provider of highly engineered                                                                              15% PF EBITDA CAGR
  products and solutions                                                                                                                                        1.127               1.203
                                                                                                           933                        1.022

• Listed on the Spanish stock exchange, with a market
  capitalization of >€2.0B                                                                                              133                        153                      174                199

• Global headquarters in Barcelona, (Spain) and North
  American headquarters in San Diego (California)                                                                2014                       2015                     2016               2017
                                                                                                                                              PF Sales          PF EBITDA

         Global & balanced presence                                  Strong complementary business                                                          Shareholder Structure
(Sales by business unit PF FY2017A)                           (Sales by business unit PF FY2017A)
                                       LatAm                                                                                                             Founding
                                                                                                                   Other
                                                                                                                                                         Families
                                                                        Fluid handling                5%
                                      1%                                                                                                                  28,1%                     Free Float
       Rest of World
                            20%
                                                                                                    7%
                                                     Europe                                                                                                                           33,5%
                                                                         Pool water            13%
                                               49%                        treatment
                                                                                              7%
                                                                                                                  68%
                           30%                                                                                                Residential
                                                                             Commercial
       North America

                                                                                                                                                                    Rhône Capital
                                                                                                                                                                       38,4%
4

Key investment highlights

    1       Structurally attractive industry that grows ~2x GDP

              • New pool construction below historical average feeds ever growing installed base
                • Large installed base drives annuity-like aftermarket
                 • Double engine model: growth & resilience

             2       Global leader in the pool and wellness industry

                     •     Broadest geographic footprint with business model adapted to each market
                      •    Expansive product offering drives growth and expands addressable market
                      •    Globally recognized brands allow for market segmentation and channel optimization
                      •    Core competency in innovation defends market position and drives future growth
                     •     Proven track record of best practices that deliver sales and operational excellence
                    •     Strong culture and team committed to sustainable industry leadership

          3       Compelling equity story with strong value creation

               • Strong sales growth with resilient business model
             • Significant cost synergies along with margin improvement initiatives
          • Excellent cash generation to fund value accretive initiatives
        • Strong growth of Return on Capital Employed
Structurally
attractive industry

6

Global pool market opportunity of € 7.1 bn

           North America and Europe represent 79%                                                                               Fluidra leads market with 18% share and room to grow

                              Rest of World                                                                                                                                                        Fluidra
                                                                                Europe

    South America
                                                                                                                                                                               18%                                  Other Global
                                       16%                                                                                                                                                                          Equipment
                                                                               30%                                                                                                                                  Players

                            5%                                                                                                                                                                            22%
                                                  Global Pool
                                                                                                                                                                         Global Pool
                                                    Market
                                                                                                                                                                           Market
                                                   € 7.1 bn                                                                                      36%                     € 7.1 bn

                                                                                                                                                                                                                        Top 10
                                                                                                                                                                                                      12%               Regional
                                                                                                                                                                                                                        Players
                                                 49%                                                                                                                              12%
                                                                                                                                                                                                             Global Chemical
                    North America                                                                                                                                                                            Players
                                                                                                                                                     Others

                                                                            76% residential pool, 24% commercial pool
Sources: Market at manufacturing perspective through internal studies, estimates & assumptions, news reports, D&B reports, annual reports & presentations and reports & publications from trade groups.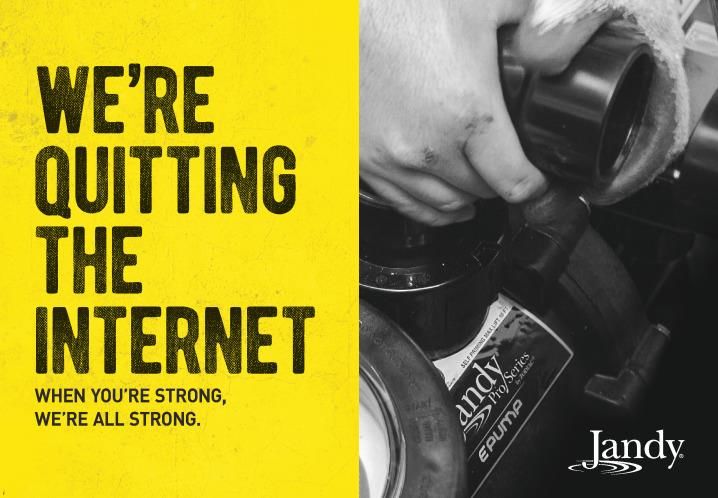
1,500
Thousands
1,400 7
1,300
Highly attractive market with two growth drivers
1,200
1,100
1,000
900
Life of pool & renewal cycle New
800
build growing but still well below pre-crisis levels
(Varies depending on use and construction type) 700
New Pools
600
Thousands
500
1,500 400
Thousands
Year 1
1,400 Year 10 Year 20 300
1,300 200
Construction
1,200 Consumable Maintenance & Remodel 100
of Pool usage replacement of
1,100 components 0
2007 2009 2011 2013 2015 2017
1,000
New build Aftermarket Europe N. America S. America RoW
900
800 Resilient evolution of pool base Resilient market driven by large installed base
Existing700
pool base Split by market type
18 600 Unit CAGR: 2%
New Build at
2009 Volume
16 500 Aftermarket
14 20%
12 400
10 300
8 7%
6
200 New Build above
4 70% 2009 Volume
100
2
0 73%
0
20072007 20092009 2011
2011 2013
2013 2015
2015 2017
2017
Europe N. America S. America RoW
New build feeds pool base every year even in a downturn
Sources: Internal estimates based on external sources (news, company annual reports & presentations, and reports & publications from trade groups)
8

Growing & resilient market with strong fundamentals

                                         Growing market                                                                                                  Estimated market growth range
Market size (€, bn)

                                                  CAGR: c. 5%
                                                                                                                                      Average
                                                                                                                                        Ticket       ~1.5–2.5%
                                                                                                                                       Growth                                         ~ 7%

                                                                                 7.1
                                                                                                                                     Installed                                               Annual
                           6.2                                                                                                      Pool Base
                                                                                                                                      Growth
                                                                                                                                                     ~1.5–2%
                                                                                                                                                                 =   ~ 4 – 6%     =          Range of
                                                                                                                                                                                             Growth
                                                                                                                                                                      Long Term
                                                                                                                                                                       Average

                                                                                                                                         New
                                                                                                                                         Build       ~1–1.5%
                                                                                                                                                                                      ~ 3%
                                                                                                                                       Growth

                           2014                                                   2017

Sources: Internal estimates based on external sources (news, company annual reports & presentations, and reports & publications from trade groups)
Global leader in the
pool and wellness
industry

10

Global leadership leveraging a unique and powerful platform

       Broadest geographic footprint with business model adapted to each market

            Expansive product offering drives growth and expands addressable market

              Globally recognized brands allow for market segmentation and channel optimization

              Core competency in innovation defends market position and drives future growth

            Proven track record of best practices that deliver sales and operational excellence

       Strong culture and team committed to sustainable industry leadership
11
Broadest geographic footprint adapted to local market
• Global market leader with access to all
major pool markets
• Customer & commercial approach by
market
• Large growth opportunity in the US, the
world’s largest market
Sales by geography
(PF FY2017A)
LatAm
1%
Rest of World
20%
Europe
49% #1 Top 3
No. of countries 30 16
30%
% of global pool base 40% 53%
North America
93%
Geographical diversification reduces risk and provides opportunity for growth12
Expansive product offering drives growth
Pool Ladders and Cleaning
Efficient Lighting Pool Cleaners Internet of Things Fire Features Filters Valves
Showers Accessories
Energy Efficient Energy Efficient
Pool Covers Pumps
Water Care Efficient Heaters
White Goods Disinfection
75.000+ items from entry level manual cleaners to large commercial filters;
service needs from above ground pools to commercial pools10
13
Iconic brands provide opportunity to segment
offering and gain penetration
• Jandy gained first-mover advantage by taking all
equipment off-line in North America
– Brand dedicated to professionally installed pool
equipment
– This move increases pool professionals’ loyalty to
our company
– Hundreds of customers gained in less than a year
– Provides >1% North America growth potential in a
challenging market
• Other company brands are used to target consumer14
Core competency in product development
drives future growth
Excellence in innovation Cleaners
R&D capability with >200 engineers
Pumps &
and >1,100 patents Filters
Robust product road map Heating
New
– Improving quality and user experience
products
Water Care
– Technology focused on increasing energy
efficiency and sustainability
Adjacent
– Global range expansion
– Industry leader in connected pools (IoT) Internet of
Things (IoT)
Proven history of innovation helps us outgrow the market15
Proven track record and best practices to deliver
Sales and Operational Excellence
Operations Sales
• Quality as a differentiator • Strong customer relationships through customer
• Improve service level via planning best practices and collaboration and adaptation
improved manufacturing footprint • Best in class channel management and end user
• Drive Value communication
– Large synergy opportunity • Sales Activity Model in combination with
Salesforce.com (CRM) to maximize effectiveness
– Lean & Value Improvement program expansion
• One Stop Shop – everything the pool pro needs
– Implement cash best practices from each business
• Industry leading loyalty programs
Delivering value to our users, customers and shareholders16
World class team of industry and functional experts
Over 30 years of experience in global consumer and industrial
Over 25 years of experience in the sector products industries
Fluidra’s CEO since 2006 and Executive Chairman since 2016 Previously spent over 20 years at Stanley Black & Decker in
various general management roles
Managing director of Fluidra Group since its inception in 2002
Joined Zodiac as CEO in 2011
Eloi Planes Bruce Brooks
Executive Chairman CEO
Xavier Tintoré Troy Franzen Carlos Franquesa Joe Linguadoca Jaume Carol Keith McQueen Juanjo Masoliver
CFO North America Europe, Asia, LatAm and Operations Manufacturing Innovation & Engineering HR
Southern Hemisphere
Joined Fluidra in 2010 Joined Zodiac in 2010 Joined Fluidra in 2007 Joined Zodiac in 2012 Joined Fluidra in 1991 Joined Zodiac in 1995 Joined Zodiac in 1997
Over 25 years Over 30 years of Over 30 years of Over 25 years of Over 30 years of Over 30 years of Over 30 years of
experience in business, sales and business, sales and operating experience operational and engineering and operating experience
corporate and finance operating experience operating experience in manufacturing and manufacturing operations experience in business
in multinationals and consumer durables experience management
public companies
Highly complementary and experienced management team17
Four strategic objectives that deliver value through 2022
Great operating
Product category expansion and financial performance
Accelerate growth After market penetration
in North America New product pipeline and connected pools Sales Growth 5 – 8%
EBITDA Margin ~21%
Leverage platform in Cash & Carry expansion
Sales and customer management
Europe and Southern Brand and channel management
Net Income
~30%
CAGR
Hemisphere Integration
Increase penetration of Strong cash flow
Complete product portfolio generation and improving returns
commercial pools in From prescription to project management
emerging markets
Free Cash Flow >€250m
Improve margin via Value improvement & lean
Net Leverage 20%Accelerate growth in North America
19

North America: Market & competitors

                              Fluidra has 10% share of €3.5bn                                                                                                               Highlights
                                                                                  Fluidra
                                                            10%                                                                         • Aging installed base
                                                                                       Other Large
                                                                                       Equipment
                                        41% North America                              Players                                          • Higher prices and better technology on pool pads
                                                   Pool Market          32%
                                                    € 3.5 bn
                            Others                                                                                                      • Traditional fragmented dealer base

                                                        17%                     Large Chemical
                                                                                                                                        • Rational competitors
                                                                                Players

           New build growing but below pre-crisis levels                                                                                    Continued expansion of installed base of pools
New pool build (in 000s)                                                                                                             Existing pool base (in 000s)
          250                                                                                                                                  7.000

                                                                                                                                               6.000
          200
                                                                                                                                               5.000

          150                                                                                                                                  4.000
                                                                                            Long Term Average
                                                                                                                                               3.000
          100
                                                                                                                                               2.000
           50
                                                                                                                                               1.000

             0                                                                                                                                      0
                     2005            2007        2009          2011         2013            2015        2017                                                  2005   2007   2009   2011   2013   2015   2017

Sources: Internal studies, estimates & assumptions, news reports, D&B reports, annual reports & presentations and reports & publications from trade groups.
Notes: (1) Only refers to In-Ground Residential Pools.
20
North America is a growing and resilient market
Leading player in key residential pool categories Strong market growth
Others Fluidra
Chemicals Residential Pool
CAGR: c. 5%
21%
37% 20%
Pool Where Pool
Market 53% we Market
€ 3.5 bn Compete € 1.8bn
Commercial
Pool
10% 59%
Other Large
2014 2017
Equipment
Identified revenue synergies Players
Most resilient market — 80% aftermarket Proven Track Record of Growth
Split by market type
New Build at 2009 volume
16% New Build above CAGR: c. 9%
2009 volume
5%
79%
Aftermarket
2014 2017
Sources: Internal studies, estimates & assumptions, news reports, D&B reports, annual reports & presentations and reports & publications from trade groups.21
North America: Residential channel structure
Customers /
Manufacturers Distribution
Prescribers Users
Pool builders
Maintenance,
and servicers
Remodelers Homeowner
Other
distributors
Retailers
Niche OEMs
LC suppliers
Parts suppliers Homebuilders
Dealer loyalty
On time in full delivery Ease of use
Key drivers Zero defects
Channel management
Cost to maintain
Technical expertise
Technical support
Key success factors Training & aftermarket sales & service Brand reputation
Operational excellence22
2022 PLAN
Revenue synergies
North America: expand residential pool offering
Expansion opportunities Market and business drivers
Residential
37% pool
Chemicals 53%
N. America
pool market Where we compete
U.V. Systems Fluid handling € 3.5 bn (20% market
share)
10%
Commercial
pool
Identified Revenue Synergies
Controllers Connectivity market c. €150m
• New products to be produced in existing European
factories to increase sales in new categories and
segments
• Go-to-market: leverage North American sales team and
Above ground pool White goods existing channels
equipment
Sources: Internal studies, estimates & assumptions, news reports, D&B reports, annual reports & presentations and reports & publications from trade groups23
2022 PLAN
Revenue synergies
North America commercial pool
Market overview Competitive landscape
Fluidra
Larger
Waterparks 1%
Commercial 33%
8% Other large
19% equipment players
Municipal Lodging
Commercial
Parks 22% pool excl.
Commercial
pool excl. chemicals
Health/ 12% chemicals €0.4bn
Luxury Clubs €0.4bn
Multi-Family
11% Others 66%
Universities/ 28%
Secondary Light
Schools Commercial or
HMAC (50% 2022 Revenue synergies target
of total)
Fluidra
5%
Other large
• Installed base greater than 330k pools 35% equipment
players
• Approximately 3k new pools built in 2018 Commercial
pool excl.
60% chemicals
• Estimated market growth of 4%
Others
Sources: Internal studies, estimates & assumptions, news reports, D&B reports, annual reports & presentations and reports & publications from trade groups24
2022 PLAN
Revenue synergies
North America commercial pool
Expansion opportunities Business plan drivers
• Launch new commercial offering leveraging Fluidra’s
existing factories
• Attack the HMAC channel with a dedicated new sales
Pumps organization
• Target a mix of existing North American customers,
specialized commercial builders and aftermarket
customers
• Commercial pool launch drives existing products’
Heaters associated sales
• Commercial pool gross margin expected to be slightly
lower than group margin
• Positive EBITDA margin contribution in 2021 and beyond
Filters Valves
Platform for consolidation in fragmented market25
North America: Strategies to accelerate growth
Prescriber loyalty
Aftermarket share growth
Product expansion and other revenue synergies
Connected pools (IoT)Leverage platform for Europe and Southern Hemisphere
27

Europe & Southern Hemisphere:
Developed market & competition
               Fluidra has 28% share of €2.9bn market                                                                                                                      Highlights
                                                                            Fluidra                                                     • Mainly residential pools and a huge                              New Build at
                                                                                                                                                                                                           2009 volumes
                                                                                                                                          base of professional customers
                                                                      28%                                                                                                                                 17%

                                                                                                                                        • Commercial market well developed
                                                  ESA Developed
                                                   Pool Market                                                                            by existing customers                                                 15%
                                                     € 2.9 bn                           Other Large
                                       61%                               11%            Equipment
                                                                                                                                        • Few global players-many national
                                                                                                                                                                                             68%
                                                                                        Players
                       Others                                                                                                             competitors
                                                                                                                                                                                                          New Build above
                                                                                                                                                                                    Aftermarket           2009 volumes

                   New build still below pre-crisis levels                                                                                  Continued expansion of installed base of pools
New pool construction (in 000s)                                                                                                      Existing pool base (in 000s)
        250                                                                                                                              10.000

        200                                                                                                                                8.000

        150                                                                                                                                6.000

        100                                                                                                                                4.000

         50                                                                                                                                2.000

          0                                                                                                                                     0
                    2007            2009             2011            2013             2015           2017                                                 2007      2009     2011     2013         2015         2017

Sources: Internal studies, estimates & assumptions, news reports, D&B reports, annual reports & presentations and reports & publications from trade groups.
Notes: (1) Only refers to In-Ground Residential Pools.
28
Developed markets:
Vertically integrated & omni-channel approach
Customers /
Manufacturers Distribution Prescribers Users
Pool builders
Own
distribution Maintenance,
and servicers
Homeowner
Other
Manufacturers Other Remodelers
distributors
Niche OEMs
Retailers
Homebuilders
Modern channel
Capillarity Technical expertise Ease of use
Key Drivers Credit & Collections Closeness to the user Cost to maintain
One stop shop
Key Success Factors Technical support, training & after sales service
Availability in branch/on time delivery29
2022 PLAN
Revenue synergies
Europe and Southern Hemisphere
Expansion opportunities Business drivers
• Differentiated go-to-market strategies depending on
geographies:
- Cross-selling products: for overlapping
geographies, leveraging existing platforms to
Robots Heating Suction cleaners maximize share of wallet
- Introducing Zodiac products: leveraging
Fluidra’s capillarity for non-legacy Zodiac
geographies, mainly in Latin America and Asia
• Similar gross margins to group level of c. 52%
• Positive EBITDA contribution in 2019 and beyond
Pumps Above ground pools Lights
Over €7m of synergies achieved to date30
Developed markets: Strategies for profitable growth
Gain Capillarity: Cash & Carry expansion
Gain penetration: Sales and customer management
Improve customer engagement: Brand and channel
management
Capture revenue and cost synergiesIncrease penetration of commercial pools in emerging markets
32

Emerging: Market & competition

                 Fluidra has a 15% share on a €0.7bn                                                                                                                       Highlights
                                                                       Fluidra                                                           • Market based on commercial pools
                                                           15%
                                                                                    Other Large
                                                                                    Equipment                                            • Focus on new construction
                                               ESA Emerging
                                                                     12%            Players
                                                Pool Market
                                                  € 0.7 bn                                                                               • Highly fragmented markets
                     Others
                                       73%                                                                                               • Tourism is the major driver: HMAC Channel

                     New construction remains steady                                                                                        Continued expansion of installed base of pools
New pool build (in 000s)                                                                                                             Existing pool base (in 000s)
       200                                                                                                                                 5.000

                                                                                                                                           4.000
       150

                                                                                                                                           3.000
       100
                                                                                                                                           2.000

        50
                                                                                                                                           1.000

         0                                                                                                                                     0
                   2007            2009             2011            2013            2015            2017                                                  2007      2009     2011   2013   2015   2017
Sources: Internal studies, estimates & assumptions, news reports, D&B reports, annual reports & presentations and reports & publications from trade groups.
Notes: (1) Only refers to In-Ground Residential Pools.
33
Emerging markets: Push and pull combined strategy
Customers Final Engineering
Manufacturers Distribution Prescribers customers Prescribers
Pool builders Developer
Own
distribution Maintenance,
and servicers
Contractor PULL
Other Other Remodelers
Other
Manufacturers distributors Engineering
Operator companies
Niche OEMs
Capillarity Technical Capex Design
Key Drivers Credit & Expertise On time opening Technical
Collections On time installation Cost to maintain expertise
One stop shop
Key Success Technical support, training & After sales service
Factors Availability in branch/on time delivery34
Emerging markets: Strategies for profitable growth
Broaden commercial pool product range
Expand projects globallyCompelling equity story with strong value creation
36
Compelling equity
story with strong
value creation
1 Strong sales growth and a resilient business model
2 Significant cost synergies
3 Compelling margin improvement
4 Strong cash flow generation
5 Solid balance sheet with currency hedge
6 Improving Return On Capital Employed37
2022 PLAN
Revenue synergies
Ambition of €59m in revenue synergies to be reached by 2022
Initiatives Revenue synergies evolution
(€ m)
59
• North America
– Expand residential pool offering
– Develop a new commercial pool business
unit leveraging existing legacy Fluidra
factories and knowledge
• Europe and Southern Hemisphere
– Opportunities for cross-selling in
overlapping geographies
– Introducing Zodiac products in countries
without presence today, leveraging
Fluidra’s capillarity
2019 2020 2021 2022
Europe & Southern Hemisphere North America
Revenue synergies provide upside opportunity / hedge for change in macro environment
Note: Exchange rate of 1.1386 from US$ to €38
2022 PLAN
Impacts from the merger: revenue dis-synergies
1 Additional impacts of Aquatron divestiture
– Acquirer desire to develop US presence faster than anticipated
impacting Aqua Products
– Incremental impact on our revenue due to the remedy
implementation and the resulting agreement to distribute
cleaners
2 Small customer overlap in Europe and Southern Hemisphere
One time impact of c. €11m in 2019 and c. €18m by end of 2020
Note: Divestitures and other perimeter impact of €18m for 201939
2022 PLAN
Summary: revenue synergies and dis-synergies
Net revenue
€42m synergies
opportunity
Revenue Revenue Revenue Revenue Revenue Revenue Revenue
dis-synergies synergies dis-synergies synergies dis-synergies synergies synergies
2019 2020 2021 2022
Bolt-on acquisitions can provide additional acceleration to established platform40
1 Strong sales growth and a resilient business model
Strong growth outlook (excludes revenue synergies)… …that is highly resilient…
5–8%
1–2% 8% New Build sales
over all-time low
1–1.5%
26% New Build
1.5 –2.5% sales at all-time low
Combined
Business is
1.5 –2% 92% Resilient
Sales
Installed Base Growth Average Ticket New build Market Share Gains Sales Growth 66% Aftermarket sales
Growth Growth
… Resulting in Total Sales of €1.7bn in 2022 Growth drivers
(€bn) 1,7
• Maintaining and upgrading an aging installed base is main
market driver
1,2
• New build well below long-term historical averages adds room
for further growth
• Sales excellence, product expansion and service improvement
will drive market share gains
• Diversified geographical footprint reduces risk profile
2017 PF 2018E 2019E 2020E 2021E 2022E
Revenue synergies and bolt-on acquisitions are additional growth drivers to current plan41
2022 PLAN
Value initiatives and lean update
(€ m)
• Value initiatives and lean target revised upwards by €5m
to €30m
– Active projects for €18m as of 2019
– Ongoing process, provides future opportunities
• US tariff is an offset to visualizing 2019 incremental value
initiatives and lean impact on P&L (approximately €7m)
• Redesigning supply chain to have tariff become a
temporary impact
– Mexico manufacturing hub
6 8 13 16 19 25 30 – Relocating Chinese suppliers to other South East
Asian countries
2018A 2019E 2020E 2021E 2022E
• Value initiatives and lean costs to achieve are part of the
Guidance Achieved
ongoing yearly budget
Value improvement initiatives with disciplined process deliver value42
2022 PLAN
Cost synergies update
(€ m) • Commercial integration cost synergies provide upside
– Updated target by €5m from €12m to €17m.
After first year of integration, additional synergies have
been identified and executed:
• North America: €2m
• Europe and SoHem: €2m
• HQ: €1m
– Executed faster than anticipated due to pre-merger
preparation and disciplined process
• Operations cost synergies on track
– Maintained target of €23m despite Aqua dis-synergies
• Operations synergies require more time to execute
because of engineering, testing, etc.
Costs to
2018 2019 2020 2021 Total
Achieve – Key projects in 2019: execution of gas heater
Original
manufacturing plant from the US to Mexico providing €4m
13 16 7 0 35 savings. Related non-recurring expense of €3m
Guidance
Revised
19 22 5 1 47
• 2019 Run Rate €8m above original guidance
Guidance
Increasing guidance to €40m with some additional costs43
3 Significant margin improvement
EBITDA margin evolution Delivers strong net income growth
(€mn)
60 bps 21%
140 bps
200 bps 160
17%
400bps of total improvement
2017 PF Cost Synergies Lean & Value Initiatives Operating Leverage 2022E
EBITDA evolution
(€mn)
351
199
2017 PF 2018E 2019E 2020E 2021E 2022E 2018E 2019E 2020E 2021E 2022E
EBITDA margin improvements driven by synergies, lean & value initiatives and operating leverage44
4 Strong cash flow generation to fund
value accretive initiatives
… will result in strong deleveraging and
Significant free cash flow(1) generation…
dividend distribution
(€mn) NFD / Adjusted EBITDA
247
152 3.3x
2.8x
2.5x
3.5x 3.2x 2.6x ~2.0x
2017 PF 2018E 2019E 2020E 2021E 2022E 2017PF 2018A 2019E 2020E 2022E
Actual / Guidance Shareholder agreement targets
Post merger average NWC % sales is 28% with year end NWC% Financial policy is to operate company at ≈ 2x NFD / EBITDA
sales at 26% leverage
Net working capital as % sales target improves by ~200 bps Cash allocation priorities once below agreed maximum targets in
shareholders’ agreement:
Maintenance capex remains at 3% of sales in the medium-term
Expected tax rate ±27% Dividends: €30m - €50m
Bolt-on acquisitions: €10m - €25m
Notes: (1) Defined as adj. EBITDA – Change in NWC – Capex.45
5 Solid balance sheet with currency hedge
Balance sheet Debt Structure Net debt breakdown by currency
(€bn) (%)
Long dated maturities AUD
(~7years)
1,1B 5%
Goodwill Equity 1,5B Low costs EUR
(margins of 275 bps, 225 bps
and 375 bps for EUR, USD and
AUD term loan tranches
respectively) 45%
Intangible 0,8B Non Cur.
Assets Liabilities 0,3B
50%
Covenant-lite structures
Non Cur. 0,2B NF Debt
Assets 0,7B
USD
0,6B Current Ample liquidity on the back of
Current
Liabilities two working capital facilities
Assets 0,3B
(€130m RCF and $230m ABL)
Assets Liabilities + Shareholders’ Equity
Balance Sheet includes intangible asset that will Solid balance sheet with an Natural hedge between EBITDA generated in
amortise over time with a decreasing non-cash efficient and conservative USD and AUD, and leverage raised in these
charge to the P&L, starting at 65M€ capital structure designed to currencies both protect equity value against
optimize shareholder returns strong fluctuations
Notes: USD/EUR FX of 0.87 and AUD/EUR FX of 0.62 as of 30st September 2018.46
6 Improving Return on Capital Employed
ROCE(1) Return on Sales
>18%
14%
>20%
2018E 2019E 2020E 2021E 2022E
Return on Assets
12%
>120%
82%
2018E 2019E 2020E 2021E 2022E 2018E 2019E 2020E 2021E 2022E
Significant improvements in ROCE driven by margin improvements and more efficient capital usage
Notes: (1) Defined as adj. EBITA / Cash Equity + NFD.Summary
48

Solid and balanced plan

         1    Structurally attractive industry that grows ~2xGDP

          2     Global leader in the Pool & Wellness industry with clear strategic objectives

         3    Compelling equity story with strong value creation
APPENDIX
50

                                                                                                                             2022 PLAN

Ownership structure and shareholders’ agreement

            Ownership structure                                          Shareholders’ agreement
                                               Rhône Capital:
                                               • Lock-up period until July 2020
                                               • After lock-up period:
Founding
 Families                                           -   Prohibition to sell to a single acquirer (i) more than 20% or (ii)
                                  Free float            any number of shares if this would legally oblige the acquirer to
 28.1%
                                   33.5%
                                                        launch a tender offer
                                                    -   Once funds managed by Rhône  7%:
                                                         - Free transfers: (i) transfers made through an accelerated
                                                           bookbuild offering, block trade or other similar transactions
                                                           (“ABB”) in which no single acquirer is entitled to acquire 3%
                                                           or more (ii) transfers, whether in single or several
                                                           transactions, representing a maximum aggregate of 3%
                                                           within any 6 month period
                                                         - Founding families have a right to participate on same terms /
                                                           right of first offer on both (i) and (ii)
                Rhône Capital
                  38.4%
                                                    -   Once funds managed by Rhône
51
2022 PLAN
Analyst consensus
IFRS 16 adjusted
Analyst consensus
(in € m) FY 2019 FY 2020 Contributors FY 2019 FY 2020 Contributors
Sales 1,369 1,445 6 1,369 1,440 4
Adjusted EBITDA 247 279 6 264 298 5
Adjusted EBITA 215 na 1 211 242 3
Net Working Capital 339 359 5 340 357 3
Net Financial Debt 642 551 6 693 585 3
Note: Adjusted EBITDA and EBITA includes run rate synergies and excludes non-recurring expenseFluidra 1H RESULTS 2019 August 1st 2019
1H RESULTS 2019

HIGHLIGHTS OF 1H                                                              August 1st 2019

 1. After disappointing Q1 and despite unfavorable weather conditions in the US and
    Southern Europe, Q2 has been a solid quarter. US continues to recover from the
    change in distribution patterns and gas heater plant start up.

 2. Very good progress with all synergies, achieving €21m full year run rate savings.
    We have already surpassed our full year guidance of €19m run rate cost
    synergies.

 3. Despite headwinds and weather, fundamentals of the business remain solid, and
    we are well positioned to achieve 2019 guidance; on track with 2022 Plan.

                                                                                                53
SUMMARY
1H RESULTS 2019
August 1st 2019
January-June PF PF IFRS 16
Main figures 2018 2019 PF 2019
Evol.
€M €M 19/18 €M • Sales increased by 2.4%, thus recovering from
a weak start of the season and with continued
Sales 735.6 753.2 2.4% 753.2
good performance in Europe, and an
EBITDA 137.1 142.6 4.0% 154.0 encouraging recovery in the US for Q2. Currency
EBITA 119.4 122.5 2.6% 123.5 and perimeter adjusted growth of 2.8%.
Cash EPS 0.35 0.37 4.3% 0.36 • Despite the negative leverage in the US linked
to weather, Tijuana plant and tariffs, EBITDA
expanded more than Sales due to good Gross
Net Working Capital 392.6 385.5 (1.8%) 390.3
Margin management, cautious Q2 Opex
Net Debt 729.4 740.2 1.5% 847.9 investments and synergies.
• Good management of Net Working Capital
Full year run rate synergies lowers Net Debt to €740m, flat to prior year
20.7 20.7 once adjusted for FX.
achieved
541H RESULTS 2019
August 1st 2019
INTEGRATION HIGHLIGHTS
Focus on balancing integration, synergies and continued growth of the
combined business.
INTEGRATION
Gas heater plant almost completed in Tijuana. Plant currently
manufacturing 22% more than the old San Diego plant.
Zodiac products’ European distribution center merged into Fluidra’s
distribution network.
Successful legal, systems and operations merger of South Africa.
Momentum continues in August with Australian integration. Future 2019
merger includes USA.
SYNERGIES
Integration progressing well, additional full year €4.0m run rate
synergies achieved during Q2 ‘19 that add to the €16.7m achieved up
until Q1 2019, for a total €20.7m.
We have already surpassed our guidance of €19m run rate cost
synergies by 2019, and very well positioned to achieve the €35m of our
Strategic Plan.
55SALES BY GEOGRAPHY
1H RESULTS 2019
August 1st 2019
January- PF
2019
June 2018 • Southern Europe grew by 2.6% with a very solid
evolution in France and Belgium. Adjusted for
Evol. Constant perimeter, growth was 5.9%
€M % sales €M % sales 19/18 FX
Southern Europe 294.3 40.0% 302.0 40.1% 2.6% 2.6% • Rest of Europe, outstanding performance in
Northern Europe with Germany growing c.17%.
Rest of Europe 119.7 16.3% 126.8 16.8% 5.9% 6.0% Adjusted for FX and perimeter, the increase was
6.6%.
North America 206.1 28.0% 209.3 27.8% 1.6% (4.8%)
Rest of the World 115.6 15.7% 115.1 15.3% (0.4%) 1.8% • North America started to recover from a very slow
start of the season, with standalone FX and
TOTAL 735.6 100.0% 753.2 100.0% 2.4% 0.8% perimeter adjusted Q2 growth of 12.5%.
• Rest of the World, adjusted for currency and
perimeter grew at 4.9% driven by solid
performance in Latin America, and weaker
evolution in Australia and South Africa.
561H RESULTS 2019
SALES BY BUSINESS UNIT August 1st 2019
PF
January-June 2019
2018
Evol.
• Residential Pool grew 1.7% with a very good
€M % sales €M % sales 19/18
evolution of pumps, above ground pools and pool
Pool & Wellness 706.4 96.0% 725.5 96.3% 2.7% covers. Adjusted for change in perimeter growth
would be 4.0%.
Residential 515.9 70.1% 524.7 69.7% 1.7%
Commercial 50.4 6.9% 52.3 6.9% 3.7% • Commercial Pool confirms the positive trend
shown in Q1 and good prospects for the year.
Pool Water
99.9 13.6% 105.5 14.0% 5.6%
Treatment • Pool Water Treatment evolution showed good
Fluid Handling 40.2 5.5% 43.1 5.7% 7.3% results for both chemicals and water care
equipment.
Irrigation, Industrial &
29.2 4.0% 27.7 3.7% (5.3%)
Others
• Solid performance of Pool & Wellness Fluid
TOTAL 735.6 100.0% 753.2 100.0% 2.4% Handling, with 7.3% growth.
571H RESULTS 2019
PRO FORMA PROFIT & LOSS
August 1st 2019
January- PF PF IFRS 16
June 2018 2019 PF 2019
Evol.
€M % sales €M % sales 19/18 €M
Sales 735.6 100% 753.2 100% 2.4% 753.2 • Good Sales evolution benefiting from our global
platform, recovering from the start of the season.
Gross Margin 380.2 51.7% 389.7 51.7% 2.5% 389.7
Opex before Dep. & • Gross Margin remained flat due to synergies, mix and
Amort.
241.7 32.9% 246.7 32.8% 2.1% 235.3
price increases that absorbed tariff and commodity
Provisions for Bad Debt 1.4 0.2% 2.3 0.3% 64.7% 2.3 cost increases.
EBITDA 137.1 18.6% 142.6(1) 18.9% 4.0% 154.0(1) • OPEX increased 2.1% driven by investments in our key
Depreciation 17.7 2.4% 20.1 2.7% 13.5% 30.5 commercial initiatives and merger related
inefficiencies, partially offset by cost synergies.
EBITA 119.4 16.2% 122.5 16.3% 2.6% 123.5
• EBITDA and EBITA expanded based on operating
Amortization 15.1 2.1% 31.4 4.2% 107.0% 31.4 leverage despite lower US volume.
Net Financial Result 25.2 3.4% 23.5 3.1% (7.1%) 25.8
• Amortization increased due to PPA from the Zodiac
Tax expense 22.3 3.0% 19.4 2.6% (13.1%) 19.1 merger.
Net Profit 56.7 7.7% 48.3 6.4% (14.8%) 47.3 • Good performance of Net Financial Result driven by
lower cost of debt.
(1) EBITDA for 2019 includes €2.0m of run rate synergies
58RESULTADOS 1S
1H RESULTS 2019
NET WORKING CAPITAL August 1st 2019
Net Working Capital
IFRS 16
June PF 2018 2019
2019
Evol.
€M €M 19/18 €M PF 2018
392,6
Inventory 283.7 307.2 8.3% 307.2 385,5
2019
Accounts Receivable 404.3 415.2 2.7% 415.2
Accounts Payable 295.4 336.9 14.1% 332.1
Net Working Capital 392.6 385.5 (1.8%) 390.3
• Net Working Capital evolved well thanks to the good management of Accounts Payable that helps mitigate the higher Inventories,
due to the merger start up and late start of the season.
• IFRS 16 Net Working Capital adjustment due to accounting treatment of lease discounts.
59RESULTADOS 1S
1H RESULTS 2019
NET DEBT AND FREE CASH FLOW August 1st 2019
102.4
Net Debt
IFRS 16
107.7
impact January-June PF 2018 2019
€M €M Evol. 19/18
PF 2018 EBITDA 137.1 142.6 4.0%
729,4 740,2 2019 Increase (-) / Decrease (+) NWC (82.6) (62.9) (23.9%)
Capex (-) 22.3 23.3 4.6%
Free Cash Flow 32.2 56.4 75.1%
• Great evolution of Free Cash Flow and Net Debt in Q2, driven mainly by better evolution of Net Working Capital.
• The IFRS 16 implementation adds €107.7m of lease liabilities to Net Debt.
601H RESULTS 2019
CONCLUSIONS August 1st 2019
1. After disappointing Q1 and despite unfavorable weather conditions in the US and Southern
Europe, Q2 has been a solid quarter. US continues to recover from the change in
distribution patterns and gas heater plant start up.
2. Excellent progress with synergies, achieving €21m full year run rate savings. Lifting our
guidance from €19m to €25m of run rate savings by the end of the year.
3. With a seasonal business, divestments and the integration process, some quarters may
show unusual comparisons. Well positioned to achieve our 2019 full year guidance:
Sales between €1,350 - €1,400 m
EBITDA between €240 - €260 m (€262 - €282 m post IFRS 16)
Net Debt / EBITDA ratio below 2.6x (at 2.6x post IFRS 16)
61THANK YOU!
APPENDIX (I): REPORTED PROFIT AND LOSS                                                          1H RESULTS 2019
                                                                                                    August 1st 2019

ACCOUNT

                              % of     IFRS 16   % of      Evol.
€M                    2018
                              sales     2019     sales    19/18
Sales                 450.3   100.0%    753.2    100.0%   67.3%      Fluidra’s reported P&L for 2018 is standalone
Gross Margin          227.5   50.5%     389.7    51.7%     71.3%     Fluidra.

OPEX                  161.9   36.0%     255.1    33.9%     57.5%     For 2019 it includes merged operations with all
Provision              1.4     0.3%      2.3      0.3%     60.0%     non-recurring expenses shown in the
                                                                     corresponding P&L lines. In addition, it includes
EBITDA                64.2    14.3%     132.3    17.6%    106.2%     impacts of IFRS 16.
D&A                   15.9     3.5%      61.8     8.2%    288.7%
Financial Result       4.5     1.0%      25.8     3.4%    475.3%

PBT                   43.8    9.7%      44.7     5.9%      2.1%

Taxes                 13.0     2.9%      13.2     1.8%     2.0%

Minorities             1.3     0.3%      2.7      0.4%    110.3%

NP from Cont. Oper.   29.5    6.6%      28.8     3.8%     (2.6%)

NP from Disc. Oper.    2.7     0.6%     (0.1)     0.0%    (104.3%)

Total Net Profit      32.2    7.1%      28.7     3.8%     (10.9%)

                                                                                                                         63
1H RESULTS 2019
APPENDIX (II): RECONCILIATION OF PRO FORMA
August 1st 2019
TO REPORTED SALES
€M 2018 2019
January to June 2018 Zodiac Sales are excluded
Pro forma Sales 735.6 753.2 to reconcile Pro forma to Reported Sales.
January to June Zodiac 283.8 -
In addition, due to Zodiac’s fiscal year starting in
IFRS 15 on Zodiac Sales (2.4) - October 2017, IFRS 15 had not been implemented
in 2018.
Sales of discontinued operations (Aquatron) 3.9 -
Reported Sales 450.3 753.2
641H RESULTS 2019
APPENDIX (III): RECONCILIATION OF PRO FORMA TO REPORTED August 1st 2019
EBITDA AND NET INCOME
IFRS 16
€M 2018
2019
Adjusted EBITDA 137.1 154.0 Key reconciliation items for 2018 are:
January to June Zodiac results 65.2 - • January to June 2018 Zodiac EBITDA
IFRS 15 (2.4) -
• In addition, due to Zodiac’s fiscal year starting in
Transaction related non-recurring expense 2.4 - October 2017, IFRS 15 had not been implemented in
Integration related non-recurring expense 3.6 11.7 2018.
Other & FX impact on non-recurring expense 0.8 -
• Non-recurring integration and transaction related
EBITDA discontinued operations (Aquatron) 3.3 (0.1) expenses.
Profit/Loss from sales of subsidiaries 0.0 1.2
Key reconciliation items for 2019 are:
Stock based compensation - 6.9
Run rate synergies - 2.0 • Non-recurring integration related expenses (i.e. one-
offs to capture synergies).
Reported EBITDA 64.2 132.3
Depreciation 13.9 30.5 • Stock based compensation
Amortization 2.0 31.4 • Run rate synergies, representing the half year impact
Financial Result 4.5 25.8 of synergies captured during 2019.
Tax expense (income) 13.0 13.2 Key below Reported EBITDA items are the captions
Minority Interest 1.3 2.7 already shown in 2018 FY results.
Reported Net Profit from continued operations 29.5 28.8
65RESULTADOS 1S
1H RESULTS 2019
APPENDIX (IV): REPORTED BALANCE SHEET August 1st 2019
IFRS 16 IFRS 16
ASSETS LIABILITIES
06/2018 06/2019 06/2018 06/2019
PPE & rights of use 98.0 222.1 Share capital 112.6 195.6
Goodwill 178.0 1,094.0 Share premium 92.8 1,148.6
Other intangible assets 28.9 761.3 Retained earnings 169.3 129.5
Other non-current assets 25.5 96.5 Treasury shares (8.0) (10.4)
Total non-current assets 330.5 2,173.9 Other Comprehensive Income (1.9) (16.3)
Minorities 9.6 7.4
Total Equity 374.4 1,454.4
Bank borrowings + Loans 4.4 854.7
Other non-current liabilities incl. lease 56.8 330.0
Non-curr. assets held for sale 37.2 - Total non-current liabilities 61.2 1,184.6
Inventory 194.5 307.2 Liab. linked to non-curr. assets held for sale 7.7 -
Accounts Receivable 270.1 415.2 Bank borrowings + Loans 266.4 68.3
Other current assets 7.0 8.8 Accounts payable 176.9 332.1
Cash 52.6 183.7 Other current liabilities incl. lease 5.3 49.3
Total current assets 561.4 914.9 Total current liabilities 456.3 449.7
TOTAL ASSETS 891.9 3,088.7 TOTAL EQUITY & LIABILITIES 891.9 3,088.7
66CONTACT +34 93 724 39 00 Investor_relations@fluidra.com Avda. Francesc Macià 60, planta 20 - 08208 Sabadell (Barcelona) www.fluidra.com
You can also read


