Youth unemployment in Greece: measuring the challenge
←
→
Page content transcription
If your browser does not render page correctly, please read the page content below
Bell and Blanchflower IZA Journal of European Labor Studies 2015, 4:1
http://www.izajoels.com/content/4/1/1

 ORIGINAL ARTICLE                                                                                                                               Open Access

Youth unemployment in Greece: measuring the
challenge
David NF Bell1* and David G Blanchflower1,2,3

* Correspondence:
d.n.f.bell@stir.ac.uk                    Abstract
1
 Division of Economics, Stirling
Management School, University of         A historically high level of youth unemployment presents Greece with a huge social
Stirling, Stirling, UK                   and economic challenge. This paper analyses various dimensions of this challenge.
Full list of author information is       We argue that though the conventional definition of “youth” is the 16-24 age group,
available at the end of the article
                                         there is a strong case for considering 25 to 29-year-olds as sharing common problems
                                         with conventionally defined youth. There are also grounds for examining why
                                         females seem to fare worse than males in the Greek labour market. The negative
                                         effects of the recession on Greek well-being have affected all age groups.
                                         JEL codes: J19; J21; J30; J64
                                         Keywords: Unemployment; Youth; Labor market; Well-being; Happiness;
                                         Life satisfaction; Great recession

                                       1 Introduction
                                       Youth unemployment is one of the principal economic and social problems of this dec-
                                       ade. It has grown rapidly since the onset of the Great Recession. In a European con-
                                       text, its growth has been concentrated in Southern Europe and particularly in Greece
                                       and Spain, where more than half of young people in the labour force are unemployed
                                       (Table 1). Of interest, though, is the fact that in some countries like the UK and
                                       Sweden, the ratio of youth to adult unemployment rates is close to four, whereas in
                                       Greece and Spain it is closer to two. High relative and absolute youth unemployment
                                       rates are both likely to be a cause for concern.
                                         At the time of writing, August 2014, the average youth unemployment rate in the
                                       European Union was 23.1% and 23.9% in the Eurozone. In total, there were 5.13 million
                                       people under the age of 25 in Europe who were unemployed. Of these, 16% were in
                                       Spain, 16% were in the UK, 14% were in Italy and 12% were in France. But, while it is as-
                                       sociated often with the very high youth unemployment rates, only 3% (169,000) of
                                       Europe’s young unemployed are residents in Greece.
                                         Youth unemployment has been the subject of three major NBER studies by Freeman
                                       and Wise (1984), Freeman and Holzer (2000) and Blanchflower and Freeman (2004),
                                       where major figures in labour economics have given their views on how the youth labour
                                       market works and what to do about youth unemployment. The most important finding
                                       from these studies is that long spells of unemployment when you are young creates
                                       permanent scars rather than temporary blemishes. Bell and Blanchflower (2011a, 2011b)
                                       find similar results in the UK in the current recession. Recent work by Kahn (2010)
                                      © 2015 Bell and Blanchflower; licensee Springer. This is an Open Access article distributed under the terms of the Creative Commons
                                      Attribution License (http://creativecommons.org/licenses/by/4.0), which permits unrestricted use, distribution, and reproduction in any
                                      medium, provided the original work is properly credited.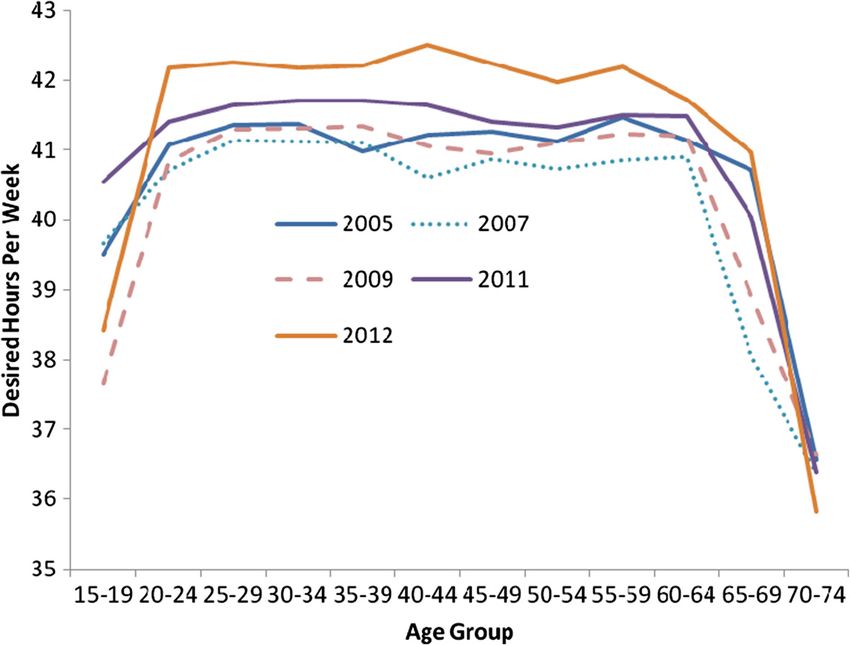
Bell and Blanchflower IZA Journal of European Labor Studies 2015, 4:1                                                                       Page 2 of 25
http://www.izajoels.com/content/4/1/1

                 Table 1 Youth and adult unemployment rates, June 2014
                                                           25-74 year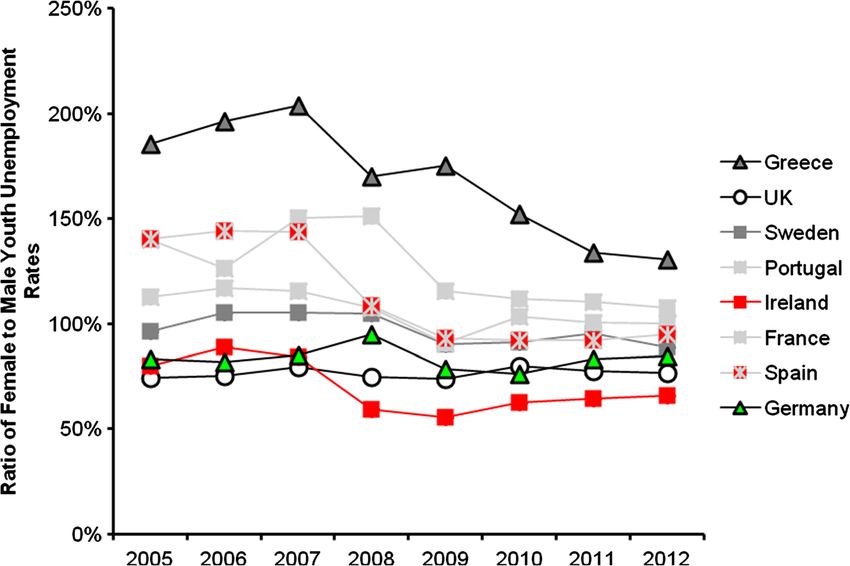
Bell and Blanchflower IZA Journal of European Labor Studies 2015, 4:1                                          Page 3 of 25
http://www.izajoels.com/content/4/1/1

                    Youth joblessness has been a problem in many countries for several decades. It
                 has been the subject of a wide range of policy interventions. Yet the accumulated
                 wealth of policy experience failed to prevent a rapid rise in youth unemployment
                 during the so-called “Great Recession”. The rise was especially marked in Ireland,
                 Portugal, Spain and Greece, and as we show below, in the Great Recession, it has
                 reached unprecedented levels. This raises serious questions about the relevance of
                 past policy lessons to the present predicament of the youth labour market. Should
                 we discount these past lessons, and what can we learn about future policy from re-
                 cent experience?
                    Changes in educational participation influence the size of the youth labour market
                 and, therefore, youth unemployment rates. Thus, voluntary or mandatory increases in
                 educational participation could potentially increase the youth unemployment rate with-
                 out any increase in the number of young people seeking work. On the other hand, in-
                 creased educational participation might have no effect on the youth unemployment
                 rate. This is because many students, particularly part-timers, actively participate in the
                 labour market. In addition, the youth unemployment rate does not capture those young
                 people who neither participate in the labour market, nor in education. The so-called
                 NEETs (young people not in education, employment or training) are drawn from both
                 the unemployed and the inactive youth.
                    There are a number of reasons why youth unemployment rates may be higher than
                 adult rates. In the internal labour market, youths will generally have less specific human
                 capital relevant to the particular firm for whom they work and also less general work
                 skills. Even without a formal last-in first-out (LIFO) policy, firms may take the view that
                 the future benefit of further investment in young workers is outweighed by its current
                 costs. Further, liquidity concerns cause firms to seek layoffs among younger workers
                 first, particularly where statutory redundancy payments are seniority weighted, as is the
                 case in most countries.
                    In the external labour market, young workers may be less efficient in job search
                 activities than adults. Younger workers are likely to have fewer contacts and less
                 experience finding work, placing them at a relative disadvantage compared to
                 adults. They may also find themselves in an experience trap, where employers
                 select workers with experience, and as a result, labour market entrants are never
                 hired and cannot increase their own experience. On the supply side, youths are less
                 likely to have significant financial commitments than their elders. And their par-
                 ents may be willing to support them should they not find work. Such factors may
                 create an incentive to restrict their job search activity, leading to higher rates of
                 unemployment. Whether the cause is on the demand or the supply side, the
                 outcome is that youths experience considerably higher rates of unemployment
                 than adults.
                    We proceed as follows. First, we examine the impact of Labour Market Programmes.
                 Second we compare Greek youth unemployment with the experiences of seven other
                 countries – France, Germany, Ireland, Portugal, Spain, Sweden and the UK. Third, we
                 look at the treatment of students in labour market statistics. Fourth, we look at those
                 Not in Employment, Education or Training (NEETS), some of whom are not picked
                 up in the unemployment count. We then look at the rising trend among young
                 people to continue living in the parental home. The next three sections look at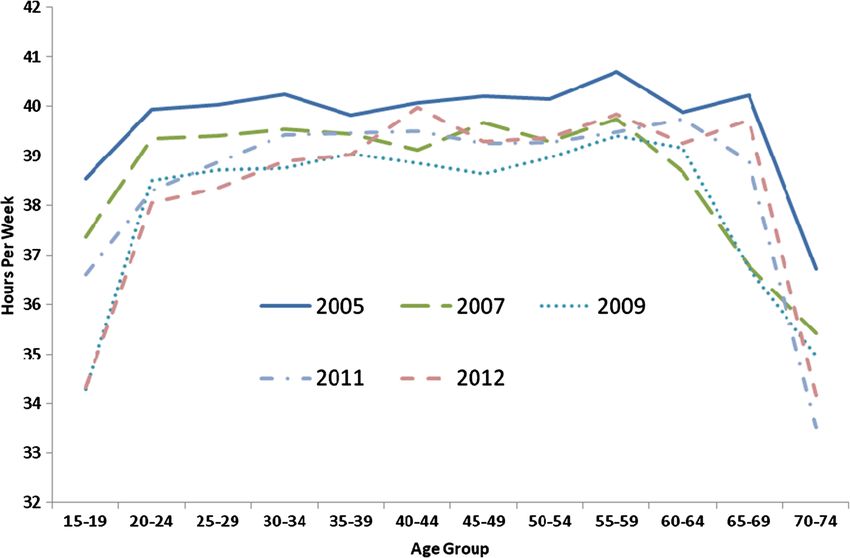
Bell and Blanchflower IZA Journal of European Labor Studies 2015, 4:1                                         Page 4 of 25
http://www.izajoels.com/content/4/1/1

                 underemployment, long-term unemployment and the well-being of the young. The final
                 section draws some conclusions.

                 2 Active Labour Market Programmes (ALMPs)
                 In response to the substantial increases in youth unemployment during the 1980s and
                 early 1990s, there was a significant increase in policy initiatives targeted at unemploy-
                 ment in general and youth unemployment in particular. These culminated in the
                 OECD Jobs Study (1994), which argued that policies to improve the working of the
                 labour market were critical for reducing high levels of youth unemployment. It sug-
                 gested that:

                    “A progressive shift of resources is needed from passive income support to active
                    measures. Active labor market policies improve access to the labor market and
                    jobs; develop job-related skills; and promote more efficient labor markets.”
                    (OECD Jobs Study 1994)

                    With OECD encouragement, many member countries introduced a range of active
                 labour market policies (ALMPs). These were extensively evaluated to determine their
                 labour market effects. In this context, “evaluation” tends to mean comparisons between
                 those “treated” by a particular intervention and a comparable “control” group that are
                 not “treated”. Such evaluations can be described as partial equilibrium in the sense
                 that they focus on a narrow range of outcomes (e.g. difference in the probability of
                 finding full-time employment between the treated and untreated) in distinct sub-
                 populations of the labour force. On the other hand, models that take a broader macro-
                 economic perspective tend to be insufficiently disaggregated to capture the general
                 equilibrium impacts of ALMPs.
                    Even these partial equilibrium evaluations of ALMP impact have not shown them to
                 be an unqualified success. Heckman and Smith (1999a, 1999b) examined the US Job
                 Training Partnership Act (JTPA), which provided job-training services for economically
                 disadvantaged adults and youth, dislocated workers and those facing significant em-
                 ployment barriers. They found that the estimates of the returns to training were sensi-
                 tive to a) the set of training centers included in the evaluation, b) how outliers in the
                 earnings data are handled, c) the construction of the earnings data, d) control group
                 substitution and e) treatment group drop out. Even after these adjustments, they con-
                 clude that their results for youth “fit comfortably into the pattern of several decades of
                 research that finds very limited earnings effects for the types of services offered by
                 JTPA”. In 1996, when asked by the Economist how much training schemes in the
                 US help their clientele, Jim Heckman replied that ‘zero is not a bad number’ (Economist,
                 6th April, 1996).
                    Grubb (1999) is slightly more positive when reviewing US education and training
                 programmes for disadvantaged youths. He argues that successful programmes embody
                 some combination of the following characteristics:

                    i) Close links with the local labour market, targeting jobs with relatively high wages,
                        strong employment growth and opportunities for advancement;
                    ii) A mix of academic education, occupational skills and on-the-job training;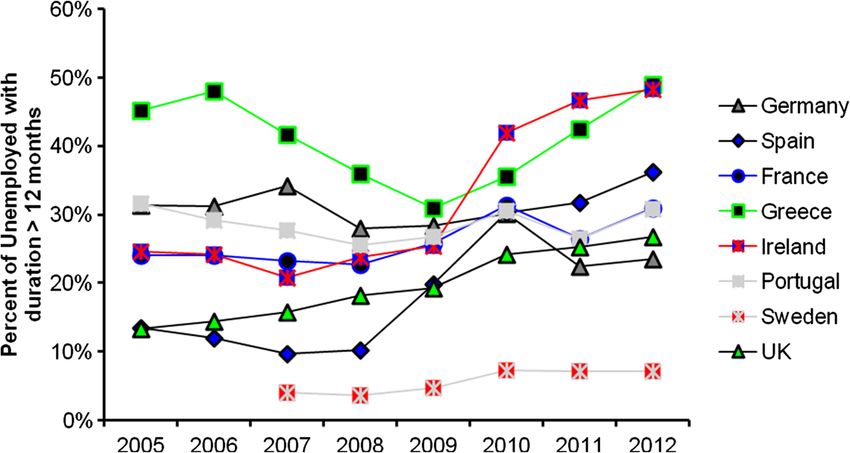
Bell and Blanchflower IZA Journal of European Labor Studies 2015, 4:1                                            Page 5 of 25
http://www.izajoels.com/content/4/1/1

                    iii) Opportunities to enter further education, to further develop skills and competencies;
                    iv) Support services focused on the needs of clients and their families; and
                    v) Constant redesign of the programmes to learn from past experience.

                    Auspos et al. (1999) conclude that European ALMPs have not produced earnings
                 gains for participants, but argue that smaller targeted schemes aimed at disadvantaged
                 groups are more effective in raising employment than broad-based training pro-
                 grammes, particularly when used in conjunction with job search interventions. Success-
                 ful programmes tend to be costly and may be difficult to expand broadly. Bergemann
                 and van den Berg (2006) argue that training programmes are more effective for women
                 than men in Europe. Focussing on youth, Calmfors et al. (2002) summarize the Swedish
                 experience of ALMPs by arguing that youth programmes have caused substantial dis-
                 placement effects, but the gains for participants are uncertain.
                    Card et al. (2009) carry out a meta-analysis of ALMPs. They examine 199 pro-
                 grammes drawn from 97 studies over the period 1995 to 2007. These are heteroge-
                 neous programmes covering classroom and work experience, job search assistance, and
                 subsidized public and private employment programmes. Assessments of their short-run
                 effects showed that the number of programmes with a significantly positive outcome
                 only exceeds those with a significantly negative outcome by a small margin. Over lon-
                 ger time horizons, the balance is more in favour of positive outcomes. There are also
                 significant differences between countries in the types of programmes which succeed or
                 fail. There is no upward trend over time in positive outcomes. The evaluations contain
                 little information on costs, making it difficult to establish how affordable large-scale ex-
                 pansion of successful programmes might be. The Card et al. study supports Grubb and
                 Martin’s (OECD 2001) conclusion that, “one of the most disappointing conclusions
                 from the evaluation literature is that almost all evaluations show that special measures
                 are not effective for disadvantaged youths.”
                    In 2011, the EU launched the Youth Opportunities Initiative. This was added to in
                 December 2012 by the Youth Employment Package. The Youth Employment Package
                 proposed a youth guarantee, which the council recommended to the member states in
                 April 2013. Specifically, the recommendation was that the member states of the
                 European Union should “ensure that all young people under the age of 25 receive good
                 quality offer of employment, continued education, apprenticeship or a traineeship with
                 enough period of four months of becoming unemployed or leaving formal education”
                 (Council of the European Union, 2013). The Council created the Youth Employment
                 Initiative, through which €6 billion will be made available to NUTS 2 regions with a
                 youth unemployment rate above 25% in 2012. These monies have to be distributed be-
                 tween 2014 and 2016.
                    The Youth Guarantee is intended to provide young people with a job, training or
                 education over a defined period. The entitlement is generally given by public institu-
                 tions such as the public employment service, sometimes acting in concert with private
                 or third sector organizations. The role of the public employment service varies by
                 country within Europe. In many countries, private employment agencies have an in-
                 creasing role alongside the public employment service. As Kluve (2010) notes, depend-
                 ing on the incentives that they face, private sector agencies are likely to focus on those
                 that are relatively easy to place, leaving the public agencies with the more difficult
Bell and Blanchflower IZA Journal of European Labor Studies 2015, 4:1 Page 6 of 25
http://www.izajoels.com/content/4/1/1
cases, which are often characterized by social and health problems. Success with such
groups will depend on the professionalisation and training of PES staff. Pastore (2013a)
notes that in contrast to the Nordic countries, which is the model the Youth Guarantee
is based on, private and public employment services in Southern European countries
are very weak and concludes that this jeopardizes the chances of success for the Youth
Guarantee in Southern Europe.
Greece is intending to implement a national youth action plan using €517 million,
with the aim of benefiting up to 350,000 young people. Measures under the plan include a
temporary hiring programme for unemployed persons below the age of 35 in community-
based work programmes. In July 2013, it introduced a youth internship and employment
voucher programme under the youth action plan aimed at supporting occasional training
and internships for a six-month period for 45,000 people up to the age of 29. A sum of €1.2
billion is being allocated to help small and medium-sized companies meet liquidity require-
ments and, thus, assist with the expansion of youth employment. It is too early to say
whether any of these schemes are working or are likely to make any significant inroads into
the youth unemployment problem if the main failure is a lack of aggregate demand.
3 Greek youth unemployment in context; comparisons with seven other
countries – France, Germany, Ireland, Portugal, Spain, Sweden and the UK
In this section, we lay out some key facts on youth unemployment in Greece and place
them in context. We do this from both a time-series and cross-sectional perspective.
Specifically, we use aggregate data from Eurostat publications and micro-data from the
2005-2012 European Labour Force Survey to examine trends in unemployment, both
in Greece itself and also in comparison with a selection of other European states. For
these comparisons, we have selected Spain and Portugal as Southern European coun-
tries that, like Greece, have experienced serious monetary disturbances as well as
labour market dislocation. Although it is not in Southern Europe, we include the Re-
public of Ireland for the same reasons. Though having a stable macroeconomic frame-
work in recent years, Sweden has experienced persistently high levels of youth
unemployment, especially relative to adult rates, and has also been included. Finally, we
add the three largest countries in Europe - Germany, the UK and France - to give a
perspective on unemployment trends in the European Union as a whole. These coun-
tries also span a variety of experiences during the recession, including wide variations
in labour market performance. A referee has pointed out to us that, these eight coun-
tries span quite different school-to-work transition patterns: a) France, Greece, Spain,
Portugal are the Mediterranean rim; b) Sweden represents the Scandinavian model; c)
UK and Ireland represent the Anglo-Saxon model; and d) Germany is an example of the
Central European or Bismarckian model.
The conventional measure of “youth” is the age group 16-24. However, there is a
strong case for arguing that the labour market experience of “young adults” aged 25-29
in 2014 is quite similar to that of youth during the Great Recession. This is appropriate
because these individuals in their late twenties were 19-23 in 2008 when the recession
hit. Where we can, we also include information for this age group. The age group dif-
ferences are captured in Figures 1 and 2, which show unemployment rates and employ-
ment to population ratios, respectively, for 15-19, 20-24 and 25 to 29-year-olds. These
capture the extent of the unemployment problem and the weakness of the GreekBell and Blanchflower IZA Journal of European Labor Studies 2015, 4:1 Page 7 of 25
http://www.izajoels.com/content/4/1/1
Figure 1 Unemployment rates by age group: Greece 2005-2012. Source: Eurostat.
labour market for young people. The unemployment rates for youth in particular have
captured worldwide attention and are deemed to be a potential cause of social
instability. However, Figures 1 and 2 also show that the Greek labour market is not
working well for 25 to 29-year-olds. Though the increase between 2005 and 2012 in
the unemployment rate of this group (22 per cent) was smaller than that of 20 to 24-
year-olds (29 per cent) and of 15 to 19-year-olds (32 per cent), the 25-29 age group
experienced the largest fall in the employment to population ratio over the period: a
larger proportion of this age group became unemployed or inactive between 2005 and
2012 compared to 15 to 19-year-olds and 20 to 24-year-olds.
Figures 1 and 2 focus on differences in labour market outcomes by age group. Table 2
contains the information which explains how differences in rates relate to the absolute
numbers of employed, unemployed and inactive by age group. It also introduces the
gender dimension, which is an important source of variation in the labour market ex-
perience of young people in Greece. Thus, the top panel of Table 2 shows population,
Figure 2 Employment as a share of population ratios (E/POP) by age group: Greece 2005-2012.
Source: Eurostat.http://www.izajoels.com/content/4/1/1
Bell and Blanchflower IZA Journal of European Labor Studies 2015, 4:1
Table 2 Population, employment and unemployment by year, age group and gender: Greece 2005-2012 (Thousands)
Population Employment Unemployment
Males Females Males Females Males Females
Age 15-19 20-24 25-29 15-19 20-24 25-29 15-19 20-24 25-29 15-19 20-24 25-29 15-19 20-24 25-29 15-19 20-24 25-29
Year
2005 281 333 408 281 334 389 26 159 335 13 109 235 8 34 37 11 54 64
2006 287 323 415 289 314 382 27 154 341 13 100 240 9 30 37 9 51 58
2007 281 309 419 287 295 377 27 146 340 13 95 236 6 26 41 8 44 55
2008 273 304 410 285 285 373 23 141 335 13 93 237 6 28 37 7 36 50
2009 270 294 404 278 280 362 22 134 321 11 90 230 6 31 44 8 43 53
2010 273 280 381 267 282 358 16 119 289 9 80 215 9 41 56 8 53 67
2011 280 266 377 270 271 342 13 94 250 5 65 180 12 55 88 11 63 92
2012 275 265 366 271 266 325 11 76 211 4 50 159 14 67 116 15 77 106
Activity Rate (%) EPOP Rate (%) Unemployment Rate (%)
2005 12 58 91 9 49 77 9 48 82 5 33 60 24 18 10 46 33 21
2006 13 57 91 7 48 78 9 48 82 4 32 63 25 16 10 42 34 19
2007 12 56 91 7 47 77 9 47 81 5 32 63 19 15 11 37 31 19
2008 11 56 91 7 45 77 9 46 82 5 33 64 19 17 10 36 28 17
2009 11 56 90 7 48 78 8 46 79 4 32 64 22 19 12 43 33 19
2010 9 57 91 6 47 79 6 43 76 3 28 60 35 25 16 45 40 24
2011 9 56 90 6 47 80 5 35 66 2 24 53 48 37 26 68 49 34
2012 9 54 89 7 48 82 4 29 58 1 19 49 56 47 35 79 61 40
Page 8 of 25Bell and Blanchflower IZA Journal of European Labor Studies 2015, 4:1 Page 9 of 25
http://www.izajoels.com/content/4/1/1
employment and unemployment by 5-year age group and gender for the period 2005 to
2012 in thousands. The bottom panel shows equivalent activity rates, employment to
population ratios, and unemployment rates based on these numbers.
Though 15-19 year olds have the highest unemployment rates in 2012 (56% for males
and 79% for females), this age group has low, and declining, rates of labour market par-
ticipation between 2005 and 2012. When levels of participation are low, high un-
employment rates can be consistent with relatively small absolute numbers of
unemployed people. This is the case for this age group. Employment to population ra-
tios are much higher among those aged 25-29, and unemployment rates are lower than
among the younger age groups.
With Greece, as in most developed countries, inactivity tends to decline with age up
to around age 30 as individuals move from education into the labour market. Without
information on participation, high unemployment rates may give a misleading impres-
sion of absolute levels of unemployment. Despite the fact that the unemployment rate
for 25 to 29-year-olds was only 57 per cent of that for 15 to 19-year-olds, there were
7.7 unemployed persons aged 25-29 for each unemployed person aged 15-19 in 2012.
And the absolute numbers unemployed in the 25-29 age group (222,000) exceeded the
number unemployed in the entire 16-24 age group (173,000) by 28 per cent. This sug-
gests that policy focus on the 16 to 24-year-olds may have to be supplemented by mea-
sures aimed at 25 to 29-year-olds to have a significant impact on unemployment
among young people (broadly defined) in Greece.
The size of the youth cohort in Greece is declining. Between 2005 and 2012, the
Greek population aged 15-19 fell by 2.8 per cent. The number in the 20-24 age group
fell by 20.5 per cent, while those aged 25-29 fell by 13.4 per cent. This is a staggering
decline over such a short period. It represents the effects of falling cohort size (as
among the relatively immobile 15 to 19-year-olds) and net emigration, which explains
the much greater reduction in cohort size among the more mobile 20 to 29-year-olds.
It appears that there is going to be a rapid decline in the number of young Greeks
through 2020 (See Figure 3).
There are surprising differences in population trends by gender. First, whereas num-
bers of males and females in the population are broadly balanced in the 15-19 and
20-24 categories, as one would expect, there appears to be a growing imbalance be-
tween those in the 25-29 age group, with the number of males exceeding females by
Figure 3 Size of youth cohort by country: 2000-2020.Bell and Blanchflower IZA Journal of European Labor Studies 2015, 4:1 Page 10 of 25
http://www.izajoels.com/content/4/1/1
around 40,000 in 2012. This may be due to higher levels of net emigration by females.
In turn, higher emigration rates may be a response to poorer labour outcomes for fe-
males. Female activity rates and employment to population ratios are consistently
lower, and unemployment rates higher, than those for males in the Greek labour mar-
ket. In 2012, the unemployment rate for females aged 15-19 was 23% above that for
males, while for those aged 20-24 and 25-29, the equivalent margins were 14% and 5%.
Female youth unemployment rates are significantly higher than those for males. In this
respect, Greece is an outlier among our selection of nations, as is clear from Figure 4,
which shows the ratio of female to male youth unemployment rates in each country for
the period 2005 to 2012.
It should be noted, though, that in contrast to the United States and Canada, where
male rates are higher than female rates, female unemployment rates are higher than
male rates in both the EU and the Eurozone; this seems particularly the case in
Southern Europe. In the latest data release from Eurostat, female unemployment rates
were higher than male unemployment rates in ten countries: Austria, Czech Republic,
Greece, Hungary, Italy, Luxembourg, Poland, Portugal, Slovenia and Spain.1 Though
there is clearly a tendency towards convergence of youth unemployment rates by gen-
der between 2012 and 2015, southern European countries typically have female youth
unemployment rates that are significantly higher than their male equivalents, with
Greece being the most extreme case. The ratio has narrowed since the beginning of the
recession, but it still exceeds those in our comparison countries. The large number of
females among the unemployed may have conditioned the social and political response.
The issue of the relative importance of youth unemployment is generally addressed
by considering the ratio of the youth unemployment to the adult rate (where adults are
usually defined as the age group from age 25 to age 64). Figure 5 shows both the youth
unemployment rate and this ratio for each of our eight countries for available time pe-
riods. As mentioned previously, there are a variety of reasons why one would expect
Figure 4 Ratio of youth unemployment rates by gender. Source: European Labour Force Survey.Bell and Blanchflower IZA Journal of European Labor Studies 2015, 4:1 Page 11 of 25
http://www.izajoels.com/content/4/1/1
Greece France
Spain Sweden
Germany UK
Portugal Ireland
Figure 5 Youth unemployment rates and ratios. Source: OECD.
youth unemployment rates would be higher than adult rates. But there are also very
substantial differences between countries in the ratio of youth to adult unemployment,
which suggests a significant degree of variation between countries in the circumstances
facing new entrants to the labour market compared with incumbents. It is not the case
that the countries with the highest youth unemployment rates also have the highest ra-
tios of adult to youth unemployment. In 2012, Sweden (2.9) and the UK (2.6) had
somewhat higher ratios than did Greece (2.3). Spain (2.1) and Portugal (2.3) also hadBell and Blanchflower IZA Journal of European Labor Studies 2015, 4:1 Page 12 of 25
http://www.izajoels.com/content/4/1/1
relatively low youth to adult unemployment rate ratios. The concern is that social un-
rest can occur, as it has in both the UK and Sweden, where relative youth unemploy-
ment rates are especially high. It is OK if everyone is in it together but not if the young
seem in a much worse situation than everyone else. In the case of Sweden, the unrest
occurred especially among immigrants.
4 Students
Under ILO definitions, full-time students may be classified as employed or un-
employed. Their ability to operate in the labour market is more constrained than their
non-student peers. Typically they work part-time during term or perhaps full-time dur-
ing vacations. Students who work part-time are counted as employed by standard ILO
definitions; students who are looking for work are similarly counted as unemployed.
Student participation in the labour market tends to focus on meeting short-term liv-
ing costs rather than long-term career aspirations. Comparisons of youth unemploy-
ment over time or across countries can be influenced by the extent of participation in
tertiary education. Participation will be affected both by the supply of places and the
opportunity costs of attendance. The interaction between student and labour market
status is shown in Table 3, which compares labour market and educational status in
Greece, for simplicity, with the UK in 2012. We present numbers (in thousands)
employed, unemployed and inactive alongside the unemployment for the age group 15-
29. We provide these estimates separately for students and non-students. It is apparent
that, in Greece, few students are also participating (part-time) in the labour force,
whereas this is a major phenomenon in, for example, the UK.
Unemployment rates for students are somewhat higher than are those for non-
students in both Greece and the UK. However, this has little effect on the overall un-
employment rate in Greece because relatively few students are involved in the labour
market. Similar observations can be made about Portugal and Spain, which have relatively
high student unemployment rates that have little impact on the overall youth unemploy-
ment rate because student participation in the labour market is limited. Overall, students
account for nearly double the share of employment (24.4%) in northern European
countries – Sweden, the UK, Ireland, France and Germany – than they do in the
southern countries – Greece, Spain and Portugal (12.5%).
5 Those Not in Employment, Education or Training (NEETS)
Table 3 and Figure 6 also provide information on NEETS – those not in employment,
education or training. These comprise the unemployed plus inactive non-students.
Their number can be calculated and expressed as a share of the population, which gives
the NEET “rate” as shown for each country panel in Table 3. NEETs comprise a much
larger share of the population in Greece than, for example, in the UK, Germany or
France. NEET rates in Greece exceed those in other crisis hit countries such as Spain,
Portugal and Ireland. The inactive members of this group present a more difficult
policy challenge since they are not actively seeking work, not enhancing their specific
or general human capital, and not improving their strategies for engagement with
the labour market. The NEET rate in Greece has overtaken that in many other European
economies. Figure 7 plots the per cent of NEETS by the two young age groups 15-19 and
20-24 for each of our eight countries. The unemployment rate for the youngest age group,http://www.izajoels.com/content/4/1/1
Bell and Blanchflower IZA Journal of European Labor Studies 2015, 4:1
Table 3 Unemployment, NEET and educational status in selected European countries among those aged 16-29, 2012 (thousands)
Greece Student Non-student Total Portugal Student Non-student Total Spain Student Non-student Total
Employed 32 479 511 Employed 89 652 742 Employed 346 2,120 2,466
Unemployed 36 359 396 Unemployed 57 224 281 Unemployed 372 1,394 1,766
Inactive 729 131 860 Inactive 681 94 776 Inactive 2,674 519 3,193
Total 676 970 1,646 Total 701 970 1,671 Total 3,016 4,033 7,049
Unemployment Rate 53.5% 42.8% 43.6% Unemployment Rate 38.8% 25.5% 27.4% Unemployment Rate 51.8% 39.7% 41.7%
NEET Rate 27.8% NEET Rate 17.7% NEET Rate 25.8%
Germany Student Non-student Total France Student Non-student Total Sweden Student Non-student Total
Employed 2,797 5,423 8,221 Employed 793 4,224 5,017 Employed 229 731 960
Unemployed 127 517 644 Unemployed 92 1,004 1,096 Unemployed 92 110 202
Inactive 4,646 863 5,509 Inactive 4,208 885 5,093 Inactive 582 93 675
Total 7,416 6,803 14,218 Total 5,093 6,113 11,206 Total 819 934 1,753
Unemployment Rate 4.3% 8.7% 7.3% Unemployment Rate 10.4% 19.2% 17.9% Unemployment Rate 28.7% 13.0% 17.4%
NEET Rate 9.6% NEET Rate 16.9% NEET Rate 11.0%
Ireland Student Non-student Total UK Student Non-student Total
Employed 71 315 386 Employed 1,422 5,733 7,154
Unemployed 14 102 116 Unemployed 312 992 1,304
Inactive 299 92 391 Inactive 2,985 1,019 4,004
Total 333 509 842 Total 4,591 7,744 12,335
Unemployment Rate 16.7% 24.5% 23.2% Unemployment Rate 18.0% 14.8% 15.4%
21.7% NEET Rate 16.1%
Page 13 of 25Bell and Blanchflower IZA Journal of European Labor Studies 2015, 4:1 Page 14 of 25
http://www.izajoels.com/content/4/1/1
Figure 6 Percent NEET (Not in Employment, Education or Training) by country and age group 2013.
Source: Eurostat.
those aged 15-19, is lower in Greece than in both Spain and Ireland, while the two older
groups have higher unemployment rates than in any of the other countries. The NEETs
problem in Greece looks to require urgent attention, but it is also relatively intractable. As
mentioned in our discussion of ALMPs, private sector agencies tend to avoid the most
hard to reach cases, and the public sector may not have the resources to support the level
of intervention necessary to match such individuals with employment opportunities.
6 Living in the parental home
How far are the costs of unemployment or inactivity mitigated by remaining in the par-
ental home? There are substantial differences across Europe in the extent to which par-
ents and children are willing to share accommodation once a child has completed
secondary education. Compared with other Europeans, Greeks shows a high willingness
to maintain inter-generational households. Table 4 shows the relationship of individuals
in the 15-24 age group that are unemployed or inactive to the household reference
Figure 7 Share of unemployed out of work for more than one year. Source: Eurostat.Bell and Blanchflower IZA Journal of European Labor Studies 2015, 4:1 Page 15 of 25
http://www.izajoels.com/content/4/1/1
Table 4 Proportion of those aged 15-29 with parents not in the same household
Ages 15-19 Ages 20-24 Ages 25-29
Greece UK Greece UK UK
Total Males Females Total Total Males Females Total Total Males Females Total
2005 7.5 6.3 8.8 7.9 31.0 26.8 35.1 49.9 41.7 31.2 52.6 81.0
2006 6.8 5.6 7.9 7.3 30.1 25.3 35.1 48.6 39.9 29.4 51.3 81.3
2007 6.8 5.6 8.0 7.3 31.6 28.5 34.8 49.7 38.3 29.4 48.1 80.5
2008 6.8 6.0 7.5 8.5 33.6 30.4 37.0 48.6 38.0 30.4 46.2 79.7
2009 7.1 6.0 8.2 8.5 36.1 32.3 40.0 47.4 40.5 33.0 48.9 78.5
2010 6.3 5.2 7.5 8.9 33.0 28.2 37.8 47.2 41.4 32.3 51.1 78.4
2011 6.7 6.0 7.5 8.3 30.5 25.6 35.3 50.1 39.3 31.9 47.4 81.1
2012 6.2 5.4 7.1 8.4 30.0 27.7 32.3 45.7 36.2 30.0 43.3 79.5
Source: European Labour Force Survey.
person before and after 2008 in Greece and the UK. We report the proportion of those
aged 15-19, 20-24 and 25-29 who are not living with their parents from 2005 to 2012.
We see very little change for the youngest two age groups: all the action is for the older
group aged 25-29. In the UK, the proportion falls slightly from 81% to 80%, but in Greece
it falls from 42% to 32%. So, only one out of three 25 to 29-year-olds in Greece live away
from home, whereas in the UK, four out of five have left home. In part, this is likely to
reflect lack of jobs but also in part the inflexibility of the housing market. Blanchflower
and Oswald (2012) found that the highest home ownership rates in the OECD are in
Spain and Greece; unemployment appears to be positively correlated with home owner-
ship rates. Of particular importance here then is the lack of a private rental sector that al-
lows young people to move to where the jobs are. The housing market is a major rigidity
impacting the Greek labour market, in that it appears to lower mobility.
To explore these issues further, in Table 52, we compare likelihoods of living away
from home among those aged 15-29 in Greece and the other seven countries by gender
over the period 2005-2012. The purpose is to investigate whether there were significant
differences by age group, gender, employment status and across country in propensity
to stay with parents. Assuming that parents do not move to facilitate the employment
prospects of the young, the effects of staying at home may be to reduce the costs of un-
employment or inactivity on the one hand, but to restrict opportunities for searching
on the other. We estimated probit regressions where living away from the parental
home is the dependent variable. We include two age controls and dummies for whether
the individual is a NEET, a student, for the recession years 2008-2012 and an inter-
action term recession*NEET. We find that, in Greece, and to an even greater extent in
Spain and Portugal, the probability of 20 to 24-year-olds, and to a lesser extent 25 to
29-year-olds, living with their parents is significantly higher than in the other five coun-
tries included in our comparison group, including Ireland. For example, in Greece, the
probability of a 25 to 29-year-old male not living with their parents is 45% (55%) higher
than for 15 to 19-year-olds, compared with 20% (28%) in Portugal and 23% (33%) in
Spain (females rates in parentheses). So females are more likely to have left home in
these three countries than are males. In France, Germany and the UK, around 70% of
both males and females aged 25-29 had left home, so in these countries, there was little
evidence of substantial gender differences in the home leaving rate. Table 6 exploreshttp://www.izajoels.com/content/4/1/1
Bell and Blanchflower IZA Journal of European Labor Studies 2015, 4:1
Table 5 Dprobit of likelihood of parents not being in same household as child, 2005-2012
Greece UK Portugal Ireland France Spain Germany
Males Females Males Females Males Females Males Females Males Females Males Females Males Females
Age 20-24 0.383 0.414 0.489 0.509 0.042 0.091 0.343 0.418 0.394 0.415 0.075 0.128 0.439 0.488
Age 25-29 0.445 0.550 0.735 0.724 0.195 0.281 0.589 0.661 0.687 0.666 0.229 0.324 0.696 0.706
o o o o
Recession 0.009 0.004 0.002 -0.014 -0.005 0.010 0.117 0.121 -0.004 -0.020 0.001 0.014 0.029 0.024
NEET -0.118 0.121 -0.044 0.215 -0.060 0.052 -0.078 0.103 -0.160 -0.020 -0.041 0.049 -0.017 0.138
o
Recession*NEET 0.022 -0.054 -0.014 -0.026 0.029 -0.026 -0.043 -0.033 -0.018 -0.020 0.016 -0.028 -0.041 -0.017o
Student 0.139 0.115 0.009 -0.086 -0.107 -0.164 -0.060 -0.088 -0.137 -0.269 -0.104 -0.166 -0.133 -0.223
n= 189007 182334 75991 80788 120182 113201 128675 130803 298121 300694 127726 122139 106057 103613
Pseudo R2 = 0.112 0.131 0.292 0.362 0.144 0.181 0.229 0.273 0.312 0.368 0.174 0.217 0.287 0.368
o
Notes: excluded category 15-19. Source: ELFS, the symbol indicates a p value > 0.05.
Page 16 of 25Bell and Blanchflower IZA Journal of European Labor Studies 2015, 4:1 Page 17 of 25
http://www.izajoels.com/content/4/1/1
the issue of why females ages 25-29 are less likely than males of the same age to be liv-
ing with their parents. In part this is because females are more likely to be married.
Lack of mobility seems to be a major issue in Greece, presumably in part due to
rigidities in the housing market.
7 Underemployment
It also appears that if young people have jobs, they tend to be underemployed (Bell and
Blanchflower 2011a)3. Youngsters are faced with a double whammy, their job is more
likely to be temporary rather than permanent and to have less hours than they would
like. Table 7 documents the rise in the share of the young in temporary employment,
despite the fact that the incidence of temporary employment itself is broadly un-
changed across the OECD and in most countries. The increase between 2008 and 2013
is especially marked in Spain, where it rose from 59% to 65%, although it has fallen
slightly in Greece. Table 8 shows the change in the share of involuntary part-time em-
ployment among the young. This increased from 8% to 23% in Spain and from 5% to
11% in Greece. The young appear to be disproportionately unemployed and, if they do
have jobs, to be underemployed.
8 Duration of unemployment and underemployment
We now turn to other dimensions of the youth unemployment problem. Figure 8 re-
ports the shares of the unemployed who have been continuously unemployed for at
least a year, which are especially high in Ireland and Greece. We know from Ellwood
(1984) that long spells of unemployment while young causes permanent scars rather
than the temporary blemishes they cause for other age groups. Interestingly though,
Figure 9 shows that the average age of the long-term unemployed is lower in the UK
Table 6 Percent single by economic status ages 25-29 between 2009 and 2012 (%)
Employed Unemployed Inactive Total
Males
Greece 83.3 90.6 97.7 86.2
Spain 84.6 88.8 94.9 86.7
Portugal 71.1 82.0 94.6 75.1
Ireland 83.1 87.6 90.4 84.8
Germany 80.7 87.1 93.3 82.9
France 83.4 86.4 90.4 84.3
Sweden 86.3 83.7 91.4 86.7
UK 75.2 88.1 87.6 77.3
Females
Greece 73.0 77.7 37.9 66.9
Spain 75.1 73.2 56.7 71.7
Portugal 59.8 62.8 61.5 60.4
Ireland 77.8 79.6 69.2 76.1
Germany 74.8 72.0 52.1 69.9
France 77.2 79.3 60.4 74.3
Sweden 79.9 69.8 66.5 76.7
UK 70.0 79.4 60.9 68.5Bell and Blanchflower IZA Journal of European Labor Studies 2015, 4:1 Page 18 of 25
http://www.izajoels.com/content/4/1/1
Table 7 Incidence of temporary employment
Share of total employment 15-24 share of temporary employment
2008 2013 2008 2013
Australia 6 6 6 6
Austria 9 9 35 35
Belgium 8 8 29 33
Canada 12 13 27 30
Chile 31 30 48 46
Czech Republic 8 10 16 29
Denmark 9 9 24 21
Estonia 2 4 6 12
Finland 15 16 40 43
France 15 17 53 59
Germany 15 13 57 53
Greece 11 10 29 27
Hungary 8 11 20 25
Iceland 10 14 28 34
Ireland 8 10 22 33
Italy 13 13 43 53
Japan 14 14 26 27
Korea 24 22 29 27
Luxembourg 6 7 39 31
Netherlands 18 21 45 53
Norway 9 8 26 24
Poland 27 27 63 69
Portugal 23 22 54 61
Slovak Republic 5 7 13 21
Slovenia 17 16 70 74
Spain 29 23 59 65
Sweden 16 17 54 56
Switzerland 13 13 51 52
Turkey 11 12 13 20
United Kingdom 5 6 12 15
Russian Federation 14 9 24 17
Latvia 3 4 7 10
Europe 15 14 39 41
OECD countries 12 12 25 25
Source: OECD: Notes Date for Australia & Japan for 2012 not 2013.
than in any other country, and it is lower in Greece than in France, Spain, Portugal,
Sweden or Germany. Figure 10 makes clear that the highest proportion of female long-
term unemployed is in Greece.
Table 9 reports the results of estimating a probit column for Greece only where the
dependent variable is set to one if the individual has been unemployed for at least a
year (LTU), and 0 otherwise (employed andBell and Blanchflower IZA Journal of European Labor Studies 2015, 4:1 Page 19 of 25
http://www.izajoels.com/content/4/1/1
Table 8 Share or involuntary part-time employment in total employment, 15 to 24-year-
olds
2008 2010 2012
Australia 13 16 16
Austria 2 2 1
Belgium 6 5 4
Canada 7 10 10
Czech Republic 0 1 1
Denmark 3 5 4
Finland 7 9 8
France 7 8 8
Germany 4 3 2
Greece 5 8 11
Hungary 1 2 3
Ireland 2 10 13
Italy 9 13 17
Japan 7 10 7
Luxembourg 1 1 3
Netherlands 2 2 4
New Zealand 9 11 11
Norway 1 2 2
Poland 1 2 3
Portugal 4 6 8
Slovak Republic 1 4 4
Spain 8 14 23
Sweden 9 11 11
United Kingdom 4 7 9
United States 3 5 6
European Union 15 5 7 7
Europe 4 5 5
G7 countries 4 7 6
OECD countries 3 5 5
Source: OECD. Notes for the UK data are for 2007 not 2008.
and just under 200,000 in the second. Controls include gender, age, education, whether
these are recession years (2009-2012) and whether the respondent is from the Acces-
sion countries or some other nationality other than Greek. The recession brought
higher unemployment. The most educated have the lowest probability of being un-
employed or long-term unemployed, as expected. We also find foreigners have lower
probabilities of both being unemployed and longer durations. As noted earlier, females
have higher probabilities of both being unemployed and long durations. Once charac-
teristics are controlled for, the age group 25-29 has a lower probability of both LTU
and unemployment than either 20 to 24-year-olds or 15 to 19-year-olds.
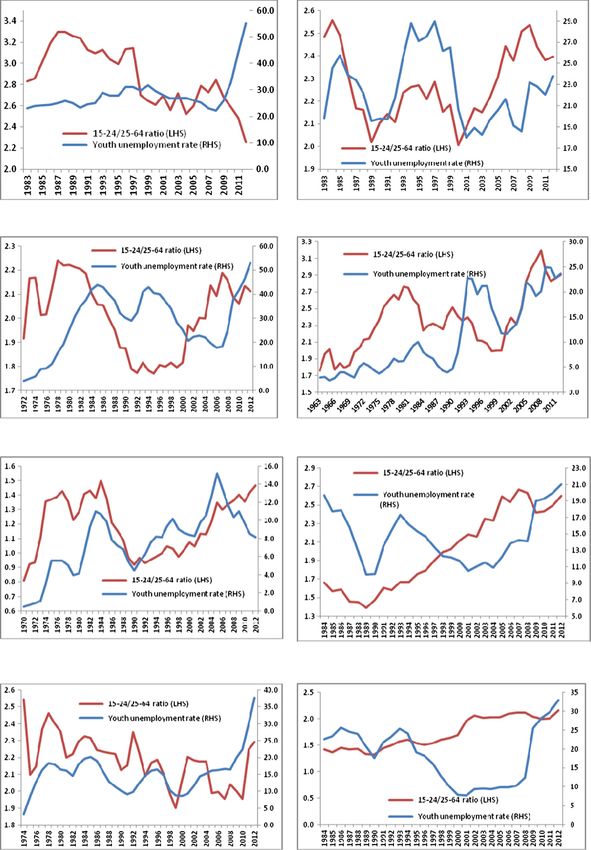
We have seen that there is a huge amount of unemployment in Greece, but there is a
high level of underemployment, as noted above. Figure 10 shows that young workers in
Greece were hit by a double whammy; they couldn’t find jobs, but when they could, the
jobs would see reductions in hours from 2005-2012 that were especially marked.Bell and Blanchflower IZA Journal of European Labor Studies 2015, 4:1 Page 20 of 25
http://www.izajoels.com/content/4/1/1
Figure 8 Average age of long-term unemployed 2008-2012. Source: ELFS.
Figure 11 shows that they desired more hours than they are working and hence are
underutilized. This suggests there is a large amount of slack in the Greek labour market
both from the unemployed and from the employed who would like to work more
hours.
9 The well-being of Greek youth
How has the well-being of the young in Greece been affected by recession? Are the ef-
fects different from previous recessions since the probability of finding a job match is
now much lower, i.e., hopelessness? For earlier work on happiness and well-being see
Blanchflower (2009) and Blanchflower and Oswald (2004).
In Table 10, we report on well-being by country since 2000 using data from the
Eurobarometer survey series conducted for the EU Commission. We report responses
to a life satisfaction question asked in many but not all surveys. The specific question
Figure 9 Proportion of females among long-term unemployed. Source: ELFS.Bell and Blanchflower IZA Journal of European Labor Studies 2015, 4:1 Page 21 of 25
http://www.izajoels.com/content/4/1/1
Figure 10 Actual weekly hours by age group 2005-2012, Greece. Source: ELFS.
used is as follows, "On the whole, are you very satisfied, fairly satisfied, not very satisfied
or not at all satisfied with the life you lead?" We code the answers as 4 = very satisfied,
3 = fairly satisfied, 2 = not very satisfied and 1 = not at all satisfied. These data have pre-
viously been used in Blanchflower et al. (2014) and Blanchflower (2009). Sample sizes
are approximately 1000 per country per year. We report results for the average of the
years of 2000-2007 (pre-recession) and 2008-2012 (post-recession) to ensure adequate
sample sizes. We report overall results for the country as a whole and then separately
for three age groups 15-24, 25-29 and 30+.
The main results are as follows:
The happiest countries both pre- and post-recession are from Northern Europe. In
order the happiest countries pre-recession were Denmark (3.60), Netherlands (3.37)
and Sweden (3.36). Post-recession, the happiest were Denmark (3.65), Netherlands
(3.46) and Sweden (3.46)
There is evidence that the happiest countries saw increases in their happiness levels
over the two time periods, especially in Denmark, Finland and the Netherlands.
The least happy countries in the pre-recession period were from Eastern Europe -
Bulgaria (2.06), Romania (2.44) and Hungary (2.37).
Over the two periods, Greece and Portugal (-0.32 pts and -0.22 pts,
respectively) followed by Italy and Spain (-0.17 pts and -0.16 pts, respectively)
had the most marked declines in happiness. It is notable that the happiness
levels of the Irish remained unchanged.
Consistent with Blanchflower and Oswald (2008), who found that happiness was
U-shaped in age, the young are especially happy. In terms of the happiness levels of
the youngest age group (15-24), the least happy and most happy countries were
broadly the same as overall.Bell and Blanchflower IZA Journal of European Labor Studies 2015, 4:1 Page 22 of 25
http://www.izajoels.com/content/4/1/1
Table 9 Probability of unemployment and long-term unemployment in Greece
Aged 16-64 Aged 16-29
Long-term Unemployment Long-term Unemployment
unemployment unemployment
Coefficient df/dX p value df/dX p value df/dX p value df/dX p value
Age 20-24 0.092 0 0.150 0 0.009 0.005 -0.073 0.000
Age 25-29 0.063 0 0.066 0 -0.020 0.000 -0.191 0.000
Age 30-34 0.031 0 0.013 0
Age 35-39 0.018 0 -0.011 0
Age 40-44 0.007 0 -0.029 0
Age 45-49 -0.002 0.14 -0.040 0
Age 50-54 -0.003 0.034 -0.043 0
Age 55-59 -0.009 0 -0.053 0
Age 60-64 -0.020 0 -0.072 0
Recession 0.031 0 0.066 0 0.055 0.000 0.120 0.000
ISCED 1 0.004 0 0.008 0 -0.003 0.344 -0.008 0.077
ISCED 2 0.000 0.804 0.003 0.123 0.013 0.002 0.038 0.000
ISCED 3 -0.001 0.042 -0.003 0 -0.008 0.002 0.004 0.272
ISCED 4 -0.001 0.107 0.001 0.3 -0.011 0.001 0.028 0.000
ISCED 5 -0.023 0 -0.037 0 -0.020 0.000 0.032 0.000
ISCED 6 -0.027 0 -0.055 0 -0.043 0.029 -0.069 0.022
Other EU -0.024 0 -0.016 0 -0.061 0.000 -0.064 0.000
Accession States -0.013 0 0.009 0 -0.043 0.000 -0.051 0.000
Other nationality -0.012 0 -0.003 0.275 -0.038 0.000 -0.042 0.000
Female 0.044 0 0.068 0 0.073 0.000 0.111 0.000
n= 993578 993578 188286 188286
Pseudo R2 = 0.066 0.082 0.038 0.055
obs. P 0.059 0.116 0.109 0.235
pred P 0.048 0.098 0.101 0.222
Notes. In column 1, the dependent variable is 1 if unemployed for at least a year and zero if employed or unemployed
for less than a year. In column 2, the dependent variable is 1 if unemployed and zero if employed. Columns 3 and 4
follow the same rules, respectively, but the dataset is restricted to those aged 16-29. ISCED (International Standard
Classification of Education) levels broadly correspond to: 0 = Pre-primary education; 1 = Primary education or first stage
of basic education; 2= Lower secondary education or second stage of basic education; 3 = Upper secondary education;
4 = Post-secondary non-tertiary education; 5 = First stage of tertiary education and 6 = Second stage of tertiary
education. So a higher ISCED number implies more education.
Omitted categories – Age 15-19, ISCED 0, Greek.
Happiness levels of the 15-24 age group fell most in Portugal (-0.27 pts), Spain
(-0.21 pts) and Greece (-0.21 pts). The countries hit hardest by high youth
unemployment (also often associated with tight monetary and fiscal policies) in the
Eurozone have experienced the biggest declines in their well-being. On any measure,
this is bad.
Of particular note is the especially sharp fall in happiness for those aged 25-29 in
Greece (-0.29 pts), Spain (-0.21 pts) and Portugal (-0.22 pts). So in Greece the older
of the two young cohorts experienced a bigger drop in happiness than the youngest
cohort.
Overall happiness fell more across all age groups in Greece (-.32) than in any other
country.Bell and Blanchflower IZA Journal of European Labor Studies 2015, 4:1 Page 23 of 25
http://www.izajoels.com/content/4/1/1
Figure 11 Desired weekly hours by age group 2005-2012, Greece. Source: ELFS.
Table 10 Well-being score by country and age group 2000-2007 and 2008-2012
2000-2007 2008-2012 Changes 2000-2007 to 2008-2012
Age group Age group Age group
15-24 25-29 30+ All 15-24 25-29 30+ All 15-24 25-29 30+ All
Austria 3.16 3.11 3.08 3.10 3.16 3.08 3.01 3.03 0 -0.03 -0.07 -0.07
Belgium 3.12 3.09 3.08 3.09 3.29 3.17 3.15 3.17 0.17 0.08 0.07 0.08
Bulgaria 2.43 2.21 1.99 2.06 2.62 2.43 2.15 2.22 0.19 0.22 0.16 0.16
Denmark 3.61 3.61 3.6 3.60 3.65 3.63 3.65 3.65 0.04 0.02 0.05 0.05
Finland 3.24 3.24 3.15 3.17 3.39 3.38 3.27 3.29 0.15 0.14 0.12 0.12
France 3.02 3.00 2.90 2.93 3.14 2.97 2.92 2.95 0.12 -0.03 0.02 0.02
Germany 2.90 2.89 2.90 2.90 3.1 3.00 3.01 3.02 0.2 0.11 0.11 0.12
Greece 2.89 2.8 2.59 2.66 2.68 2.51 2.27 2.34 -0.21 -0.29 -0.32 -0.32
Hungary 2.74 2.65 2.39 2.44 2.64 2.49 2.32 2.36 -0.1 -0.16 -0.07 -0.08
Ireland 3.25 3.21 3.25 3.24 3.23 3.15 3.24 3.23 -0.02 -0.06 -0.01 -0.01
Italy 2.96 2.91 2.84 2.87 2.83 2.75 2.69 2.7 -0.13 -0.16 -0.15 -0.17
Luxembourg 3.29 3.3 3.34 3.33 3.35 3.28 3.38 3.37 0.06 -0.02 0.04 0.04
Netherlands 3.4 3.39 3.37 3.37 3.55 3.53 3.45 3.46 0.15 0.14 0.08 0.09
Poland 3.12 3.0 2.70 2.79 3.09 3.02 2.78 2.83 -0.03 0.02 0.08 0.04
Portugal 2.87 2.77 2.50 2.58 2.6 2.55 2.3 2.36 -0.27 -0.22 -0.2 -0.22
Romania 2.68 2.58 2.29 2.37 2.68 2.47 2.26 2.34 0 -0.11 -0.03 -0.03
Slovakia 2.84 2.81 2.60 2.64 3.03 2.91 2.73 2.77 0.19 0.1 0.13 0.13
Spain 3.15 3.09 3.01 3.04 3.07 2.88 2.85 2.88 -0.08 -0.21 -0.16 -0.16
Sweden 3.36 3.37 3.36 3.36 3.52 3.42 3.45 3.46 0.16 0.05 0.09 0.1
UK 3.19 3.16 3.2 3.19 3.33 3.22 3.26 3.26 0.14 0.06 0.06 0.07
Source: Eurobarometer Surveys, 2000-2012.Bell and Blanchflower IZA Journal of European Labor Studies 2015, 4:1 Page 24 of 25
http://www.izajoels.com/content/4/1/1
10 Conclusion
There is little evidence from the literature that ALMPs work, especially in a recession
where over a quarter of the labour force and over a half of the youth labour force are
unemployed. This is unprecedented territory when overall unemployment is so high
and an immediate expansion in aggregate demand is precluded.
The age group 25-29 in Greece is probably of greatest concern because numerically
their unemployment is much larger than those aged 15-19. The share of this group who
are NEETS is worryingly high. This group is excluded from the usual understanding of
youth unemployment, but they were the ones who were young when the recession first
hit. Hence, many were unable to make the transition from school to work. There is an
issue as to whether this group is experiencing age or cohort effects. Clearly this is an
important distinction in relation to the scarring effects of unemployment on this group.
The conventional ratio of youth to adult unemployment is not particularly high in
Greece, partly due to the effects of 25-29 year olds. This begs the question of whether
it is overall lack of demand that is the problem or if there are specific issues in the
Greek youth labour market. Youth unemployment was relatively high prior to the re-
cession – in fact, the youth/adult unemployment rate ratio in Greece has been trending
downwards – unlike most other countries. In addition, student (part-time) employment
and unemployment is rare in Greece and much less important than in, say, the UK.
They do not significantly affect age-specific unemployment rates.
The European Labour Force Survey indicates that numbers in Greece in the 15-29 age
group is falling. This is a combination of the effects of declining cohort size and increased
emigration, which seems to have been particularly marked among women ages 25-29.
There are very significant differences in labour market outcomes for males and females in
Greece. Female activity rates and employment to population ratios are consistently lower
and unemployment rates higher for females than for males in the Greek labour mar-
ket. Gender differentials in Greece are more marked than in many other EU states.
Greek youths are much more likely to live at home than are young people in
Northern Europe. A similar pattern is found in Spain and Portugal. This mitigates the
costs of unemployment, but may also restrict mobility, leading to longer unemployment
durations. Again, there are significant gender differentials, with females aged 25-29
more likely to have moved away from the parental home than males. NEET women are
more likely to live away, while NEET men are more likely to live at home than are the
employed of the same gender. The Great Recession was associated with fairly minor
changes in these probabilities. So there has not been a big “return to Mum” in response
to recent economic events, other than for females ages 25-29 in Greece, with the pro-
portion living alone dropping from 53% in 2005 to 43% in 2012.
There is evidence also that many young workers are underemployed and are in part-
time jobs when they would like to have full-time and in temporary jobs when they would
like permanent ones. Among European countries, Greece has the highest proportions of
the young unemployed that have been without work for more than a year. So scarring
effects are likely to be large, especially for those 25-29 who were hit hardest by the 2008
recession shock and failed to make a successful transition from school to work. An
extremely high proportion of these young adults continue to live with their parents.
The decline in Greek well-being since the beginning of the recession has been
the most rapid in Europe. However, it is evenly spread across age groups and notBell and Blanchflower IZA Journal of European Labor Studies 2015, 4:1 Page 25 of 25
http://www.izajoels.com/content/4/1/1
specifically focused on the young. Lack of mobility due to rigidities in the housing
market seems to be a major issue in Greece. Worryingly, we see no evidence that these
extremely high rates of youth unemployment in Greece are going away any time soon.
Endnotes
1
http://epp.eurostat.ec.europa.eu/cache/ITY_PUBLIC/3-28022014-AP/EN/3-28022014-
AP-EN.PDF
2
Sweden is not included because all relevant data were not available.
3
Bell and Blanchflower (2011a) find that young workers want more hours, while older
workers want less hours.
Competing interests
The IZA Journal of European Labor Studies is committed to the IZA Guiding Principles of Research Integrity. The
authors declare that they have observed these principles.
Acknowledgement
Paper presented at the Stavros Niarchos Foundation conference: Recharging the Youth: an international conference on
the global youth unemployment crisis and the need for collective action. The authors would like to thank the
anonymous referee.
Responsible editor: Martin Kahanec
Author details
1
Division of Economics, Stirling Management School, University of Stirling, Stirling, UK. 2Department of Economics,
Dartmouth College, USA. 3Peterson Institute for International Economics, UK.
Received: 25 June 2014 Accepted: 12 September 2014
Published: 29 Jan 2015
References
Auspos P, Riccio J, White M (1999) A review of US and European literature on the microeconomic effects of labor
market programmes for young people, Employment Service, Research and Development Report no 20, July 1999.
The Employment Service, Sheffield
Bell DNF, Blanchflower DG (2011a) UK underemployment in the Great Recession. Nat Inst Econ Rev 215:R23–33
Bell DNF, Blanchflower DG (2011b) Youth unemployment in Europe and the United States’. Nord Econ Pol Rev number 1:11–38
Bergemann A, van den Berg GJ (2006) Active Labor Market Policy effects for women in Europe: a survey. IZA Discussion Paper 2365
Blanchflower DG (2009) International evidence on well-being. In: AlB K (ed) Measuring the Subjective Well-Being of
Nations: National Accounts of Time Use and Well-Being. NBER and University of Chicago Press
Blanchflower DG, Oswald AJ (2004) Well-being over time in Britain and the USA. J Public Econ 88:1359–1386
Blanchflower DG, Oswald AJ (2008) Is well-being U-shaped over the life cycle?’. Soc Sci Med 66(6):1733–1749
Blanchflower D, Bell D, Montagnoli A, Miro M (2014) Journal of Money, Credit and Banking, 46(S2):117–141
Calmfors L, Forslund A, Hemström M (2002) Does Active Labor Market Policy work? Lessons from the Swedish
Experiences. Institute for International Economic Studies, Stockholm University
Card D, Kluve J, Weber A (2009) Active labor market policy evaluations: a meta-analysis. Econ J 120:F452–F477
Cholezas I (2013) Youth guarantee in times of austerity: the Greek case. Friedrich Ebert Stiftung, discussion paper
Grubb WN (1999) Lessons from education and training for youth: five precepts, in preparing youth for the 21st
Century: the transition from education to the labor market’. OECD, Paris
Heckman JJ, Smith JA (1999a) The pre-programme earnings dip and the determinants of participation in a social
programme. Implications for simple evaluation strategies. Econ J 109:313–348
Heckman JJ, Smith JA (1999b) The sensitivity of experimental impact estimates: evidence from the National JTPA
Study’. In: Blanchflower DG, Freeman RB (eds) Youth employment and joblessness in advanced countries.
University of Chicago Press and NBER, Chicago
Kahn LB (2010) The long-term labor market consequences of graduating from college in a bad economy’. Labour Econ
17(2):303–316
Kluve J (2010) The effectiveness of European active labor market programs. Labour Economics 17(6):904–918
Martin JP, Grubb D (2001) What Works and for Whom: A Review of OECD Countries' experiences with active labour market
policies (No. 2001: 14), Working Paper, IFAU-Institute for Labour Market Policy Evaluation
OECD (1994) The OECD Jobs Study: Facts, Analysis, Strategies. OECD, Paris
Pastore F (2012) Youth unemployment in Italy at the time of the new great depression’. Friedrich Ebert Stiftung, discussion paper
Pastore (2013) The European Youth Guarantee: an Italian perspective”. Soc Eur J, www.social-europe.eu, 23.5.2013
Rocha Sánchez F (2012) Youth unemployment in Spain. Friedrich Ebert Stiftung, discussion paperik
Tubadji A (2012) Youth unemployment in Greece: economic and political perspectives’. Friedrich Ebert Stiftung,
discussion paper
10.1186/2193-9012-4-1
Cite this article as: Bell and Blanchflower: Youth unemployment in Greece: measuring the challenge. IZA Journal
of European Labor Studies 2015, 4:1You can also read