ZIMBABWE CLIMATE RISK COUNTRY PROFILE - World Bank Climate Change Knowledge Portal
←
→
Page content transcription
If your browser does not render page correctly, please read the page content below

CLIMATE RISK COUNTRY PROFILE

        ZIMBABWE
COPYRIGHT
© 2021 by the World Bank Group
1818 H Street NW, Washington, DC 20433
Telephone: 202-473-1000; Internet: www.worldbank.org

This work is a product of the staff of the World Bank Group (WBG) and with external contributions. The opinions, findings,
interpretations, and conclusions expressed in this work are those of the authors and do not necessarily reflect the views or the
official policy or position of the WBG, its Board of Executive Directors, or the governments it represents.

The WBG does not guarantee the accuracy of the data included in this work and do not make any warranty, express or implied,
nor assume any liability or responsibility for any consequence of their use. This publication follows the WBG’s practice in
references to member designations, borders, and maps. The boundaries, colors, denominations, and other information shown
on any map in this work, or the use of the term “country” do not imply any judgment on the part of the WBG, its Boards, or the
governments it represents, concerning the legal status of any territory or geographic area or the endorsement or acceptance
of such boundaries.

The mention of any specific companies or products of manufacturers does not imply that they are endorsed or recommended
by the WBG in preference to others of a similar nature that are not mentioned.

RIGHTS AND PERMISSIONS
The material in this work is subject to copyright. Because the WBG encourages dissemination of its knowledge, this work may
be reproduced, in whole or in part, for noncommercial purposes as long as full attribution to this work is given.

Please cite the work as follows: Climate Risk Profile: Zimbabwe (2021): The World Bank Group.

Any queries on rights and licenses, including subsidiary rights, should be addressed to World Bank Publications, The World Bank
Group, 1818 H Street NW, Washington, DC 20433, USA; fax: 202-522-2625; e-mail: pubrights@worldbank.org.

Cover Photos: © Harvey Barrison / World Bank, “Victoria Falls_2012 05 24_1721” May 24, 2012 via Flickr, Creative Commons
CC BY-NC-ND 2.0. © joepyrek, “Hwange National Park (2)” November 7, 2012 via Flickr, Creative Commons CC BY-NC-ND 2.0.

Graphic Design: Circle Graphics, Reisterstown, MD.

CLIMATE RISK COUNTRY PROFILE: ZIMBABWE                                                                                        ii

ACKNOWLEDGEMENTS
This profile is part of a series of Climate Risk Country Profiles developed by the World Bank Group (WBG). The country profile
synthesizes most relevant data and information on climate change, disaster risk reduction, and adaptation actions and policies
at the country level. The country profile series are designed as a quick reference source for development practitioners to better
integrate climate resilience in development planning and policy making. This effort is managed and led by Veronique Morin
(Senior Climate Change Specialist, WBG) and Ana E. Bucher (Senior Climate Change Specialist, WBG).

This profile was written by Yunziyi Lang (WBG) and Brent Boehlert (Industrial Economics, Inc.). Additional support was provided
by Lisa Thalheimer (University of Oxford), Jacqueline Willwerth (Industrial Economics, Inc.), Pablo Cesar Benitez (Senior
Environmental Economist, WBG), and MacKenzie Dove (Senior Climate Change Consultant, WBG).

Climate and climate-related information is largely drawn from the Climate Change Knowledge Portal (CCKP), a WBG online
platform with available global climate data and analysis based on the latest Intergovernmental Panel on Climate Change (IPCC)
reports and datasets. The team is grateful for all comments and suggestions received from the sector, regional, and country
development specialists, as well as climate research scientists and institutions for their advice and guidance on use of climate
related datasets.

CLIMATE RISK COUNTRY PROFILE: ZIMBABWE                                                                                        iii
CONTENTS

FOREWORD  .  .  .  .  .  .  .  .  .  .  .  .  .  .  .  .  .  .  .  .  .  .  .  .  .  .  .  .  .  .  .  .  .  .  .  . 1

COUNTRY OVERVIEW .   .   .   .   .   .   .   .   .   .   .   .   .   .   .   .   .   .   .   .   .   .   .   .   .   .   .   .   .   .   .  2

CLIMATOLOGY  .   .   .   .   .   .   .   .   .   .   .   .   .   .   .   .   .   .   .   .   .   .   .   .   .   .   .   .   .   .   .   .   .   .   3
   Historical Climate .  .  .  .  .  .  .  .  .  .  .  .  .  .  .  .  .  .  .  .  .  .  .  .  .  .  .  .  .  .  .  .  .  .  .  .  .  .  . 3
     Overview  .  .  .  .  .  .  .  .  .  .  .  .  .  .  .  .  .  .  .  .  .  .  .  .  .  .  .  .  .  .  .  .  .  .  .  .  .  .  .  .  .  . 3
     Data Snapshots .  .  .  .  .  .  .  .  .  .  .  .  .  .  .  .  .  .  .  .  .  .  .  .  .  .  .  .  .  .  .  .  .  .  .  .  .  .  . 5
     Key Climate Trends .  .  .  .  .  .  .  .  .  .  .  .  .  .  .  .  .  .  .  .  .  .  .  .  .  .  .  .  .  .  .  .  .  .  .  .  .  . 5
   Projected Climate  .  .  .  .  .  .  .  .  .  .  .  .  .  .  .  .  .  .  .  .  .  .  .  .  .  .  .  .  .  .  .  .  .  .  .  .  .  .  . 6
     Overview  .  .  .  .  .  .  .  .  .  .  .  .  .  .  .  .  .  .  .  .  .  .  .  .  .  .  .  .  .  .  .  .  .  .  .  .  .  .  .  .  .  . 6
     Data Snapshots .  .  .  .  .  .  .  .  .  .  .  .  .  .  .  .  .  .  .  .  .  .  .  .  .  .  .  .  .  .  .  .  .  .  .  .  .  .  . 7
     Key Climate Trends .  .  .  .  .  .  .  .  .  .  .  .  .  .  .  .  .  .  .  .  .  .  .  .  .  .  .  .  .  .  .  .  .  .  .  .  .  . 8

CLIMATE CHANGE IMPACTS ON NATURAL HAZARDS  .  .  .  .  .  .  .  .  .  .  .  .  .  .  .  . 9
   Natural Hazards .  .  .  .  .  .  .  .  .  .  .  .  .  .  .  .  .  .  .  .  .  .  .  .  .  .  .  .  .  .  .  .  .  .  .  .  .  .  .  . 9
   Climate Change Impacts  .  .  .  .  .  .  .  .  .  .  .  .  .  .  .  .  .  .  .  .  .  .  .  .  .  .  .  .  .  .  .  .  .  .  .  . 10
   Gender .  .  .  .  .  .  .  .  .  .  .  .  .  .  .  .  .  .  .  .  .  .  .  .  .  .  .  .  .  .  .  .  .  .  .  .  .  .  .  .  .  .  .  . 10

CLIMATE CHANGE IMPACTS ON KEY SECTORS .   .   .   .   .   .   .   .   .   .   .   .   .   .   .   .   .   .   . 11
       Agriculture .  .  .  .  .  .  .  .  .  .  .  .  .  .  .  .  .  .  .  .  .  .  .  .  .  .  .  .  .  .  .  .  .  .  .  .  .  .  .  .  .         11
       Water .  .  .  .  .  .  .  .  .  .  .  .  .  .  .  .  .  .  .  .  .  .  .  .  .  .  .  .  .  .  .  .  .  .  .  .  .  .  .  .  .  .  .         13
       Energy  .  .  .  .  .  .  .  .  .  .  .  .  .  .  .  .  .  .  .  .  .  .  .  .  .  .  .  .  .  .  .  .  .  .  .  .  .  .  .  .  .  .  .       16
       Forestry .  .  .  .  .  .  .  .  .  .  .  .  .  .  .  .  .  .  .  .  .  .  .  .  .  .  .  .  .  .  .  .  .  .  .  .  .  .  .  .  .  .         17

ADAPTATION .   .   .   .   .   .   .   .   .   .   .   .   .   .   .   .   .   .   .   .   .   .   .   .   .   .   .   .   .   .   .   .   .   .   . 20
   Institutional Framework for Adaptation .  .  .  .  .  .  .  .  .  .  .  .  .  .  .  .  .  .  .  .  .  .  .  .  .  .  .  .  . 20
   Key Adaptation Policies and Reports .  .  .  .  .  .  .  .  .  .  .  .  .  .  .  .  .  .  .  .  .  .  .  .  .  .  .  .  .  .  . 21
   Adaptation Options for Key Sectors  .  .  .  .  .  .  .  .  .  .  .  .  .  .  .  .  .  .  .  .  .  .  .  .  .  .  .  .  .  .  . 21
      Agriculture .  .  .  .  .  .  .  .  .  .  .  .  .  .  .  .  .  .  .  .  .  .  .  .  .  .  .  .  .  .  .  .  .  .  .  .  .  .  .  .  . 21
      Water .  .  .  .  .  .  .  .  .  .  .  .  .  .  .  .  .  .  .  .  .  .  .  .  .  .  .  .  .  .  .  .  .  .  .  .  .  .  .  .  .  .  . 22
      Energy  .  .  .  .  .  .  .  .  .  .  .  .  .  .  .  .  .  .  .  .  .  .  .  .  .  .  .  .  .  .  .  .  .  .  .  .  .  .  .  .  .  . 23
      Forestry .  .  .  .  .  .  .  .  .  .  .  .  .  .  .  .  .  .  .  .  .  .  .  .  .  .  .  .  .  .  .  .  .  .  .  .  .  .  .  .  .  . 23
      Disaster Risk Management .  .  .  .  .  .  .  .  .  .  .  .  .  .  .  .  .  .  .  .  .  .  .  .  .  .  .  .  .  .  .  .  . 24

CLIMATE RISK COUNTRY PROFILE: ZIMBABWE                                                                                                               iv
FOREWORD

Climate change is a major risk to good development outcomes, and the World Bank Group is committed to playing
an important role in helping countries integrate climate action into their core development agendas. The World
Bank Group is committed to supporting client countries to invest in and build a low-carbon, climate-resilient future,
helping them to be better prepared to adapt to current and future climate impacts.

The World Bank Group is investing in incorporating and systematically managing climate risks in development
operations through its individual corporate commitments.

A key aspect of the World Bank Group’s Action Plan on Adaptation and Resilience (2019) is to help countries
shift from addressing adaptation as an incremental cost and isolated investment to systematically incorporating
climate risks and opportunities at every phase of policy planning, investment design, implementation and evaluation
of development outcomes. For all IDA and IBRD operations, climate and disaster risk screening is one of the
mandatory corporate climate commitments. This is supported by the Bank Group’s Climate and Disaster Risk
Screening Tool which enables all Bank staff to assess short- and long-term climate and disaster risks in operations
and national or sectoral planning processes. This screening tool draws up-to-date and relevant information from
the World Bank’s Climate Change Knowledge Portal, a comprehensive online ‘one-stop shop’ for global, regional,
and country data related to climate change and development.

Recognizing the value of consistent, easy-to-use technical resources for client countries as well as to support
respective internal climate risk assessment and adaptation planning processes, the World Bank Group’s Climate
Change Group has developed this content. Standardizing and pooling expertise facilitates the World Bank Group in
conducting initial assessments of climate risks and opportunities across sectors within a country, within institutional
portfolios across regions, and acts as a global resource for development practitioners.

For developing countries, the climate risk profiles are intended to serve as public goods to facilitate upstream
country diagnostics, policy dialogue, and strategic planning by providing comprehensive overviews of trends
and projected changes in key climate parameters, sector-specific implications, relevant policies and programs,
adaptation priorities and opportunities for further actions.

It is my hope that these efforts will spur deepening of long-term risk management in developing countries and our
engagement in supporting climate change adaptation planning at operational levels.

Bernice Van Bronkhorst
Global Director
Climate Change Group (CCG)
The World Bank Group (WBG)

CLIMATE RISK COUNTRY PROFILE: ZIMBABWE                                                                               1
COUNTRY OVERVIEW

L
       ocated between latitudes 15°–23°S and longitudes 25°–34°E, Zimbabwe is a landlocked country neighboring
       Botswana, Zambia, Mozambique, and South Africa. It is endowed with abundant natural resources with total
       land area of 390,757 square kilometers,1 and a population of over 14.6 million in 2019.2 According to the
World Bank estimations, the Gross Domestic Product (GDP) of the country reached $21.4 billion in 2019. The
annual GDP growth peaked at 11.9% in 2011 and has been decreasing since: in 2019 the annual GDP growth
rate was at −8.1%, well below the average annual GDP growth of low-income countries (4.4%). Zimbabwe
is subject to a complex physical and climatic structure.3 According to Köppen-Geiger Climate Classification,
northern Zimbabwe experiences subtropical climate with dry winter and hot summer; and southern area faces hot
arid and steppe climate.4

The country’s economy is largely dependent on services (61.3% of GDP, 2018), followed by industry (20.6%
of GDP, 2018), agriculture (8.3% GDP, 2018), and manufacturing (10.6% of GDP, 2018).2 As indicated in its
first Nationally Determined Contribution (NDC), the key sectors to boosting Zimbabwe’s economy – including
agriculture, water, energy, forestry, tourism, and industry, among others – are also susceptible to abrupt climate
variability.5 Climate change is likely to adversely impact Zimbabwe’s key economic sectors as well as its livelihoods.
With climatic variability increasing, natural disasters will occur more frequently and have the potential to hit the most
vulnerable parts of the population, the poor, in a disproportionate way6 since poor people are often overexposed to
these hazards. In other words, natural disasters can push people into poverty as a result of their impacts.7

The adaptation priorities identified in the first NDC consist of promoting climate resilient crop and livestock
development and climate smart agricultural practices; building resilience in managing climate related disaster risks
such as droughts and floods; strengthening management of water resources and irrigation in the face of climate
change; promoting practices that reduce risk of losses in crops, livestock and agricultural incomes; and cross
sectoral adaptation efforts such as capacity building through research and development, education and awareness,
and training in climate change related issues and mainstreaming gender responsive climate policies.

1
    Zimbabwe’s National Climate Change Response Strategy (NCCRS, 2015). URL: http://www4.unfccc.int/sites/nama/_layouts/UN/
    FCCC/NAMA/Download.aspx?ListName=NAMA&Id=165&FileName=Climate%20Change%20Response%20Strategy.pdf
2
    World Bank Open Data. Data retrieved in May 2021. URL: https://data.worldbank.org/
3
    D. Manatsa and G. Mukwada (2012): Rainfall Mechanisms for the Dominant Rainfall Mode over Zimbabwe Relative to ENSO and/
    or IODZM. The Scientific World Journal, vol. 2012, Article ID 926310. DOI:10.1100/2012/926310. URL: https://www.hindawi.com/
    journals/tswj/2012/926310/cta/
4
    Kottek, M., J. Grieser, C. Beck, B. Rudolf, and F. Rubel (2006): World Map of the Köppen-Geiger climate classification updated.
    Meteorol. Z., 15, 259–263. DOI: 10.1127/0941-2948/2006/0130. URL: http://koeppen-geiger.vu-wien.ac.at/pics/1976-2000.gif
5
    Zimbabwe’s First Nationally Determined Contribution (NDC). URL: http://www4.unfccc.int/ndcregistry/PublishedDocuments/
    Zimbabwe%20First/Zimbabwe%20First%20NDC.pdf
6
    IPCC 5th Asssement Report (AR5, 2014): Chapter 22: Africa - Impacts, Adaptation, and Vulnerability, pp. 1199–1265.
    URL: https://www.ipcc.ch/pdf/assessment-report/ar5/wg2/WGIIAR5-Chap22_FINAL.pdf
7
    Hallegatte et al. (2017): Unbreakable: Building the Resilience of the Poor in the Face of Natural Disasters. URL: https://
    openknowledge.worldbank.org/handle/10986/25335

CLIMATE RISK COUNTRY PROFILE: ZIMBABWE                                                                                                2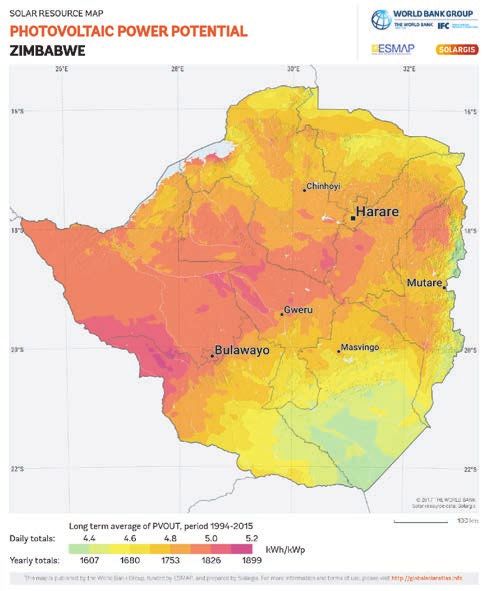
CLIMATOLOGY

 Historical Climate
 Overview
 The country experiences its rainy season along with relatively high temperatures from October to March; and
 it encounters dry seasons with low temperatures from June to August. After the dry and cold season,
 the average temperature peaks around October or November. As shown in Figure 1, the mean monthly
 temperature of the country ranges between 15 °C and 25 °C, for the latest climatology, 1991–2020.8 During
 the same time period, the mean monthly precipitation of the country varies from 2 mm to 160 mm, which
 resulted in an annual average rainfall of roughly 670 mm.9

 Figure 2 shows maps of average annual rainfall (left) and annual temperature (right) for Zimbabwe. Total
 annual rainfall varies at both temporal and spatial levels. Rainfall in the country decreases from north to south
 and from east to west. On average, southern Zimbabwe (300–500 mm) receives less rainfall than the northern

  FIGURE 1.  Average monthly temperature and rainfall of Zimbabwe for 1991–202010
                    32                                                                                   180
Temperature (°C)

                    24                                                                                   120
                                                                                                               Rainfall (mm)

                    16                                                                                   60

                     8                                                                                   0
                          Jan   Feb    Mar    Apr   May    Jun    Jul   Aug    Sep    Oct   Nov    Dec

                                                    Rainfall        Temperature

 8
                   WBG Climate Change Knowledge Portal (CCKP, 2021). Climate Data: Historical. URL: https://climateknowledgeportal.worldbank.
                   org/country/zimbabwe
 9
                   WBG Climate Change Knowledge Portal (CCKP, 2021). Climate Data: Historical. URL: https://climateknowledgeportal.worldbank.
                   org/country/zimbabwe
 10
                   WBG Climate Change Knowledge Portal (CCKP, 2021). Climate Data: Historical. URL: https://climateknowledgeportal.worldbank.
                   org/country/zimbabwe

 CLIMATE RISK COUNTRY PROFILE: ZIMBABWE                                                                                                         3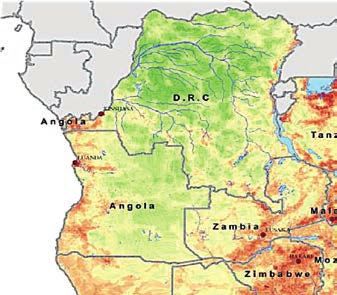
(700–1000 mm) and eastern (above 1000 mm) parts of the country.11 The high-elevation areas in the east and the
highveld (the portion of the South African inland plateau which has an altitude above roughly 1500 m, but below
2100 m) are generally cooler than the lower areas.12 Average annual temperature ranges between 18°C and 22°C
for the higher areas (or central and eastern areas) and between 22°C and 25°C for the lower areas (southern and
northern areas).13 The ground frost, an important seasonal marker for agriculture, takes place during dry and cool
season (June – August), which peaks around late June and mid/late July.14

FIGURE 2.  Map of average annual temperature (left) and annual precipitation (right)
of Zimbabwe for 1991–202015

Research shows that the El Niño Southern Oscillation (ENSO) has significant implications on rainfall across
the country. Specifically, the country tends to receive less than average rainfall during the warm phase of ENSO
(or El Niño) during the rainy season from October to March;16 and it often experiences more than average rainfall
during the cool phase of ENSO (or La Nina) also during the rainy season.17 For example, during the 1987–88
El Niño year, seasonal precipitation decreased and the rainy season shortened in comparison to neutral or La Nina
phases. Drought conditions in the year 2015/2016 also align with an El Niño phase.18

11
     Zimbabwe’s Third National Communication to the United Nations Framework Convention on Climate Change (TNC, 2016).
     URL: http://www.un-gsp.org/sites/default/files/documents/zwenc3.pdf
12
     Zimbabwe’s Third National Communication to the United Nations Framework Convention on Climate Change (TNC, 2016).
     URL: http://www.un-gsp.org/sites/default/files/documents/zwenc3.pdf
13
     WBG Climate Change Knowledge Portal (CCKP, 2021). Climate Data: Historical. URL: https://climateknowledgeportal.worldbank.
     org/country/zimbabwe
14
     Zimbabwe’s National Climate Change Response Strategy (NCCRS, 2015). URL: http://www4.unfccc.int/sites/nama/_layouts/UN/
     FCCC/NAMA/Download.aspx?ListName=NAMA&Id=165&FileName=Climate%20Change%20Response%20Strategy.pdf
15
     WBG Climate Change Knowledge Portal (CCKP, 2021). Climate Data: Historical. URL: https://climateknowledgeportal.worldbank.
     org/country/zimbabwe
16
     Zimbabwe Resilience Building Fund, 2016: El Niño-Southern Oscillation (ENSO) cycle events and their impacts in Zimbabwe.
     URL: http://www.zrbf.co.zw/download/library/5F00B100B2002900/enso-analysis--a5/
17
     Zimbabwe’s Third National Communication to the United Nations Framework Convention on Climate Change (TNC, 2016).
     URL: http://www.un-gsp.org/sites/default/files/documents/zwenc3.pdf
18
     Zimbabwe Resilience Building Fund, 2016: El Niño-Southern Oscillation (ENSO) cycle events and their impacts in Zimbabwe.
     URL: http://www.zrbf.co.zw/download/library/5F00B100B2002900/enso-analysis--a5/

CLIMATE RISK COUNTRY PROFILE: ZIMBABWE                                                                                            4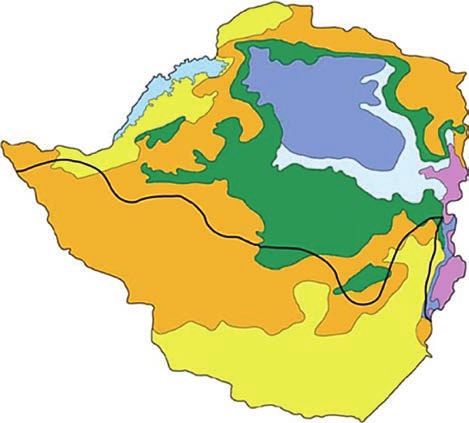
In addition, the Inter-Tropical Convergence Zone (ITCZ) plays a vital role in driving rainfall seasonality and
inter-annual variability. The country receives more rainfall when ITCZ moves further south, and vice versa.
Furthermore, a scientific study has revealed that positive Indian Ocean Dipole/Zonal Mode (IODZM), also
known as the anomalous positive Indian Ocean SST gradient, is strongly associated with rainfall deficits (or
droughts) in the country.19

Data Snapshots
TABLE 1.  Historical climate data for Zimbabwe from 1901 to 202020

 Climate Variables                                                                           1901–2020
 Annual Temperature (°C)                                                                        21.3
                                                                                               (20.4 – 22.9)
 Annual Min-Temperature (°C)                                                                    14.5
                                                                                               (13.4 – 15.8)
 Annual Max-Temperature (°C)                                                                    28.2
                                                                                               (26.7 – 30.1)
 Annual Precipitation (mm)                                                                    669.9
                                                                                             (390.6 – 1017.8)
Note: The medians (50th percentile) are highlighted in bold font, while the 10th and 90th percentiles are presented in parentheses.

Key Climate Trends
Mean annual precipitation exhibits a decreasing trend in the past decades (Figure 3). Late onset and early season
cessation of the rainy or growing season has been observed for all the agro-ecological regions.21

On the other hand, mean annual temperature has increased by roughly 0.03°C/year from 1970 to 2016. The
impact of the warming trend on the intensification of the droughts was more prominent during the Jan–March
period.22 Zimbabwe’s Meteorological Services Department has also recognized that the warming trends from the
1970s has put stress on agricultural and water sectors, which are keys to economic growth.23

19
     Manatsa, D., Chingombe, W. and Matarira, C. H. (2008). The impact of the positive Indian Ocean dipole on Zimbabwe droughts.
     International Journal of Climate, 28: 2011–2029. http://onlinelibrary.wiley.com/doi/10.1002/joc.1695/full
20
     WBG Climate Change Knowledge Portal (CCKP, 2021). Climate Data: Historical. URL: https://climateknowledgeportal.worldbank.
     org/country/zimbabwe
21
     Zimbabwe’s Third National Communication to the United Nations Framework Convention on Climate Change (TNC, 2016).
     URL: http://www.un-gsp.org/sites/default/files/documents/zwenc3.pdf
22
     Zimbabwe’s Third National Communication to the United Nations Framework Convention on Climate Change (TNC, 2016).
     URL: http://www.un-gsp.org/sites/default/files/documents/zwenc3.pdf
23
     The National Climate Policy of Zimbabwe (2016).

CLIMATE RISK COUNTRY PROFILE: ZIMBABWE                                                                                                5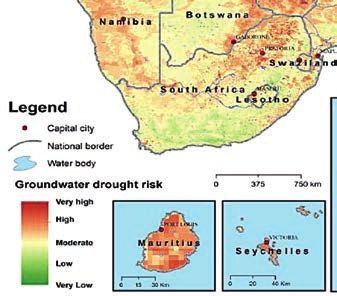
FIGURE 3. Mean annual rainfall of Zimbabwe from 1901–202024
1200mm
1000mm
800mm
Rainfall
600mm
400mm
200mm
1901 1914 1927 1940 1953 1966 1979 1992 2005 2018
Annual Mean 5 Year Smoothing
Projected Climate
Overview
Coupled Model Inter-comparison Project Phase 5 (CMIP5) models utilized within the Fifth Assessment Report
(AR5) of the Intergovernmental Panel on Climate Change (IPCC) provide projections of future temperature and
precipitation. These models project consistent warming that varies by emissions scenario; meanwhile projected
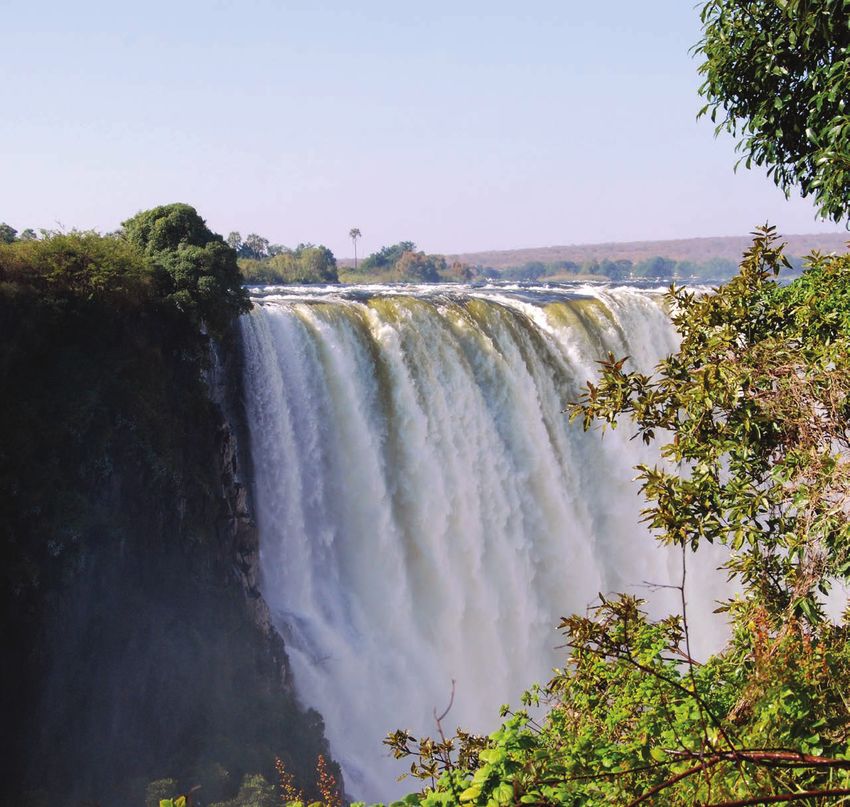
trends in rainfall are less certain, varying widely across both scenarios and models, 25 as shown in Figure 4.
Projected changes in temperature and precipitation are shown in Table 2.
FIGURE 4. Projected changes in Zimbabwe’s annual temperature (left) and precipitation (right)26
28 1500
1400
27
1300
26 1200
25 1100
degC
1000
mm
24
900
23 800
22 700
600
21
500
20 400
1980 2000 2020 2040 2060 2080 2100 1980 2000 2020 2040 2060 2080 2100
Year Year
Historical RCP 2.6 RCP 4.5 RCP 6.0 RCP 8.5
24
WBG Climate Change Knowledge Portal (CCKP, 2019). Climate Data: Historical. URL: https://climateknowledgeportal.worldbank.
org/country/zimbabwe
25
Zimbabwe’s Third National Communication to the United Nations Framework Convention on Climate Change (TNC, 2016).
URL: http://www.un-gsp.org/sites/default/files/documents/zwenc3.pdf
26
WBG Climate Change Knowledge Portal (CCKP, 2021). Climate Data: Projections. URL: https://climateknowledgeportal.worldbank.
org/country/zimbabwe/climate-data-projections
CLIMATE RISK COUNTRY PROFILE: ZIMBABWE 6Data Snapshots
TABLE 2. CMIP5 ensemble projected change (32 GCMs) in Zimbabwe’s annual temperature and
precipitation compared to reference period 1986–2005 under RCP8.527
CMIP5 Ensemble Projection 2020–2039 2040–2059 2060–2079 2080–2099
Annual Temperature Anomaly (°C) +1.2 +2.2 +3.4 +4.6
(+1.1 to +1.5) (+1.9 to +2.7) (+3.2 to +4.0) (+4.2 to +5.8)
Annual Precipitation Anomaly (mm) -3.3 -5.1 -7.4 -8.2
(–12.5 to +1.0) (–19.6 to +1.9) (–27.8 to –1.3) (–32.3 to –0.1)
Note: The medians (or 50th percentile) are shown in bold font and lower (10th percentile) and the higher (90th percentile) bonds are shown
in parentheses.
FIGURE 5. CMIP5 ensemble projected change (32 GCMs) in annual temperature (top) and
precipitation (bottom) by 2040–2059 (left) and by 2080–2090 (right) relative to 1986–2005
baseline under RCP8.528
27
WBG Climate Change Knowledge Portal (CCKP, 2021). Climate Data: Projections. URL: https://climateknowledgeportal.worldbank.
org/country/zimbabwe/climate-data-projections
28
WBG Climate Change Knowledge Portal (CCKP, 2021). Climate Data: Projections. URL: https://climateknowledgeportal.worldbank.
org/country/zimbabwe/climate-data-projections
CLIMATE RISK COUNTRY PROFILE: ZIMBABWE 7Key Climate Trends
As shown in Table 3, annual median precipitation is projected to decrease by roughly 1.2% (RCP 2.6) and
4.4% (RCP 8.5) in 2040–2059. By 2080–2099, annual median precipitation is projected to increase by
2.8% (RCP 2.6) and decrease by 10.7%. The rainfall reductions compared to the baseline period (1986–2005) are
more pronounced during wet season, especially from October to March. As seen in Figure 5, northern and eastern
parts of the country are projected to experience above normal precipitation while western and southern parts of
the country will tend to receive less than historical levels of precipitation.
TABLE 3. CMIP5 ensemble projection of change in annual precipitation
Baseline and Projected Upper Lower
Changes (mm) Maximum Quartile Median Quartile Minimum
1986–2005 Mean 1619.84 1075.50 858.56 725.87 465.20
2040–2059 RCP 2.6 −5.3% −2.4% −1.2% –2.9% 19.6%
RCP 4.5 −7.2% 1.5% 1.2% 6.9% 3.2%
RCP 6.0 −6.2% 0.8% 4.4% 4.6% 13.4%
RCP 8.5 −5.4% 0.9% −4.4% –5.4% 3.9%
2080–2099 RCP 2.6 −12.6% −1.4% 2.8% –0.2% 19.2%
RCP 4.5 −3.1% −1.4% 4.1% –1.3% 14.9%
RCP 6.0 −4.2% −0.3% 3.0% 4.0% 28.6%
RCP 8.5 −7.7% −5.9% −10.7% –13.1% −6.7%
As shown in Table 4, annual temperature is projected to increase by 1.2°C (RCP 2.6) and 2.2°C (RCP 8.5)
in 2040–2059. By 2080–2099, annual median temperature is projected to increase by 1.0°C (RCP 2.6) and
5.1°C (RCP 8.5). The rising temperatures compared to the baseline period are more noticeable during summer,
from September to December. The spatial distribution of temperature increase is relatively homogeneous across
the country, with a slightly higher warming trend projected in southern and western parts of the country.
TABLE 4. CMIP5 ensemble projection of change in annual temperature
Baseline and Projected Upper Lower
Changes (°C) Maximum Quartile Median Quartile Minimum
1986–2005 Mean 21.8 21.6 21.6 21.5 21.4
2040–2059 RCP 2.6 1.82 1.33 1.21 1.04 0.87
RCP 4.5 2.14 1.90 1.62 1.40 1.34
RCP 6.0 2.07 1.69 1.43 1.35 1.39
RCP 8.5 2.72 2.51 2.18 1.86 1.42
2080–2099 RCP 2.6 1.81 1.32 1.04 0.90 0.69
RCP 4.5 3.10 2.81 2.39 1.98 1.74
RCP 6.0 3.71 3.30 2.99 2.40 2.12
RCP 8.5 6.05 5.46 5.11 4.09 3.37
CLIMATE RISK COUNTRY PROFILE: ZIMBABWE 8CLIMATE CHANGE IMPACTS ON NATURAL HAZARDS
Natural Hazards
Data from the EM-Dat database (see Table 5) shows the country has endured various natural hazards, including
droughts, epidemic diseases, floods, and storms over the past century. From 1900 to 2017, events captured in the
database for Zimbabwe include 7 drought events, 22 epidemic episodes, 12 floods, and 5 storms, which resulted in
total deaths of 7000 people, with more than 20 million people affected, and total damage estimates of 950 million USD.
The country’s GDP growth has been severely impacted by a series of major droughts. The number of people affected
and economic loss caused by droughts have been observed to increase considerably. For instance, the drought episode
in 2007 affected 6 million individuals; and the drought in 2013 caused economic damage of up to 500 million USD in
addition to affecting over 4 million residents. Epidemic diseases, particularly bacterial and parasitic types, contribute
to significant portion of total deaths and total affected people by natural hazards. Floods also generate large human
and economic losses. As of 2017, the EM-DAT database includes a total of 9 riverine floods are accounted, affecting
over 300 thousand people, killing over 270 people and leading to monetary loss of above 270 million USD. Moreover,
analysis by Hallegatte et al. show Zimbabwe is one of the six countries where the poor are overexposed (or 50%
more likely) to the impacts of floods than nonpoor people.29
TABLE 5. Natural hazards occurrence and damage in Zimbabwe from 1900–2017,
extracted on Oct 25, 201730
Events Total Total Affected Total Damage
Natural Hazard Subtype Count Deaths (‘000) (Million USD)
Drought Drought 7 – 19122.618 551
Epidemic Bacterial disease 17 4,900 111.349 –
Parasitic disease 1 1,311 500 –
Viral disease 2 55 1.338 –
Others 2 71 10.102 –
Flood Flash flood 1 3 1.002 20
Riverine flood 9 271 313.02 272.9
Others 2 259 30.128 103.6
Storm Convective storm 2 41 2.475 –
Tropical cyclone 2 8 – 1.2
Others 1 11 – –
29
Hallegatte et al. (2017): Unbreakable. Building the Resilience of the Poor in the Face of Natural Disasters. URL: https://
openknowledge.worldbank.org/handle/10986/25335
30
EM-DAT: The Emergency Events Database - Universite catholique de Louvain (UCL) - CRED, D. Guha-Sapir - www.emdat.be,
Brussels, Belgium. https://www.emdat.be/database
CLIMATE RISK COUNTRY PROFILE: ZIMBABWE 9Climate Change Impacts
According to analysis of the CMIP5 multi-model ensemble projection,31 the annual likelihood of Zimbabwe
encountering severe drought is projected to increase by 21% in 2040 to 2059 and by 47% in 2080 to 2099
compared to the baseline period of 1986 to 2005 under the RCP8.5 scenario. It is projected that western
Zimbabwe is more likely to experience drought conditions. Extreme temperatures and precipitation events will
be more prominent in the country. The number of days per year with a maximum temperature greater than 35°C
is expected to increase by 39 days in the period from 2040 to 2059 and 108 days in 2080 to 2099 from the
reference period under RCP8.5. The number of days of consecutive dry spell per year (or days without significant
rainfall of at least 1mm) is projected to increase by 13 days in 2040 to 2059 and 25 days in 2080 to 2099.
Climate change is expected to negatively impact the future occurrence, intensity and magnitude of floods, droughts,
and epidemic episodes, which can consequentially lead to enormous social and monetary loss across multiple
economic sectors.32
Gender
An increasing body of research has shown that climate-related disasters have impacted human populations in
many areas including agricultural production, food security, water management and public health. The level of
impacts and coping strategies of populations depends heavily on their socio-economic status, socio-cultural
norms, access to resources, poverty as well as gender. Research has also provided more evidence that the
effects are not gender neutral, as women and children are among the highest risk groups. Key factors that
account for the differences between women’s and men’s vulnerability to climate change risks include: gender-
based differences in time use; access to assets and credit, treatment by formal institutions, which can constrain
women’s opportunities, limited access to policy discussions and decision making, and a lack of sex-disaggregated
data for policy change.33
31
WBG Climate Change Knowledge Portal (CCKP, 2021). Climate Data: Projections. URL: https://climateknowledgeportal.worldbank.
org/country/zimbabwe/climate-data-projections
32
Zimbabwe’s Third National Communication to the United Nations Framework Convention on Climate Change (TNC, 2016).
URL: http://www.un-gsp.org/sites/default/files/documents/zwenc3.pdf
33
World Bank Group (2016). Gender Equality, Poverty Reduction, and Inclusive Growth. URL: http://documents1.worldbank.org/
curated/en/820851467992505410/pdf/102114-REVISED-PUBLIC-WBG-Gender-Strategy.pdf
CLIMATE RISK COUNTRY PROFILE: ZIMBABWE 10CLIMATE CHANGE IMPACTS ON KEY SECTORS
Agriculture
In 2016, the total agricultural land area has reached 42% of the total land area. Meanwhile, employment in
agriculture accounts for 67% of the total employment.34 The majority of the agriculture is rain-fed, which makes
the sector highly vulnerable to climate change impacts, especially precipitation variability and climate-induced
natural hazards. Extreme weather events pose serious threats to the performance of the Zimbabwean agriculture
sector and are likely to be accelerated by adverse impacts of climate change in the future. Therefore, the country
has realized the importance of building climate resilience and facilitating low-carbon growth in this specific sector
through national sectoral policies and development planning, as articulated in the NDC.
In Zimbabwe, approximately 80% of agricultural production is rain-fed, while the remaining 20% is irrigated.
As one of the highest irrigation-dependent countries in the southern African region, Zimbabwe has deployed a
relatively large portion of its irrigated potential, with a total irrigated area of 123,000 ha. An extra 80,000 ha can
be irrigated from the estimated ground water available in the country.35 Therefore, water availability is the crucial
factor to agricultural development in the country. The country produces multiple grain crops which consists of maize,
sorghum, mhunga, rapoko, oilseeds and industrial crops including tobacco, cotton, edible dry beans and paprika.
With regards to market value, tobacco, cotton, and maize are the most important crops.36
Rain-fed agriculture is facing increasing threats with droughts and floods becoming more frequent and intense. The
rain-fed crop production in Africa is projected to see a decline of 12% by 2080.37 For Zimbabwe, maize is an important
agricultural product as it is the staple food and gaining even more importance with cereal yield having decreased since
the country’s independence in 1965.38 Over the past 15 years, maize yields have gradually declined while population
has increased, resulting in higher than usual levels of food insecurity in most parts of the country.39 Meanwhile, many
different crops including major cash crops such as tobacco, cotton, tea, coffee, and horticultural crops are irrigated.
Irrigated agriculture also encounters challenges as water demand increases and water availability declines.40
34
World Bank Open Data. Data retrieved in May 2021. URL: https://data.worldbank.org/
35
NEPAD–CAADP Bankable Investment Project Profile (2004). “Zimbabwe Smallholder Irrigation Development”. URL: http://
www.fao.org/tempref/docrep/fao/007/ae567e/ae567e00.pdf
36
Zimbabwe’s Third National Communication to the United Nations Framework Convention on Climate Change (TNC, 2016).
URL: http://www.un-gsp.org/sites/default/files/documents/zwenc3.pdf
37
K. Musiyiwa, W. Leal Filho, D. Harris, and J. Nyamangara (2014). Implications of Climate Variability and Change for Smallholder
Crop Production in Different Areas of Zimbabwe. Res. J. Environ. Earth Sci., 6(8): 394–401, 2014. URL: http://maxwellsci.com/print/
rjees/v6-394-401.pdf
38
World Bank Open Data. Data retrieved in September 2018. URL: https://data.worldbank.org/
39
Zimbabwe Resilience Building Fund, 2016: El Niño-Southern Oscillation (ENSO) cycle events and their impacts in Zimbabwe. URL:
http://www.zrbf.co.zw/download/library/5F00B100B2002900/enso-analysis--a5/
40
U. Adhikari et al. (2015). Climate change and eastern Africa: a review of impact on major crops. Food and Energy Security 2015;
4(2): 110–132 doi: 10.1002/fes3.61. URL: https://onlinelibrary.wiley.com/doi/epdf/10.1002/fes3.61
CLIMATE RISK COUNTRY PROFILE: ZIMBABWE 11Similarly, limited precipitation and extreme heat induced by climate change are likely to contribute to diminished
rangeland productivity, as well as decreased livestock production. A study shows that the majority of the country
will experience reduced rangeland carrying capacity for livestock and wildlife, as Net Primary Production (NPP)
drops from the current level of 8 tons/hectare per year to slightly above 5 tons/hectare per year by 2080.41 The
most intensive decline in rangeland productivity will appear in the Southwest and Northwest parts of the nation.42
Zimbabwe is divided into five agro-ecological regions
(AERs), also known as natural regions (Figure 6), FIGURE 6. Natural regions of Zimbabwe43
on the basis of the rainfall regime, soil quality and MOZAMBIQUE
V
vegetation, among other factors. The quality of the
land resource ranges from Natural Region (NR) I ZAMBIA
IV
(most suitable) through V (least suitable). Table 6 V IV IIA
provides detailed descriptions of these natural regions III
III
and their farming systems. I
IIB
As a result of climate change, Zimbabwe’s AERs have III
IV
already witnessed drastic changes. A study carried
III I
out in 2012 shows that drought prone regions, NR IV
and V, had become drier than previously experienced
and increased in area by about 6% and 23%, BOTSWANA
V E
respectively.44 Major food producing regions, NR II BI
Q
U
M
ZA
and III, had shrunk remarkably by 49% and M
O
SOUTH AFRICA
14% respectively.45 These changes indicate that 100 0 100 200 300 km
Zimbabwe is trending towards more arid and non-
arable climatic conditions, which could potentially
lead to food insecurity, increase in unemployment
and a reduction in economic growth.
41
IIED Climate Change Working Paper No. 3 (December 2012). Climate change impacts, vulnerability and adaptation in Zimbabwe.
URL: http://pubs.iied.org/pdfs/10034IIED.pdf
42
T. Agrer (June 2017). Zimbabwe Climate Change Technical Assistance Program: Strategic Actions Supporting Livestock.
43
Food and Agriculture Organization of the United Nations (FAO, 2006). Fertilizer use by crop in Zimbabwe, First Version.
URL: http://www.fao.org/docrep/009/a0395e/a0395e00.htm#Contents
44
C. Manyeruke, S. Hamauswa, L. Mhandara (2013). The Effects of Climate Change and Variability on Food Security in Zimbabwe:
A Socio-Economic and Political Analysis. International Journal of Humanities and Social Science Vol. 3 No. 6 [Special Issue –
March 2013]. URL: http://www.ijhssnet.com/journals/Vol_3_No_6_Special_Issue_March_2013/26.pdf
45
C. Manyeruke, S. Hamauswa, L. Mhandara (2013). The Effects of Climate Change and Variability on Food Security in Zimbabwe:
A Socio-Economic and Political Analysis. International Journal of Humanities and Social Science Vol. 3 No. 6 [Special Issue –
March 2013]. URL: http://www.ijhssnet.com/journals/Vol_3_No_6_Special_Issue_March_2013/26.pdf
CLIMATE RISK COUNTRY PROFILE: ZIMBABWE 12TABLE 6. Descriptions of the natural regions of Zimbabwe46
% of
Natural Area total land Annual rainfall Farming Systems
Region (000 ha) area (%) (mm)
I 613 1.56 > 1 000 Rain in all months of the year, Suitable for dairy farming forestry, tea,
relatively low temperatures coffee, fruit, beef and maize production
II 7 18.63 700–1 050. Rainfall confined to summer Suitable for intensive farming, based on
343 maize, tobacco, cotton and livestock
III 6 17.43 500–800. Relatively high temperatures Semi-intensive farming region Suitable
855 and infrequent, heavy falls of rain, and for livestock production, together with
subject to seasonal droughts and severe production of fodder crops and cash crops
mid-season dry spells under good farm management
IV 13 33.03 450–650. Rainfall subject to frequent Semi-extensive region. Suitable for farm
010 seasonal droughts and severe dry spells systems based on livestock and resistant
036 during the rainy season fodder crops. Forestry, wildlife/tourism
V 10 26.2 < 450. Very erratic rainfall. Northern Extensive farming region. Suitable for
283 low veldt may have more rain but the extensive cattle ranching. Zambezi Valley
topography and soils are poor is infested with tsetse fly. Forestry, wildlife/
tourism
Water
Total annual water generation in the country amounts to over 23 billion cubic meters, which is mainly replenished
through rainfall and runoff into rivers, streams, lakes, aquifers, reservoirs, and wetlands. The country relies significantly
on its surface water resources (about 90%) due to limited ground water resources (about 10%).47 There are
seven river catchments in Zimbabwe, namely Gwayi, Manyame, Mazowe, Mzingwane, Runde, Sanyati and Save.48
Table 7 below breaks down annual water generation by catchment. There are over 8000 dams in the country;
however, only 149 large dams, which account for 80% of the allocated water to storage, are regularly tracked by
ZINWA.49 The implications of climate change on Zimbabwe’s water resources management include limited runoff for
hydropower plants, increased demand within the agriculture and energy generation sectors, and regional differences
in water supply and shortages.50 Specifically, warming temperatures can contribute to increased water loss through
evapotranspiration;51 and lower rainfall will negatively affect groundwater recharge and water runoff.52
46
Food and Agriculture Organization of the United Nations (FAO, 2006). Fertilizer use by crop in Zimbabwe, First Version.
URL: http://www.fao.org/docrep/009/a0395e/a0395e00.htm#Contents
47
Zimbabwe’s Third National Communication to the United Nations Framework Convention on Climate Change (TNC, 2016).
URL: http://www.un-gsp.org/sites/default/files/documents/zwenc3.pdf
48
Zimbabwe’s National Climate Change Response Strategy (NCCRS, 2015). URL: http://www4.unfccc.int/sites/nama/_layouts/UN/
FCCC/NAMA/Download.aspx?ListName=NAMA&Id=165&FileName=Climate%20Change%20Response%20Strategy.pdf
49
Preparation of A National Water Resources Master Plan, Interim Report-1, Volume 1 - Main Report (October 2017)
50
Preparation of A National Water Resources Master Plan, Interim Report-1, Volume 1 - Main Report (October 2017)
51
Zimbabwe’s Third National Communication to the United Nations Framework Convention on Climate Change (TNC, 2016). URL:
http://www.un-gsp.org/sites/default/files/documents/zwenc3.pdf
52
Preparation of A National Water Resources Master Plan, Interim Report-1, Volume 1 - Main Report (October 2017)
CLIMATE RISK COUNTRY PROFILE: ZIMBABWE 13TABLE 7. Runoff generation by catchment (Source: MRW/ZINWA, 2007)
Unit Mean Annual Gross Mean Annual
Catchment Area (km2) Runoff (mm) Runoff (× 106 m3)
Gwayi 87,960 21 1,856
Manyame 40,497 82 3,306
Mazowe 34,944 131 4,582
Mzingwane 62,451 28 1,724
Runde 41,056 52 2,148
Sanyati 74,534 52 3,905
Save 48,448 126 6,094
Water availability could be tremendously affected by changes in annual precipitation. A small decline in mean
annual precipitation could potentially lead to a significant drop in mean annual runoff and groundwater recharge.
For instance, a 3 to 7% decrease in annual rainfall under a Business-as-usual emission scenario is projected to
cause a 23% annual runoff decline in Sanyati catchment by 2050 and 35% by 2080 (see Table 8).53
TABLE 8. Estimated current, 2050, and 2080 mean annual runoff (Giga-Liter/Year) in
Zimbabwean catchments under two emissions scenarios
2050 2080
2050 Business Ecologically 2080 Business Ecologically
Current (World as usual aware scenario as usual aware
Catchment Climate Data) scenario (A2a) (B2a) scenario (A2a) scenario (B2a)
Gwayi 2,088 – 1,047 (−50%) – 1,432 (−31%)
Manyame 4,496 4,244 (−6%) 4,661 (4%) 4,046 (−10%) 4,736 (5%)
Mazowe 5,665 4,825 (−15%) 5,559 (−2%) 4,874 (−12%) 5,443 (−4%)
Mzingwane 1,082 – 379 (−65%) – 356 (−67%)
Runde 3,530 1,967 (−44%) 2,343 (−33%) 1,311 (−63%) 2,271 (−26%)
Sanyati 6,905 5,314 (−23%) 6,248 (−10%) 4,483 (−35%) 6,471 (−6%)
Save 8,010 5,455(−32%) 6,558 (−18%) 4,970 (−38%) 6,414 (−20%)
Note: Percentage decreases in recharge are shown in brackets.
53
R. Davis and R. Hirji (2014). Climate Change and Water Resources Planning, Development and Management in Zimbabwe. URL:
http://documents.worldbank.org/curated/en/925611468329355687/pdf/937310WP0Box380babwe000Issues0Paper.pdf
CLIMATE RISK COUNTRY PROFILE: ZIMBABWE 14TABLE 9. Estimated groundwater recharge (Giga-Liter/Year) for Zimbabwean catchments
(Source: Davis and Hirji, 2014)
2050 2080
2050 Business Ecologically 2080 Business Ecologically
Current (World as usual aware as usual aware
Catchment Climate Data) scenario (A2a) scenario (B2a) scenario (A2a) scenario (B2a)
Gwayi 1,596 1,438 (−10%) 1,520 (−5%) 1,359 (−15%) 1,549 (−3%)
Manyame 1,907 1,868 (−2%) 1,932 (1%) 1,839 (−4%) 1,944 (2%)
Mazowe 1,918 1,791 (−7%) 1,901 (−1%) 1,811 (−6%) 1,844 (−2%)
Mzingwane 632 537 (−15%) 558 (−12%) 473 (−25%) 556 (−12%)
Runde 1,449 1,215 (−16%) 1,277 (−12%) 1,096 (−24%) 1,265 (−13%)
Sanyati 2,750 2,549 (−7%) 2,668 (−3%) 2,441 (−11%) 2,694 (−2%)
Save 2,660 2,279 (−14%) 2,439 (−8%) 2,197 (−17%) 2,418 (−9%)
Note: Percentage decreases in recharge are shown in brackets.
Some of the key findings of R. Davis and R. Hirji (2014) include: mean annual runoff in drier southern
catchments (e.g. Mzingwane and Gwayi) could decline significantly due to climate change, while northern
catchments (e.g. Manyame and Mazowe) will remain
relatively unaffected; similarly, negative impacts
on groundwater will be the strongest in southern FIGURE 7. Groundwater drought risk for
drier catchments (e.g. Runde and Mzingwane)54 Southern Africa (Source: R. Davis and
compared to northern catchments. R. Hirji , 2014)
The impacts of climate change on water resources
could be diverse. For example, changes in runoff
could limit hydropower generation, increasing
temperatures may increase water demand for
agriculture and energy generation, decreasing rainfall
could increase the cost for water treatment and
wastewater management, and climate change
might lead to more frequent and intensified natural
hazards including floods and droughts. In particular,
groundwater recharge is highly dependent on rainfall,
and therefore decreases in rainfall will negatively
impact groundwater availability. The map shows
the groundwater drought risk for southern Africa,
which indicates that Zimbabwe is highly susceptible
to groundwater drought risk. It was estimated that
the percentage of population at very high risk of
groundwater drought could rise from 32% to 86%
without measures to adapt to the effects of climate
change (see Figure 7).
54
R. Davis and R. Hirji (2014). Climate Change and Water Resources Planning, Development and Management in Zimbabwe. URL:
http://documents.worldbank.org/curated/en/925611468329355687/pdf/937310WP0Box380babwe000Issues0Paper.pdf
CLIMATE RISK COUNTRY PROFILE: ZIMBABWE 15A recent preliminary analysis on climate change impacts on Zimbabwe’s mean annual river runoff and potential
evapotranspiration (PET) using 121 climate scenarios (CMIP3 and CMIP5) reached a similar conclusion.
Specifically, mean annual runoff is projected to decline in all seven basins under majority of scenarios for the
2041–2050 period compared to the 1961–1990 baseline, ranging between –60% and +40%.55 Change in PET
is projected to increase for all basins across all scenarios, ranging from +5% to 15%, with Gwayi showing the
highest changes by the 2040s.56
Energy
The energy sector is the largest contributor,
approximately 49%, to the country’s total greenhouse FIGURE 8. Estimated solar PV power
gas (GHG) emissions.57 In 2012, 59% of energy was generation potential for Zimbabwe
generated from non-carbon resources in the form (1994–2015)63
of hydropower from the Lake Kariba power station
and 39% of energy was derived from coal power
plants in Hwange, Munyati, Harare and Bulawayo
(see Table 10). Electricity demand of the country
is anticipated to double between 2012 and 2020,58
which will require a tremendous increase in power
generation capacity, possibly by taking advantage
of the country’s high potential in renewable energy
(i.e. hydropower and solar). Currently, 750MW hydro
power plants have been installed with additional
300MW planned for the Kariba hydro power plant.59
There remains 1720MW hydropower potentials on
the Zambezi River to be developed and over 20 mini
hydro sites identified to be fully developed.60 The
country has an average solar radiation of 20 MJ/
m2/day.61 The spatial distribution of Zimbabwe’s solar
PV power generation potential is shown in Figure 8.62
55
WBG (2015, draft). Background note C: Enhancing the Climate Resilience of Zimbabwe’s Infrastructure: Selected Illustrations in the
Water and Power Sectors.
56
WBG (2015, draft). Background note C: Enhancing the Climate Resilience of Zimbabwe’s Infrastructure: Selected Illustrations in the
Water and Power Sectors.
57
Zimbabwe’s First Nationally Determined Contribution (NDC). URL: http://www4.unfccc.int/ndcregistry/PublishedDocuments/
Zimbabwe%20First/Zimbabwe%20First%20NDC.pdf
58
Zimbabwe’s National Climate Change Response Strategy (NCCRS, 2015). URL: http://www4.unfccc.int/sites/nama/_layouts/UN/
FCCC/NAMA/Download.aspx?ListName=NAMA&Id=165&FileName=Climate%20Change%20Response%20Strategy.pdf
59
Renewable Energy Market Study Zimbabwe (2017). URL: https://www.rvo.nl/sites/default/files/2017/11/renewable-energy-market-
study-zimbabwe-2017.pdf
60
Renewable Energy Market Study Zimbabwe (2017). URL: https://www.rvo.nl/sites/default/files/2017/11/renewable-energy-market-
study-zimbabwe-2017.pdf
61
Renewable Energy Market Study Zimbabwe (2017). URL: https://www.rvo.nl/sites/default/files/2017/11/renewable-energy-market-
study-zimbabwe-2017.pdf
62
WBG Global Solar Atlas (2018). URL: http://globalsolaratlas.info/downloads/zimbabwe
63
WBG Global Solar Atlas (2018). URL: http://globalsolaratlas.info/downloads/zimbabwe
CLIMATE RISK COUNTRY PROFILE: ZIMBABWE 16TABLE 10. Production of electricity in Zimbabwe in GWh (Source: NCCRS, 2015)
Generated Energy (GWh)
Power Station 2010 2011 2012
Hydro generators (Kariba) 5,798.78 5,091.42 5,372.00
Coal generators (Hwange, Munyati, Bulawayo, Harare) 2,711.78 3,811.60 3,575.00
Other renewable generators (Border Timbers, Hippo Valley, Triangle) 167.23
Other generators (not included above) 2.60
Total Energy Generated 8,510.56 8,903.02 9,116.83
The impacts of climate change on the energy sector consist of changing energy demand for heating and cooling,
affecting energy supply composition and technologies, and requiring adaptation measures to reduce climate-induced
risks. Rising temperatures will likely reduce energy demand for heating while increasing energy demand for residential
and commercial cooling.64 The number of cooling degree days in the country is projected to increase by 1194°F/year
in 2040 to 2059 and 2902°F/year in 2080 to 2099 from baseline period under RCP8.5.65 This is translated into
an additional of 3.3°F/day and 8.0°F/day cooling respectively. On the contrary, the number of heating degree days
is expected to decrease by 225°F/year (or 0.6°F/day) by 2040 to 2059.66 The majority of the energy supply in the
country is derived from hydropower generation. The projected reduction in precipitation, increase in evaporation, and
increase in water demand will reduce river runoff and thus negatively impact hydropower generation. Hence, there is
urgent need for the country to seek alternative energy resources, such as natural gas, solar power, etc. In fact, most
areas of the country are endowed with solar potential with insulation of up to 6 kW/m2 per day.67 In the NDC, the
country communicated its intention to install $4.23 billion in solar lighting, solar water heaters and solar powered
off-grids. Overall, climate change impacts encourage the energy industry to adopt technologies that enhance energy
efficiency and performance. Lastly, more severe and/or frequent extreme weather conditions and natural disasters
could damage energy infrastructures (e.g. dams, solar panels, rails, grids). Therefore, building climate-smart energy
infrastructures and establishing effective post-disaster response and recovery measures become critical.
Forestry
The forestry sector also plays vital role in supporting socio-economic growth of the country. Specifically, forest rents
make up 4.1% of the country’s total GDP in 2016.68 Unfortunately, in the past decades the country’s forest cover has
been declining dramatically due mainly to over-exploitation and degradation of the indigenous forest. The ratio of forest
area over total land area has seen a drastic decrease from 57% in 1990 to 36% in 2015 in the country.69 Between
64
Fifth Assessment Report of The Intergovernmental Panel on Climate Change (IPCC AR5). http://www.ipcc.ch/pdf/assessment-
report/ar5/wg2/WGIIAR5-IntegrationBrochure_FINAL.pdf
65
WBG Climate Change Knowledge Portal (CCKP, 2021). Climate by Sector-Energy. URL: https://climateknowledgeportal.worldbank.
org/country/zimbabwe/climate-sector-energy
66
WBG Climate Change Knowledge Portal (CCKP, 2021). Climate by Sector-Energy. URL: https://climateknowledgeportal.worldbank.
org/country/zimbabwe/climate-sector-energy
67
Zimbabwe’s National Climate Change Response Strategy (NCCRS, 2015). URL: http://www4.unfccc.int/sites/nama/_layouts/UN/
FCCC/NAMA/Download.aspx?ListName=NAMA&Id=165&FileName=Climate%20Change%20Response%20Strategy.pdf
68
World Bank Open Data (2018). Forest rents (% of GDP) from 1990 to 2016. Note: This indicator measures forest rents as a share of
the gross domestic product (GDP) of a given country. Forest rents are round-wood harvest times the product of average prices and
a region-specific rental rate. URL: https://data.worldbank.org/indicator/NY.GDP.FRST.RT.ZS?locations=ZW
69
World Bank Open Data (2018). Forest area (% of land area) from 1990 to 2015. URL: https://data.worldbank.org/indicator/
AG.LND.FRST.ZS?locations=ZW
CLIMATE RISK COUNTRY PROFILE: ZIMBABWE 171990 and 2010, Zimbabwe suffered loss of an average of 327,000 ha or 1.48% forest cover per year, totaling over
6.5 million ha.70 A wide range of factors are responsible for deforestation and land degradation. These include expansion
of agricultural land, overharvesting of fuel wood, encroachment of human and industrial settlements, lack of sustainable
land-use and forest management system, and frequent wildfires (due to both anthropogenic and natural causes).
Climate change will potentially influence the plantation species composition of the forest ecosystems, extents of
forest ecosystems, species volume and density, biodiversity characteristics, frequency and intensity of forest fires.
The three major forest ecosystems in the country are the Baikiaea (25% of total forest cover), Miombo (30%
of total forest cover), and Mopane (45% of total forest cover). Baikiaea is mainly located in western region; and
Miombo dominates northern and eastern regions of the country. Figure 9 shows the current and projected forest
FIGURE 9. Current, 2050 and 2070 predictions of Baikiaea, Mopane and Miombo overlaid
(Source: INDUFOR, 2017)
70
Zimbabwe Forest Infomration and Data. URL: https://rainforests.mongabay.com/deforestation/2000/Zimbabwe.htm
CLIMATE RISK COUNTRY PROFILE: ZIMBABWE 18cover by three forest ecosystems for 2050 and 2070. The forest cover of Baikiaea and Miombo ecosystems are
both projected to decrease dramatically, to 18% and 10% by 2050 respectively. Meanwhile, Mopane forests are
expected to expand to 70% by 2050.71 The impacts of climate change on plantation species are not statistically
significant for the major plantation species in Zimbabwe, namely Pinus patula, Pinus taeda and Eucalyptus grandis.
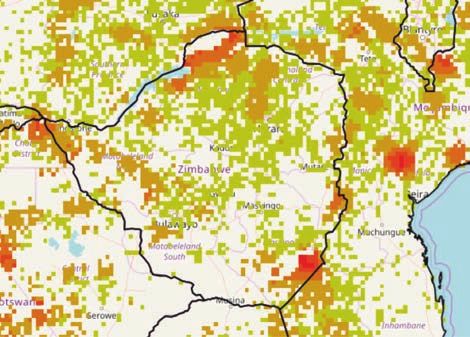
As shown in Figure 10, wildfire has historically been
one of the most dangerous natural hazards in the FIGURE 10. Wildfire density in Zimbabwe
country.72 High fire density appears in northern and for 1997–2010 (Source: Global Risk Data
southeastern parts of the country. Statistically speaking, Platform, 2018)
wildfire is associated with more than 1 million hectares
of loss in rangelands and forests per year.73 Wildfire
hazard in the country has been classified as high by
ThinkHazard, because available information indicates
that the possibility of encountering weather conducive
for wildfires that could lead to both social and economic
loss in a given year surpasses 50%.74 Climate induced
heat stress, droughts, and reduced rainfall amount are
both likely to increase the frequency and intensity of
wildfires in the region. Sustained high temperatures
and decreased precipitation both are contributors to
droughts, which tend to be the drivers for wildfires. In
other words, climate change is likely to increase the Less than 30 (events/pixel)
frequency and intensity of wildfires, creating challenges 30 - 100 (events/pixel)
for sustainable forest management. 100 - 300 (events/pixel)
300 - 1,000 (events/pixel)
More than 1,000 (events/pixel)
No data
71
Indufor/AEMA, Ministry of Environment, Water and Climate (2017). Impacts of Climate Change on Forest Ecosystem and
Plantation Distribution in Zimbabwe.
72
Global Risk Data Platform (2018). This dataset includes an average of fires density over the period 1997–2010. It is based
on the modified algorithm 1 product of World Fire atlas (WFA, ESA-ESRIN) dataset. URL: http://preview.grid.unep.ch/
index.php?preview=data&events=fires&evcat=3&lang=eng
73
Zimbabwe Human Development Report (2017). Climate Change and Human Development: Towards Building a Climate
Resilient Nation. URL: http://www.zw.undp.org/content/dam/zimbabwe/docs/key%20documents/
UNDP_ZW_2017ZHDR_Briefs%20-%20Climate%20Change%20and%20Health.pdf.
74
Think Hazard (2018). URL: http://thinkhazard.org/en/report/271-zimbabwe/WF
CLIMATE RISK COUNTRY PROFILE: ZIMBABWE 19ADAPTATION
Institutional Framework for Adaptation
Name Area of Work
Governmental
The Ministry of • The Ministry of Environment, Water and Climate as the National Focal Point on Climate Change,
Environment, is mandated to guide the nation’s compliance in all multi-lateral environmental agreements,
Water and Climate including INDC.
(MEWC)75 • The National Technical Committee, chaired by MEWC, is composed of line ministries, private
sector, CSOs, research institutions, financiers, development partners, etc. It is responsible for
implementation, financing, capacity building and Measurement, Reporting and Verification
(MRV) system for NDC implementation as directed by the steering committee and in line with
the Paris Agreement.
• MEWC has initiated the National Adaptation Plan (NAP) development process which seeks to
develop medium to long term approaches for reducing vulnerability to climate change impacts
and facilitating the integration of climate adaptation into ongoing planning processes at
national and sub- national levels.
High Level National • The existing High Level National Steering Committee, which is chaired by the Office of the
Steering Committee President and Cabinet and composed of heads of line ministries, is responsible for providing
policy direction in the implementation of the NDC in line with National Development Objectives.
The Environmental • The Environmental Management Agency (EMA) is a statutory body responsible for ensuring the
Management Agency sustainable management of natural resources and protection of the environment, the prevention
(EMA)76 of pollution and environmental degradation, the preparation of Environmental Plans for the
management, and protection of the environment.
• The NAP development process is championed under the Scaling Up Adaptation in Zimbabwe
through Strengthening Integrated Planning Systems Project, an initiative led by the Government
of Zimbabwe supported by the United Nations Development Programme (UNDP) and
implemented by the EMA.
International
Zimbabwe • ZimVAC is a consortium of Government, UN agencies, NGOs and other international
Vulnerability organizations established in 2002, led and regulated by the government. It is chaired by Food
Assessment and Nutrition Council (FNC), a department in the Office of the President and Cabinet whose
Committee mandate is to promote a multi-sectoral response to food insecurity and nutrition problems.
(ZimVAC)77
Regional/NGO
Zero Regional • ZERO is the lead agency in Zimbabwe for the implementation of the United Nations sponsored
Environment Millennium Development Goals (MDGs) and functions as the Regional Secretariat for the
Organization (ZERO) Community Organizations Regional Network (CORN), a SADC country member network.
• The institution coordinates, catalyzes, facilitates and evaluates various types and levels of
development projects and interventions in the region. Projects developed and administered by
ZERO include agricultural productivity, land resources, renewable energy, and health studies.
75
Zimbabwe’s First Nationally Determined Contribution (NDC). URL: http://www4.unfccc.int/ndcregistry/PublishedDocuments/
Zimbabwe%20First/Zimbabwe%20First%20NDC.pdf
76
The Environmental Management Agency of Zimbabwe. URL: https://www.ema.co.zw/index.php/2014-06-12-03-49-33/
mission-vision-values.html
77
Zimbabwe Vulnerability Assessment Committee (ZimVAC) 2017 Rural Livelihoods Assessment Report. https://docs.wfp.org/api/
documents/WFP-0000019918/download/?_ga=2.17595833.181058783.1510028610-164740008.1510028610
CLIMATE RISK COUNTRY PROFILE: ZIMBABWE 20You can also read