Zombie-Lending in the United States - Prevalence versus Relevance
←
→
Page content transcription
If your browser does not render page correctly, please read the page content below
Zombie-Lending in the United States
                                                                          Prevalence versus Relevance

                                                                                                              ∗
                                                                                    Maximilian Göbel
                                                                  ISEG - Universidade de Lisboa, UECE, REM
                                                                                                          †
                                                                                       Nuno Tavares
                                                                            ISEG - Universidade de Lisboa
arXiv:2201.10524v2 [econ.GN] 3 Jul 2022

                                                                                First Draft: September 19, 2021
                                                                                    This Draft: July 5, 2022

                                                                                           Abstract

                                                    Extraordinary fiscal and monetary interventions in response to the COVID-19 pandemic
                                                have revived concerns about zombie prevalence in advanced economies. Within a sample of
                                                publicly listed U.S. companies, we find zombie prevalence and zombie-lending not to be a
                                                widespread phenomenon per se. Nevertheless, our results reveal negative spillovers of zombie-
                                                lending on productivity, capital-growth, and employment-growth of non-zombies as well as
                                                on overall business dynamism. It is predominantly the class of healthy small- and medium-
                                                sized companies that is sensitive to zombie-lending activities, with financial constraints further
                                                amplifying these effects.

                                                Keywords: zombie lending; spillovers; non-viable firms; productivity; business dynamism

                                                JEL Codes: D24, E24, G21, L25, O40.

                                                Acknowledgements: For helpful comments we thank, without implicating, Viral V. Acharya,
                                                Philippe Goulet Coulombe, Panagiotis Avramidis, Stefano Colonnello, Tommaso Oliviero,
                                                Petru Crudu and the participants of the Finance Workshop 2022 at Ca’ Foscari University of
                                                Venice.

                                             ∗
                                               Corresponding author. E-mail: maximilian.goebel@phd.iseg.ulisboa.pt. This work was supported by the FCT
                                          (Fundação para a Ciência e a Tecnologia) [grant number UIDB/05069/2020]. REM – Research in Economics and
                                          Mathematics, UECE – Research Unit on Complexity and Economics.
                                             †
                                               E-mail: nuno.tavares@phd.iseg.ulisboa.pt
1     Introduction

The COVID-19 pandemic constitutes the single most disruptive event the world economy has
experienced since the second world war. The tremendous health and safety challenges posed by
the pandemic, forced governments to undertake unprecedented action to contain the spread of the
disease. Many countries adopted strict lockdown policies that constrained firms in nonessential
sectors to shut down completely. Policy responses designed to keep businesses afloat included
public support on firms’ liquidity, such as wage bills and tax relief schemes, moratoriums on credit
installment payments, and credit guarantees. Although there is a large consensus about the need
for measures that help flattening the curve of corporate insolvency of otherwise viable firms, there
is increasing concern that such measures combined with ill-designed screening schemes might have
allowed resources to flow into non-viable firms commonly known as zombies Boddin et al. (2020).1

The term“zombie” was first introduced by Caballero et al. (2008) in their analysis of Japan’s ”lost
decade” of the 1990s and is often used to describe firms that are consistently unable to generate
enough profits to meet their debt-servicing expenses. The literature on the topic has been consistent
in identifying zombies and zombie-lending as drivers of productivity slowdown, either by stifling
overall productivity growth or by intensifying misallocation of resources in the economy (Caballero
et al., 2008; McGowan et al., 2018). The literature also points to the fact that zombie-enduced
congestion contributes to declining profits of healthy firms (non-zombies), discouraging investment
and entry of new firms (newbies) (see for instance Hallak et al. (2018) for the European case). The
rise of zombies is often associated with weaknesses stemming from the financial sector (Andrews
and Petroulakis, 2019). Weaker banks, overflowed with doubtful assets sunken into zombies, may
have strong incentives to engage in debt evergreening practices, allowing them to roll over loans
instead of writing them off, thus exacerbating resource misallocation (Peek and Rosengren, 2005;
Storz et al., 2017).

Extraordinary monetary stimulus and lingering crisis-driven support for small- and medium-sized
enterprises (SME) was the European response to the Global Financial Crisis (GFC). Combined with
institutional factors, such as poor insolvency regimes, these policies have raised concerns that non-
viable firms are kept alive artificially (McGowan and Andrews, 2018). Recent events, prompted by
the pandemic, have further stimulated the debate about whether these actions, although justifiable,
may fuel the zombie phenomenon, as the need to act fast and decisively reduces incentives and
increases the difficulty to accurately screen the creditworthiness of borrowers (Laeven et al., 2020).
The U.S. economy is no exemption. The unprecedented fiscal and monetary policy support in
the wake of the COVID-19 pandemic has triggered similar fears of firm zombification2 . Favara
et al. (2022) find that zombie prevalence is not widespread among private and publicly listed
firms in the U.S., which leads them to infer that zombie firms only have a minor impact on

   1
     Hoshi et al. (2022) find evidence for the case of Japan, where poorly performing firms made frequent use of
government lending programs. Yet, these firms do not necessarily fall under their zombie definition.
   2
     See for instance: ”Here’s one more economic problem the government’s response to the virus has unleashed:
Zombie firms” (Washington Post, June 23, 2020); ”Pandemic debt binge creates new generation of ‘zombie’ com-
panies” (Financial Times, September 13, 2020)

                                                       1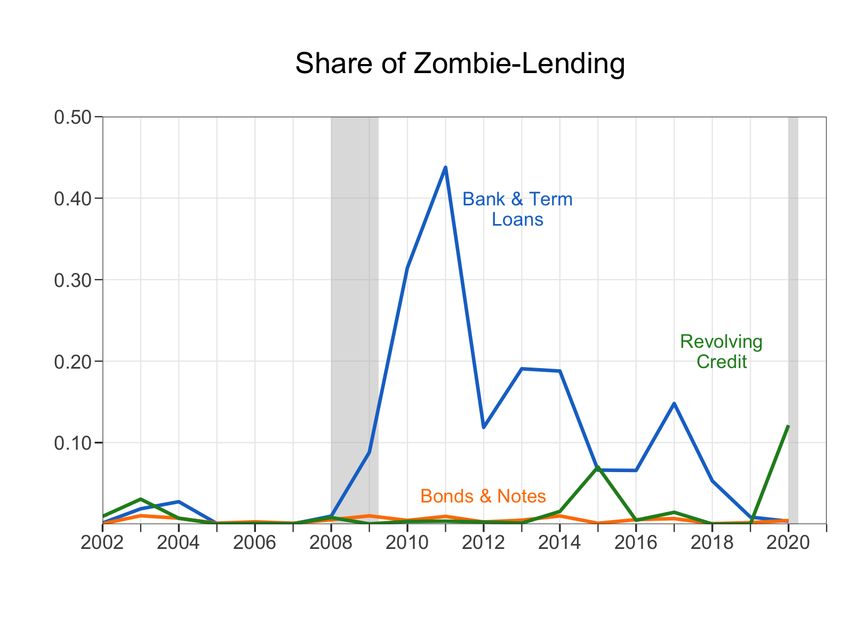
aggregate productivity and credit misallocation in the U.S. economy. While Favara et al. (2022)
set the primary focus on banks’ engagement in zombie-lending, our objective is to understand the
potential spillover effects of granting credit to zombies on healthy firms.

In other parts of the world, the literature has already explored the zombie phenomenon much
more thoroughly. The evidence is rather unambiguous. Several studies on Japanese and European
firms have found zombification to constrain the flourishing of non-zombies, leading to diminished
growth in productivity, investment, and employment (Caballero et al., 2008; McGowan et al.,
2018; Andrews and Petroulakis, 2019; Acharya et al., 2019). Others go even further by noting
that zombie prevalence interferes with an efficient transmission of monetary policy (Acharya et al.,
2020). Despite these findings, little evidence has been brought to bear about the influence of
zombies and, in particular zombie-lending, on economic outcomes in the U.S.3 In this paper, we
intend to address this gap by analysing potential spillovers of zombification – in particular zombie-
lending – on productivity, investment, employment-growth, and business entry dynamics. We
merge firm-level data of publicly listed firms, sourced from Compustat and Standard & Poor’s
Capital IQ for the period of 2002-2020, to identify non-viable firms and their debt structure. This
data set is in so far appealing as it allows us to not only distinguish between debt, intermediated
by banks, and credit, taken up via the bond market, but to also discriminate between short- and
long-term funding.

Our contribution to the literature on zombification is threefold. Second to Favara et al. (2022) we
are among the first to provide an overview of the degree of zombie prevalence among publicly listed
U.S. companies. We construct two alternative measures of zombie identification, a broader version
that operationalizes the concept based on McGowan et al. (2018), and a narrower version that
includes expectations about future profitability (Banerjee and Hofmann, 2018). Both definitions
reveal a steady increase in the share of zombie firms in the U.S. dating back to the mid-’90s. After
peaking during the GFC, the share of zombies started to dwindle from 2010 onwards, although
still far from pre-crisis levels. Yet, zombie prevalence does not seem to be a defining feature in
the U.S., particularly if we use more stringent and demanding criteria to access the zombie status
of firms. no Our second contribution differentiates us from Favara et al. (2022), who pose more
emphasis on analyzing banks’ zombie-lending engagements. We, however, make an attempt at
answering the question whether the lack of prevalence translates into the irrelevance of zombies
when it comes to economic outcomes. Our results suggest it does not. We find negative spillover
effects of zombie-lending on the performance of healthy companies, emerging both from public debt
markets as well as from the traditional bank-lending channel. The impact is most pronounced for
small- and medium-sized firms, corroborating the findings in Banerjee and Hofmann (2020). Bank-
dependency and lack of access to the bond market further amplify the negative effects, suggesting
financial constraints to be a catalyst for the negative spillovers of zombie-lending. Lastly, our
findings add to the literature on business dynamism. The results suggest that inflows of zombie-

   3
    Banerjee and Hofmann (2020) include the United States in their analysis of zombification in 14 advanced
economies, but focus more on the life cycle of zombies across several countries than on the micro- and macroeconomic
consequences of zombification – and in particular lending to zombies.

                                                         2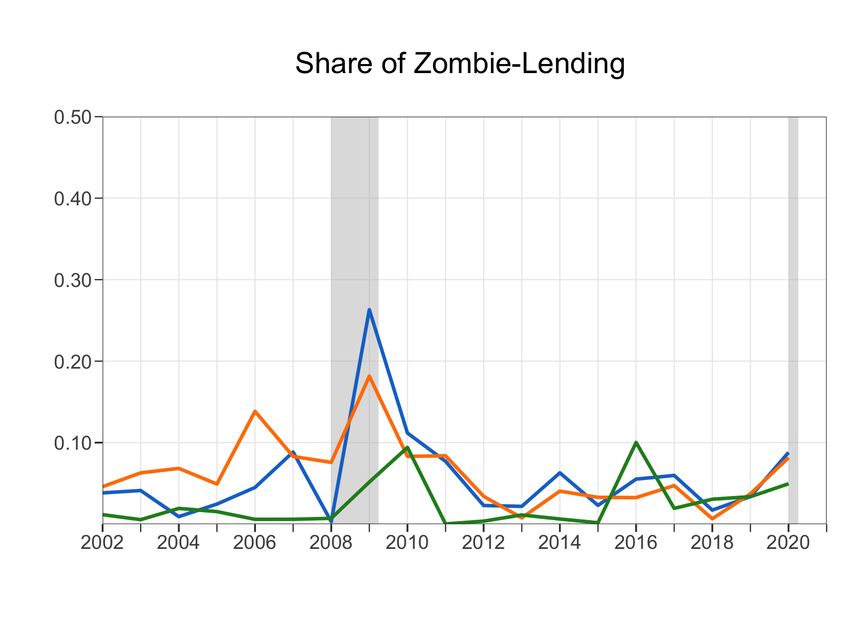
credit from the banking sector interfere with entry and exit dynamics at the two-digit NAICS
industry level.

The remainder of this paper is organized as follows. Section 2 discusses the related literature.
Section 3 describes the data used, while Section 4 discusses the identification of zombie firms.
Section 5 outlines our empirical approach and our chieftain results. Section 6 concludes.

2    Literature Review

The debate about zombie firms can be traced back to Caballero et al. (2008) who first introduced
the concept in their study on Japan’s ”lost decade”. They argue that the prevalence of this type of
firm depressed market prices and increased wages relative to productivity, preventing healthy firms
from flourishing by stifling the creative destruction process. Building upon this work, a recent series
of papers have tracked the zombie phenomenon among OECD countries. For instance, Banerjee
and Hofmann (2020) describe the life cycle of zombies across 14 advanced economies – which also
comprises the United States. In their sample of listed companies, zombies make up about 6%-7%
of total assets, capital and debt and is found to be a particularly widespread phenomenon among
SMEs. Although a large proportion of zombies can eventually recover, they remain weaker and
more fragile than their peers, which have never been classified as non-viable. Despite the aggregate
numbers appearing to be minor, the authors warn against the perception that zombie prevalence
won’t have a saying in the future trajectory of the economy. McGowan et al. (2018) show that the
prevalence of resources sunk in zombie firms have risen since the mid-2000s and that the increasing
survival of these low productivity firms at the margins of exit congests markets and constrains the
growth of more productive firms. Furthermore, they show that a higher share of industry capital
sunk in zombie firms lowers investment and employment growth of non-zombies. Similarly, Acharya
et al. (2020) conclude that zombie-lending results in a misallocation of capital that culminates in
lower product prices, productivity, investment, and value added.

A defining feature of the literature on zombies relates to the problem of identification using firm-
level data. Whereas, in economic terms, zombies can be defined as non-viable firms that would exit
the market in the absence of frictions, the operationalization of the concept is not straightforward.
For instance, Caballero et al. (2008) consider a firm to be a zombie if it has continued access to
financial support from their creditors, despite their poor performance in terms of profitability. To
make this definition operational, the authors compare the interest rate paid by the firm with a
benchmark rate applied to high-quality borrowers. Those firms that present a negative interest
gap receive subsidized credit and are thus classified as zombies. This method, although feasible,
is very demanding in terms of data that is rarely available. A similar approach to zombie-firm
classification can be found in Acharya et al. (2019, 2020). Alternatively, a definition that is often
used as a benchmark definition (McGowan et al., 2018; Banerjee and Hofmann, 2018; Andrews and
Petroulakis, 2019), only requires knowledge of a firm’s age and its interest coverage ratio (ICR).
This zombie metric is less demanding in terms of data availability, though Andrews and Petroulakis
(2019) still remark poor coverage of a firm’s interest expenses in certain data sets. To get around a

                                                  3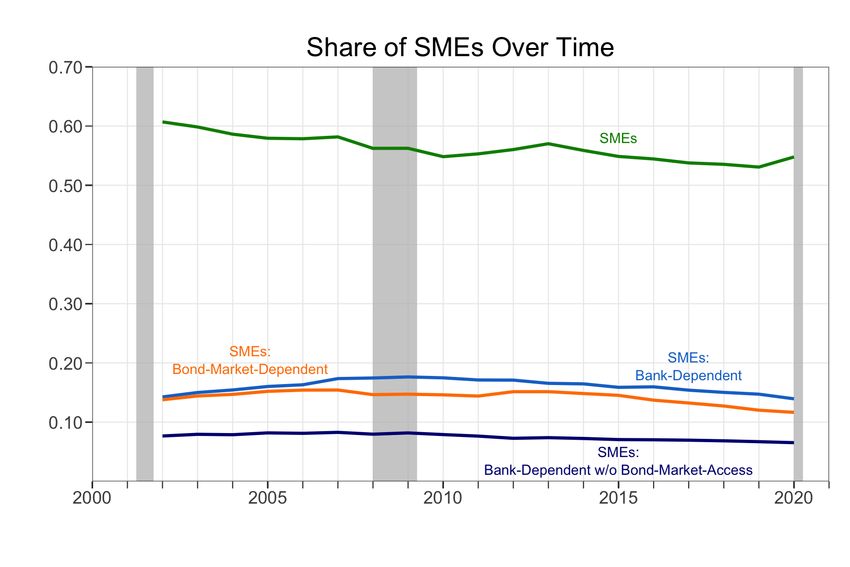
potentially sparsely populated ICR, the literature also classifies a firm as being a zombie, if – over
three consecutive years – the firm reports a low debt-service capacity, and either negative return
on assets (ROA) or negative capital-growth (Storz et al., 2017; Andrews and Petroulakis, 2019). In
Section 4, we discuss the implication of only using a firm’s age and its ICR as the defining features
in the U.S. case and argue in favor of a slight modification.

Another strand of the literature, which our underlying data does not allow us to follow up on,
addresses the motivation to engage in zombie-lending from a lender’s perspective. On the one
hand, institutional bottlenecks such as poor insolvency regimes are found to be important enablers
of zombification (McGowan et al., 2017), constituting a mix which aggravates the macroeconomic
effects of corporate credit booms going bust (Jordà et al., 2020). On the other hand, an increasing
body of literature links the frailties of the financial sector to the rise of zombies. Early work by Peek
and Rosengren (2005) already found that weaker firms were more likely to receive additional credit,
because troubled Japanese banks were incentivized to allocate funds to severely impaired borrowers
in order to avoid the realization of losses on their own balance sheets. Observing lender-borrower
relationships in Italy, Schivardi et al. (2021) find that undercapitalized banks were less likely to
cut credit to zombie firms, whereas for the broader European case, Andrews and Petroulakis
(2019) show that non-viable firms are more likely to be connected to weak banks, suggesting that
zombie prevalence in Europe may at least partly stem from bank forbearance. In spite of growing
regulatory pressure, there is evidence that zombie-lending remains widespread, even in developed
countries (Bonfim et al., 2020).

This stands in contrast to the findings in Favara et al. (2022) – the most closely related study
in terms of examining zombie prevalence in the United States. Their finding of a low degree of
zombification in the U.S. economy extends to zombie lending not being a widespread phenomenon
among private and publicly listed companies. They find banks to tighten their lending standards
or even reduce their exposure to firms, which slide into zombie-like status. Furthermore, they
don’t find any support for undercapitalized banks engaging more forcefully in zombie-lending than
other financial institutions, which contrasts with the findings from the European case (Schivardi
et al., 2021; Andrews and Petroulakis, 2019) . This seminal contribution on banks’ zombie-lending
activities in the United States provides valuable insights into the functioning of the U.S. banking
market, and how it differs from its European counterpart.

    We differ from Favara et al. (2022) by analysing the interplay between zombie-lending and
the performance of non-zombie firms. We find statistically significant negative spill-overs on pro-
ductivity, investment, and employment growth. Nonlinearities are a crucial part of the equation:
while large companies seem to be unaffected, it is SMEs – and subgroups thereof – that are the
ones to carry the entire burden of zombie lending. These results go hand in hand with findings
in Karakaplan (2021) and Chodorow-Reich et al. (2021), in that they corroborate the existence
of large heterogeneity and nonlinearities in the cross-section of U.S. companies and emphasize the
implications for small- and medium-sized enterprises.

Lastly, we add to the literature on business dynamism by examining the link between zombie-
lending and the rate of entrance at the industry-level. Studying zombie firms and specifically

                                                   4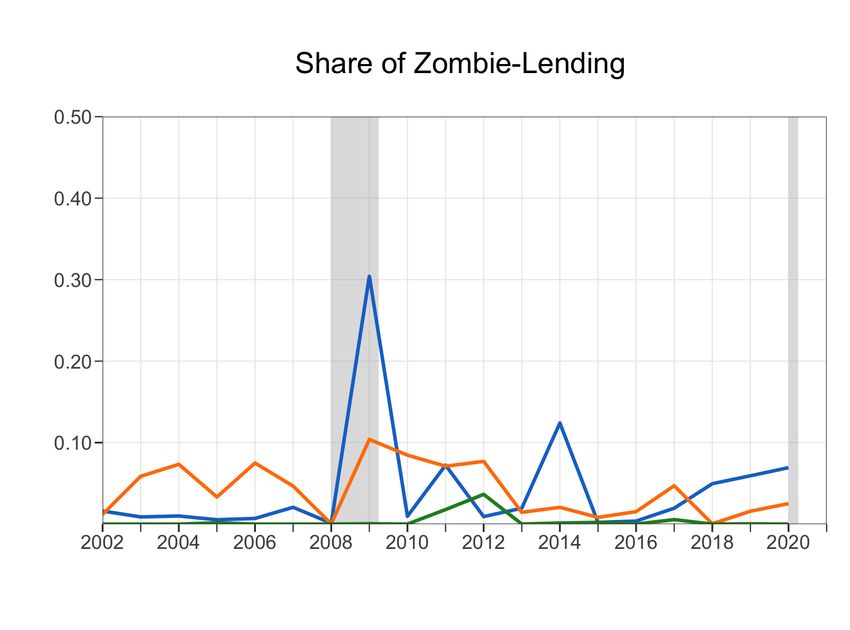
”zombie-credit” in Europe, Acharya et al. (2020) find that increased lending to zombies hampers
the cleansing effect in the economy, i.e. the replacement of non-viable firms by new entrants.
We find similar effects for the U.S., with the main spillovers emerging from bank-related zombie-
lending. We also find support for a working hypothesis – also outlined in Acharya et al. (2020) –
explaining one channel through which zombie-lending compromises market entry.

Before turning to the empirical analysis, the next two sections provide further details on the
characteristics of the data and zombie prevalence among publicly listed companies in the United
States.

3     Data

Our empirical analysis is based on annual firm-level observations of public U.S. companies. For
information on companies’ balance sheets we resort to Compustat’s annual files, while Standard &
Poor’s Capital-IQ (CapIQ) database is our source for companies’ debt instruments. The benefit
of these two databases is the one-to-one mapping between the debt instruments listed in CapIQ
and a company’s fundamentals in Compustat’s annual files. The drawback of CapIQ is its poor
coverage prior to 2002, which shrinks our effective sample size to 19 years between 2002-2020.4
We consider all firms in the Compustat database with an identifier f ic = U SA. Furthermore, we
exclude sectors with NAICS codes 11, 22, 52, 55, 81, and 92. We deflate financial variables by the
industry-specific producer price index derived from KLEMS 5 with base year 2002.6

3.1       Company Financials

Our goal is to evaluate the impact of zombie-lending on non-zombie firms. To measure the relative
performance of non-zombies, we focus in particular on productivity, capital- and employment-
growth. Appendix A.2 describes the computation of Total Factor Productivity (T F P ) and Ap-
pendix A.2 contains a description of the variables used in the empirical part of the paper.

3.2       Debt Contracts

Standard and Poor’s Capital-IQ (CapIQ) database allows us to observe both the extent of bank-
related credit intermediation in the form of Bank-/Term-Loans (BL) and Revolving Credit Facili-
ties (RC), and information on firms’ financing operations via capital markets in the form of Bonds
and Notes (BN ). Table 1 shows the total number of debt contracts differentiated by the type of

   4
     Another source of information about a company’s lending-relationships is DealScan, which reports syndicated
loan arrangements with borrower and lender identification. However, a direct mapping between DealScan and
Compustat is not given without a little detour. Further, syndicated loan agreements usually come with large face-
values. As further analyses will show, zombie-firms are rather small compared to their peers in the Compustat
sample. Thus, based on further examinations, zombies (even when following along our most generous zombie-
definition) are only sparsely represented in the DealScan data set.
   5
     Source: bea.gov
   6
     We do neither winsorize the data nor omit any percentiles in our empirical analysis.

                                                       5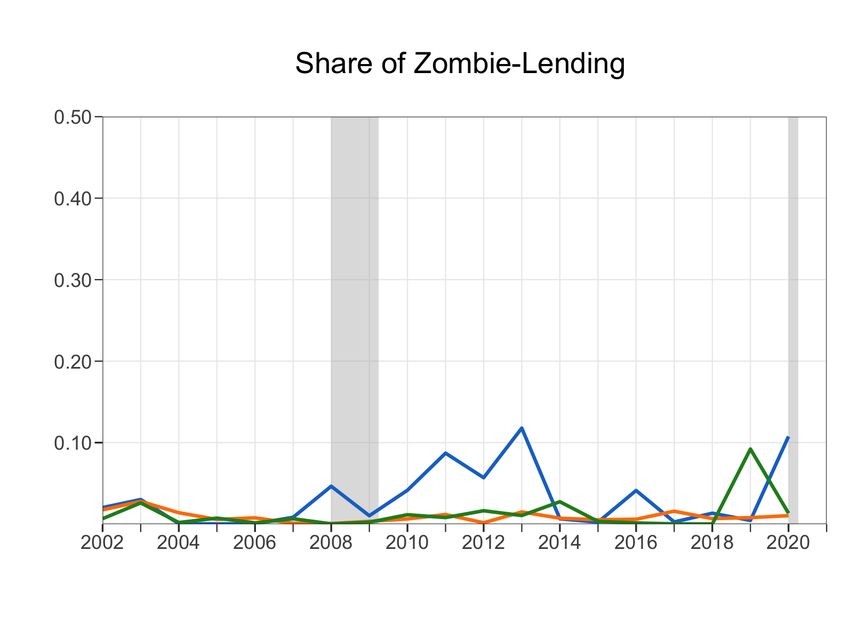
debt and maturity at the time of origination. Overall, BN account for about 60% of all observed
debt contracts, making it a vital component when trying to paint a comprehensive picture of firm-
level debt financing. In contrast to other studies on zombie-lending in Europe (McGowan et al.,
2018; Andrews and Petroulakis, 2019; Schivardi et al., 2021), our data set allows us to not only
differentiate between bank-intermediated debt and other debt securities, but also to distinguish
between short- and long-term funding.

For the empirical part, we pre-process the data along the following steps: first, we compute BCi,t
as the amount of bank-credit being granted to firm i in year t as the sum of Bank-/Term Loans
BLi,t and Revolving Credit RCi,t . From now on, we will thus only distinguish between bank-
credit, BCi,t , and credit taken on via public debt markets in the form of Bonds & Notes BNi,t .
Throughout the empirical analysis of Section 5, the main (explanatory) variable of interest is the
industry-share of new debt being granted to zombies in year t.7 Therefore, we define BCs,t and
BNs,t as the share of newly granted credit to industry s in year t sitting with zombies, as follows:

                                                  Z
                                         P
                                            i∈S Li,t
                            Ls,t = P          Z      NZ
                                                          ,     for L = BC, BN         ,
                                        i∈S Li,t + Li,t

where S spans the set of two-digit NAICS industries, Z is the zombie indicator and N Z the
non-zombie indicator respectively. To reduce the number of reporting errors in the data, we only
include an observation, if its face value does not exceed the borrower’s total debt, as reported in
the Compustat filings.8

Lastly, Table 1 shows that the majority of new debt obligations is issued with a maturity of less
than 10 years. We therefore differentiate between short-term credit as debt obligations with a
maturity of less than one year and long-term credit as those with a maturity of more than one but
less than 10 years at the date of origination.

    7
      In CapIQ, debt obligations are identified via their componentid. Existing debt obligations only get assigned a
new componentid if their contract details have changed. However, the same componentid may occur multiple times
in a company’s financial statements if, for example, a downpayment has been made. Henceforth, we only count the
reporting of BLi,t , RCi,t , or BNi,t in year t, if its componentid has not appeared in any year before t in firm i’s
filings.
    8
      Table 10 in Appendix A.3 documents the corresponding acceptance rates.

                                                          6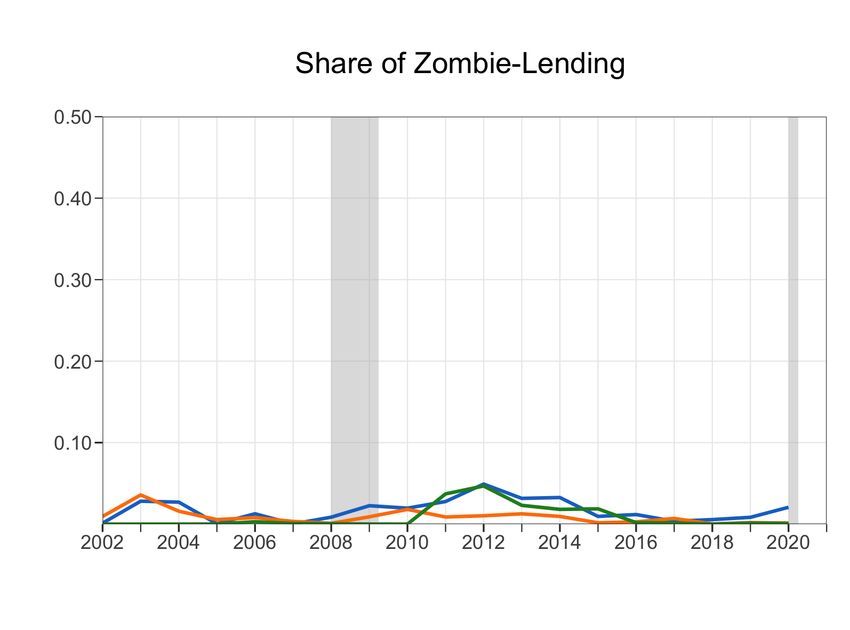
Table 1: Total Number of Debt Obligations and their Maturities – Full Sample: 2002-2020

                                                                                                  Zombie-Definition: Z N AR
                                       Bank/Term Loans                        Revolving Credit Facility                   Bonds and Notes                               Total
                                All     Zombies    Non-Zombies          All        Zombies    Non-Zombies         All      Zombies     Non-Zombies         All     Zombies      Non-Zombies
     1Q ≤ m ≤ 4Q              14,174      517          13,657          17,834        607         17,227          34,302       1,065      33,237          67,198      2,189        65,009
     5Q ≤ m ≤ 8Q              10,831      489          10,342          12,876        511         12,365          28,212        827       27,385          52,230      1,827        50,403
     9Q ≤ m ≤ 20Q             30,425     1,069         29,356          33,630        639         32,991          75,140       1,857      73,283          139,830     3,565        136,265
     21Q ≤ m ≤ 40Q            18,284      465          17,819          17,673        185         17,488          75,449        967       74,482          111,717     1,617        110,100
     41Q ≤ m ≤ 100Q            4,379      181          4,198           3,602          42          3,560          35,178        411       34,767          43,199       634         42,565
     101Q ≤ m ≤ 120Q            368        34           334              81           0            81            12,925        59        12,866          13,374       93          13,281
     121Q ≤ m ≤ 200Q            171        49           122              18           0            18            2,767         215        2,552           2,956       264          2,692

     Total                    78,632     2,804         75,828          85,714       1,984        83,730         260,973       5,401      258,572         430,504    10,289        420,315

                                                                                                 Zombie-Definition: Z BROAD
                                       Bank/Term Loans                        Revolving Credit Facility                   Bonds and Notes                               Total
                                All     Zombies    Non-Zombies          All        Zombies    Non-Zombies         All      Zombies     Non-Zombies         All     Zombies      Non-Zombies
7

     1Q ≤ m ≤ 4Q              14,174     1,583         12,591          17,834       1,349        16,485          34,302       6,449      27,853          67,198      9,381        57,817
     5Q ≤ m ≤ 8Q              10,831     1,365         9,466           12,876       1,022        11,854          28,212       3,834      24,378          52,230      6,221        46,009
     9Q ≤ m ≤ 20Q             30,425     2,457         27,968          33,630       1,443        32,187          75,140       5,979      69,161          139,830     9,879        129,951
     21Q ≤ m ≤ 40Q            18,284      999          17,285          17,673        461         17,212          75,449       2,191      73,258          111,717     3,651        108,066
     41Q ≤ m ≤ 100Q            4,379      264          4,115           3,602          77          3,525          35,178        711       34,467          43,199      1,052        42,147
     101Q ≤ m ≤ 120Q            368        56           312              81           0            81            12,925        87        12,838          13,374       143         13,231
     121Q ≤ m ≤ 200Q            171        52           119              18           0            18            2,767         220        2,547           2,956       272          2,684

     Total                    78,632     6,776         71,856          85,714       4,352        81,362         263,973       19,471     244,502         430,504    30,599        399,905

    Notes: We show the total number of newly reported debt obligations in company filings in Compustat’s Capital-IQ database in the years 2002-2020. The left-most columns shows the different
    maturity bins.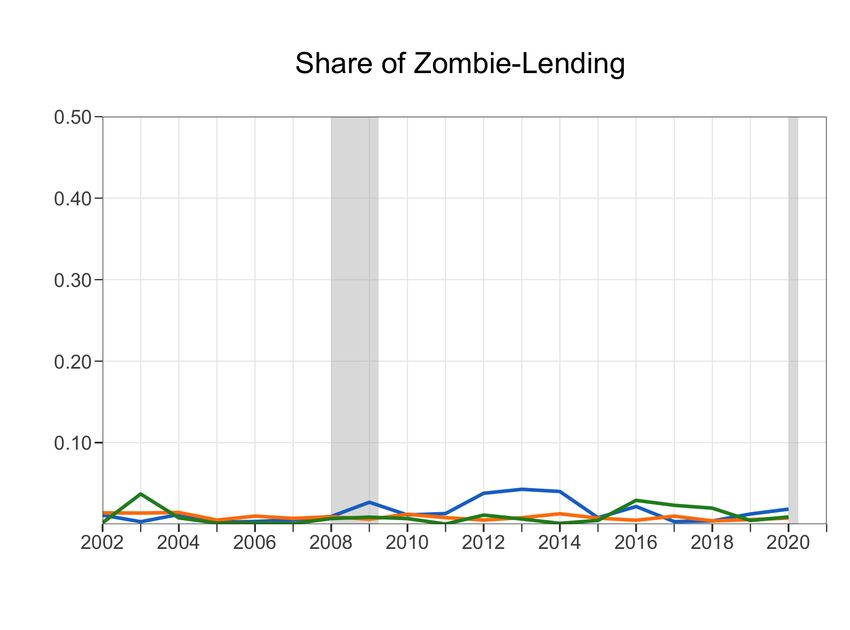
4     “Zombies” – Non-Viable Firms

Even though the issue of zombie prevalence has been discussed in previous studies already, the
literature does not provide a uniform definition of a “zombie-firm”, but deploys various classification
schemes – also depending on data availability.9 In this section, we will discuss two prominent
definitions, which require a small number of financial variables and which are compatible with our
data set.

4.1     The Broader Definition

Our first approach to separate non-viable firms (Zi,t ) from their healthy peers (N Zi,t ), follows Mc-
Gowan et al. (2018); Banerjee and Hofmann (2018); Andrews and Petroulakis (2019) and define a
zombie as a firm that (I) has reported an Interest Coverage Ratio (ICRi,t = XIN Ti,t /EBIT DAi,t )10
larger than one for three consecutive years, and (II) is at least 10 years of age. We refer to firms,
identified as zombies according to this definition, as Z BROAD . Banerjee and Hofmann (2018)
raise the concern that this definition is not stringent enough to single out those companies, which
experience temporary difficulties, but which are generally perceived to have encouraging growth
prospects. In their sample, the median Tobin’s Q – a proxy for expected future profitability as
perceived by stock market participants – of zombies is higher than the non-zombie counterpart.

4.2     A Narrower Definition

Banerjee and Hofmann (2018) therefore extend the previous (broader) zombie-definition (ZtBROAD )
by accounting for a firm’s growth potential. Recall that our prevailing definition of firm i being a
zombie is based on two requirements: (I) a firm’s ICR over the past three years has not fallen below
1 and (II) the firm is at least 10 years of age. Banerjee and Hofmann (2018) augment this definition
by requiring that (III) a firm’s Tobin’s Q in a given year t ranges below the industry-median.11
Let us define the set of companies, meeting all three requirements in a given year t, as Z N AR.X .

Nonetheless, this more conservative definition does not come without costs, and if adopted without
further considerations, introduces non-negligible distortions. The first issue arising from Z N AR.X
is a potential decline in the total number of companies. This stems from the sparsity of reported
Tobin’s Q, which shrinks the set of companies being eligible for classification. This reduced set of
observations also alters the characteristics of zombies and non-zombies. Table 2 compares company
fundamentals for the two zombie-definitions Z BROAD and Z N AR.X . Under the narrow definition,
the median zombie is more productive, larger, less indebted, and more profitable than zombies
under the broader measure.

   9
     For definitions different from the ones used in this paper, see for example Caballero et al. (2008), Acharya et al.
(2019), Andrews and Petroulakis (2019).
  10
     XINT = Interest and Related Expense Total and EBITDA = Earnings Before Interest, Taxes, Depreciation,
and Amortization
  11
     We define an industry via two-digit NAICS codes.

                                                           8
Table 2: Summary Statistics – Full Sample: 2002-2020
Mean Median
Units
BROAD NAR.X BROAD N AR.X BROAD NAR.X BROAD N AR.X
All All Z Z All All Z Z
TFP 0.03 0.04 -0.29 -0.19 0.10 0.10 0.08 0.10
Assets 2.50 2.57 0.21 0.29 0.17 0.17 0.01 0.03 Bill. USD
Sales 2.04 2.12 0.19 0.16 0.14 0.14 0.00 0.01 Bill. USD
(Book) Leverage 2.36 2.52 11.44 0.23 0.22 0.21 0.23 0.13
Asset Tangibility 0.24 0.24 0.18 0.19 0.15 0.14 0.07 0.08
CapX / Assets 0.06 0.06 0.05 0.03 0.02 0.02 0.01 0.01
ROA -6.34 -6.97 -23.36 -0.29 0.00 0.01 -0.40 -0.18
Value Added 643.29 653.76 90.63 27.43 40.34 37.39 -1.32 -0.31 Mill. USD
Age 16.97 18.30 19.39 20.84 12.00 14.00 17.00 18.00 Years
3
Employees (× 10 ) 9.01 8.94 1.57 0.92 0.70 0.66 0.05 0.09
Tobin’s-Q 84.69 84.69 59.54 1.20 1.70 1.70 2.78 1.13
IQR SD
9
Units
BROAD NAR.X BROAD N AR.X BROAD NAR.X BROAD N AR.X
All All Z Z All All Z Z
TFP 0.52 0.52 0.97 0.70 0.93 0.93 1.51 1.25
Assets 1.00 1.03 0.05 0.10 12.67 13.18 1.40 1.38 Bill. USD
Sales 0.86 0.88 0.03 0.06 10.47 10.92 2.52 0.88 Bill. USD
(Book) Leverage 0.42 0.40 0.74 0.37 75.44 79.51 206.81 0.28
Asset Tangibility 0.31 0.31 0.20 0.24 0.25 0.25 0.24 0.25
CapX / Assets 0.04 0.04 0.03 0.02 0.44 0.46 0.55 0.10
ROA 0.29 0.29 0.94 0.32 499.50 527.08 1472.09 0.59
Value Added 283.55 278.52 7.20 9.08 3085.94 3042.25 1995.76 320.73 Mill. USD
Age 19.00 18.00 10.00 12.00 15.46 15.45 8.99 10.71 Years
3
Employees (× 10 ) 4.38 4.30 0.16 0.28 46.75 46.50 26.54 6.49
Tobin’s-Q 1.94 1.94 5.39 0.61 3808.22 3808.22 827.25 253.24
Notes: For each variable we calculate the mean, median, IQR, and SD, along both the time- and cross-sectional dimension. See the Appendix for
the computation of each variable.An explanation for this puzzle can be found in Bargagli Stoffi et al. (2020), who detect a pos-
itive correlation between a firm’s failure and it holding back financial information. Similar to
Bargagli Stoffi et al. (2020), we compute a binary variable for a firm’s exit (Ei,t ), which equals
B
1 in the year prior to its liquidation, and zero otherwise. Another binary variable (Vi,t ), is set
to 1 in year t if Ei,t = 1 and if a certain financial variable of interest (V ) – e.g. Tobin’s Q
or Interest Expenses – was missing at least once in the current or preceding two years. Using
V = {Tobin’s Q, Interest Expenses} we get a correlation of Cor E, V B = 0.55 in the case of
Tobin’s Q and Cor E, V B = 0.48 in the case of Interest Expenses. These numbers suggest that
firms are either more reluctant or less capable of reporting information necessary to calculate their
Tobin’s Q than reporting Interest Expenses in the three years prior to their passing. Thus, con-
ditioning our definition of zombies on the more restrictive definition, which includes Tobin’s Q,
mechanically excludes not only potential zombies but literally non-viable firms from the sample.
Despite its reasonable theoretical underpinnings, the inclusion of Tobin’s Q as an additional cri-
terion for classifying zombies, ultimately falls short of capturing the most distressed firms. We
therefore modify Z N AR.X by classifying a firm as a zombie in year t, if it either complies with
all three requirements of the narrow definition or if it fails to report Tobin’s Q in year t. We call
the set of firms complying with this extended narrower definition Z N AR . Table 3 shows summary
statistics for Z N AR for several company fundamentals over the period 2002 and 2020. Zombies are
on average less productive than their viable counterparts, smaller – both in terms of assets and
employees – and operate with less leverage.
Figure 1 provides an overview of zombie-prevalence since the early 1990s under the two zombie
definitions Z BROAD and Z N AR . The differences are remarkable, peaking at about eight percentage
points at the end of the Great Recession. Though, both definitions share a steady upward trend
starting in the mid 1990s and ending during the financial crisis of 2007 through 2009, and a decline
thereafter.
Figure 1: Zombie Prevalence under Different Zombie-Definitions
Notes: Shaded areas mark NBER recessions.
10Table 3: Summary Statistics – Full Sample: 2002-2020
Mean Median
Units
N AR N AR
All Z Non-Zombies All Z Non-Zombies
TFP 0.03 -0.18 0.04 0.10 0.10 0.10
Assets 2.50 0.40 2.57 0.17 0.03 0.19 Bill. USD
Sales 2.04 0.43 2.10 0.14 0.01 0.15 Bill. USD
(Book) Leverage 2.36 0.70 2.42 0.22 0.13 0.22
Asset Tangibility 0.24 0.20 0.24 0.15 0.08 0.15
CapX / Assets 0.06 0.03 0.06 0.02 0.01 0.03
ROA -6.34 -0.02 -6.57 0.00 -0.18 0.01
Value Added 643.29 250.38 658.13 40.34 -0.26 46.67 Mill. USD
Age 16.97 20.87 16.83 12.00 18.00 12.00 Years
3
Employees (× 10 ) 9.01 3.86 9.20 0.70 0.09 0.78
Tobin’s-Q 84.69 1.20 87.97 1.70 1.13 1.74
IQR SD
Units
N AR N AR
All Z Non-Zombies All Z Non-Zombies
TFP 0.52 0.68 0.52 0.93 1.24 0.92
Assets 1.00 0.10 1.06 12.67 2.12 12.89 Bill. USD
Sales 0.86 0.06 0.91 10.47 4.11 10.62 Bill. USD
(Book) Leverage 0.42 0.40 0.42 75.44 15.84 76.73
Asset Tangibility 0.31 0.24 0.31 0.25 0.26 0.25
CapX / Assets 0.04 0.02 0.05 0.44 0.10 0.44
ROA 0.29 0.32 0.28 499.50 17.81 508.45
Value Added 283.55 9.27 301.74 3085.94 3269.36 3077.34 Mill. USD
Age 19.00 12.00 19.00 15.46 10.64 15.59 Years
3
Employees (× 10 ) 4.38 0.30 4.65 46.75 43.47 46.85
Tobin’s-Q 1.94 0.61 2.03 3808.22 0.48 3882.26
Notes: For each variable we calculate the mean, median, IQR, and SD, along both the time- and cross-sectional
dimension. See the Appendix for the computation of each variable.
114.3 “Zombie”-Lending
Our empirical analysis focuses mainly on the implications of zombie-lending for the performance
of non-zombies. Zombie-lending can occur in the form of increased credit supply and/or reduced
costs of funding (Acharya et al., 2021). While the latter has attracted heightened attention in the
literature12 , our analysis targets the former, i.e. supply of credit to non-viable firms.
As outlined in Section 3.2, CapIQ allows us to differentiate among different types of debt and
different maturities. Sticking with our two zombie-definitions, Table 1 provides an overview of the
overall number of new BL, RC, and BN filings, split into several maturity bins. It is immediately
apparent that the number of observations associated with zombie-lending decreases significantly
when shifting from the broader zombie-definition Z BROAD in the lower panel to Z N AR , shown
in the upper panel. Overall, BN also make up the bulk of zombie-lending with a little over 52%
under Z N AR and almost 64% under Z BROAD of total observations reported by zombies. In terms
of bank-credit, zombies – other than their non-zombie counterparts – rely more heavily on BL than
on RC. Zombies seem to prefer debt with a maturity of two to five years, followed by short-term
contracts of up to one year, which is most often associated with the intention to cover working
capital needs (Amberg and Jacobson, 2021).
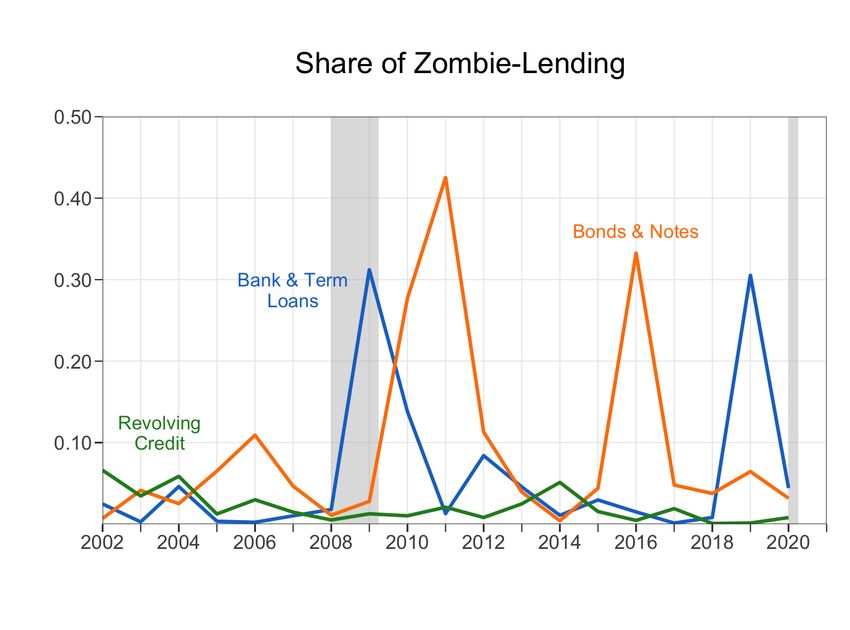
But is a major chunk of total credit sitting with zombie firms? The upper panel in Figure 2 shows
the share of total credit being granted to zombie firms for the three types of debt across different
maturity buckets when applying the Z N AR -definition. The graphs leave little ground for arguing
that overall zombie-lending consumes a major part of the overall lending-pie. An observation that
aligns with Favara et al. (2022).
Nevertheless, previous summary statistics have shown that zombies are rather small in size com-
pared to the other companies in the sample. When it comes to lending, zombies may thus not
necessarily compete with large but rather with small- and medium-sized companies. The lower
panel in Figure 2 shows the amount of zombie-credit relative to the total amount of debt granted
to firms with less than 1,000 employees, which is our definition of small- and medium-sized com-
panies (SMEs) inspired by Chodorow-Reich (2013). Within this size-category, zombie-lending is
much more prevalent with shares rising to levels of up to 40% of newly granted credit.
These simple descriptive results already provide valuable insights for the upcoming empirical anal-
ysis: judging on the grounds of the entire sample of Compustat firms, one may indeed form a
prior on zombie-lending to not have any significant economic impact. For the class of SMEs, how-
ever, this perception may change. In the following section, we will evaluate this supposition more
formally.
12
See Acharya et al. (2021) for a more comprehensive overview of related studies.
12Figure 2: Share of Newly Granted Credit Sunk with Zombies – Zombie-Definition Z N AR
(1) 1Q ≤ m ≤ 4Q (2) 5Q ≤ m ≤ 8Q
(3) 9Q ≤ m ≤ 20Q (4) 21Q ≤ m ≤ 40Q
(a) Full Sample
(1) 1Q ≤ m ≤ 4Q (2) 5Q ≤ m ≤ 8Q
(3) 9Q ≤ m ≤ 20Q (4) 21Q ≤ m ≤ 40Q
(b) Small- & Medium-Sized Companies
Source: Compustat and author’s calculations. The shaded areas mark NBER recessions. We show the fraction of zombie-
lending, i.e. the share of total first-time reported debt-obligations in year t, which were granted to zombie-firms. We show
BL in blue, RC in green, and BN in red.
135 Empirical Evidence on Zombie-Lending in the U.S.
Over the past decade, advanced economies have experienced a period of low productivity growth.
Recent research has linked this phenomenon to factors such as widening productivity dispersion
across firms (Andrews et al., 2016), rising capital misallocation (Gopinath et al., 2017), subdued
growth of non-zombies relative to zombies (Schivardi et al., 2021) and declining business dynamism
(Decker et al., 2017).
Previous sections may have conveyed the impression that zombie prevalence to not be widespread
among publicly listed U.S. companies. This does however not rule out the potential for zombifi-
cation and zombie-lending to affect – adversely or not – the performance of non-zombies. In what
follows, we test this hypothesis by targeting explicitly the root of zombie prevalence, namely the
funding of non-viable firms. In particular, we assess the extent to which the share of fresh credit,
granted to zombie-firms of a given industry s, affects productivity, capital-growth, and employ-
ment of their non-zombie peers. As described in Section 3, we allow for two types of credit: the
first subsumes the sum of bank- and term-loans (BL) and revolving credit facilities (RC) under
the notion of bank credit (BC); the second type captures credit taken up via capital markets in
the form of Bonds & Notes (BN ). We further differentiate between short-term contracts with a
maturity of up to four quarters, and long-term debt, i.e. contracts with a maturity of more than
one year, but not exceeding ten years upon origination. As the upcoming sections will show, this
differentiation helps to uncover the heterogeneity in the sensitivity of non-zombies’ performance to
the maturity structure of zombie-credit.
The remainder of this section is structured as follows: in Section 5.1 we assess the relationship
between zombie-lending and its implications for productivity, and capital- and employment-growth
of non-zombies. In Sections 5.1.1, 5.1.2, and 5.1.3, we assess each performance measure more in-
depth by splicing the group of non-zombies into more granular subgroups. Section 5.2 concludes
our empirical analysis by inspecting the consequences of zombie-lending for business dynamism.
5.1 Zombie-Lending and Non-Zombie Performance
As mentioned previously, we proxy “performance” by productivity, i.e. Total Factor Productivity
(TFP), capital-growth, and employment-growth. We deploy the following models to formally
describe these relationships for both short-term and longer-term zombie-credit:
Z Z
T F Pi,t = X + βBC N Zi,t−1 × BCs,t−1 + βBN N Zi,t−1 × BNs,t−1 + εi,t (1)
Z Z
∆log (Ki,t ) = X + βBC N Zi,t−1 × BCs,t−1 + βBN N Zi,t−1 × BNs,t−1 + εi,t (2)
Z Z
∆EM Pi,t = X + βBC N Zi,t−1 × BCs,t−1 + βBN N Zi,t−1 × BNs,t−1 + εi,t (3)
14As stated above, we use a firm’s TFP (T F Pi,t ) to analyze the relationship between zombie-
lending and non-zombies’ productivity. In Equation (2) we measure the dependent variable
(∆log (Ki,t )) as the first-difference of a firm’s logged stock of (net) property, plant and equipment
(∆log (P P EN Ti,t )). Lastly, we follow Chodorow-Reich (2013) and measure employment-growth
(∆EM Pi,t ) by the symmetric growth formula (see Equation (7) for further details).
All models contain a full set of controls (X), which comprise firm-, sector-, year- and sector-year-
fixed effects (αi and δt ), a non-zombie indicator, N Zi,t−1 ∈ {0; 1}, and a model-specific set of firm
characteristics, which we describe in more detail in each of the corresponding subsections below.
Z
Our main variable of interest is zombie-credit in the form of (i) BCs,t , which is the share of
new bank-intermediated credit to industry s that has been granted to non-viable firms in year
Z
t, and (ii) BNs,t , which is the share of new bonds and notes issued by zombie firms in industry
s in year t. These zombie-credit variables enter with a one period lag, in order to alleviate any
endogeneity biases and to better motivate any causal relationships. Aggregating these lending
variables to industry-shares is motivated by specifications found in the literature, which assess
the effects zombification at the industry-level on the performance of healthy companies (Caballero
et al., 2008; McGowan et al., 2018; Schivardi et al., 2020). Furthermore, recent studies analyse
the rise of specialized lenders, which grant credit to only a selected set of industries (Di and
Pattison, 2021). Though this phenomenon is observed among small businesses, it aligns well with
the specifications in upcoming sections. In order to directly assess the differential effect of zombie-
lending on non-zombies’ performance, the industry-shares of zombie-credit are interacted with an
indicator for non-zombies (N Zi,t−1 ). The results in Table 4 can be summarized fairly quickly: none
of the models could establish a statistically significant relationship between zombie-lending and
the performance of non-zombies – neither for contracts with a maturity of up to four quarters upon
origination, nor for longer-term debt. Overall, the results are grist to the mill of those questioning
whether the observed adverse effects of zombification in Europe (Andrews et al., 2016; McGowan
and Andrews, 2018; Schivardi et al., 2021; Acharya et al., 2019) also hold in the case of the United
States. Nevertheless, it might be worth digging a bit deeper.
Table 3 documents stark differences in firm characteristics between zombies and viable companies
in our sample. One of those is firm size – whether measured in terms of total assets or employees.
As asserted in Section 4.3, the class of viable firms may comprise companies, which do not directly
compete with zombies in the search for appropriate funding. Lumping all non-zombies together,
may therefore overshadow the effects of zombie-lending for a certain type of non-zombie. We will
therefore continue our analysis by further splicing the group of non-zombies according to several
firm characteristics, such as firm size, bank-dependency and access to bond markets.13 Other than
in this subsection, we proceed by dedicating a single subsection to each of our three performance
measures.
13
See Figure 4 for the share of these subgroups in our sample between 2002 and 2020.
15Table 4: Regressions Results: Zombie-Lending & Non-Zombie Performance
Zombie-Definition Z N AR
Maturity (m) 1Q ≤ m ≤ 4Q 1Q ≤ m ≤ 4Q 1Q ≤ m ≤ 4Q
(1) (2) (3)
Variables T F Pi,t ∆log (Ki,t ) ∆EM Pi,t
N Zi,t−1 -0.010 0.196*** 0.780***
Z
N Zi,t−1 × BCs,t−1 -0.100 -0.257 -0.227
Z
N Zi,t−1 × BNs,t−1 0.202 0.091 -0.227
Years 2002 - 2020
Observations 41,098 72,381 66,926
Firms 5,826 9,709 8,928
Fixed Effects X X X
Controls X X X
Within-R2 0.03 0.12 0.05
Maturity (m) 5Q ≤ m ≤ 40Q 5Q ≤ m ≤ 40Q 5Q ≤ m ≤ 40Q
(4) (5) (6)
Variables T F Pi,t ∆log (Ki,t ) ∆EM Pi,t
N Zi,t−1 -0.006 0.192*** 0.081***
Z
N Zi,t−1 × BCs,t−1 -0.476 -0.407 -0.007
Z
N Zi,t−1 × BNs,t−1 -0.039 0.446 -0.204
Years 2002 - 2020
Observations 41,100 72,466 67,006
Firms 5,827 9,713 8,931
Fixed Effects X X X
Controls X X X
Within-R2 0.03 0.12 0.06
Notes: Each estimation includes firm-, industry-, year- and -industry-year-fixed effects.Standard errors are clustered at the firm-
level. Controls are composed as follows: Models (1) and (4) include a lagged measure of size (log ATi,t−1 ) and a firm’s lagged
R&D intensity (XRDi,t−1 /ATi,t−1 ). Models (2) and (5) include a lagged measure of size (log ATi,t−1 ) and a firm’s lagged
asset tangibility (P P EN Ti,t−1 /ATi,t−1 ) Models (3) and (6) include a lagged measure of size (log ATi,t−1 ), a firm’s lagged cash
ratio (CHEi,t−1 /LTi,t−1 ), it’s profitability (ROAi,t−1 = IBi,t−1 /ATi,t−1 ),and the lagged proxy for a firm’s asset tangibility
(P P EN Ti,t−1 /ATi,t−1 ). Robust standard errors in parentheses: *** pTo recap, our main variables of interest are (i) the share of new BC to industry s, which was granted
Z
to non-viable firms in year t, BCs,t−1 , and (ii) the share of new bonds and notes, measured in U.S.
Z
dollars, that was issued by zombie firms in industry s in year t (BNs,t−1 ). These variables are
interacted with several dummy variables. In addition to the indicator for non-zombies (N Zi,t ), we
t
distinguish between two further sets of dummies: (i) the set of time-varying dummies, Di,t−1 =
{1, SMi,t−1 }, where SMi,t symbolizes small- & medium-sized firms (SME) following the definition
in Chodorow-Reich (2013). Therein, “small” firms are defined as EM Pi,t < 250, and medium-
sized firms as 250 ≤ EM Pi,t < 1000.; (ii) the set of firm-specific and time-invariant dummies
(Dii = {1, bank.depi , bond.depi , bondi , no.bondi }, where bank.depi ) indicates whether firm i is bank-
dependent, whereas bond.depi flags those firms which primarily resort to the bond market for
financing. Similarly, bondi , no.bondi respectively, are indicators used to determine whether firm
i has access to the bond market. A firm is classified as bank-dependent, i.e. bank.depi = 1, if it
relied more extensively on bank credit than on bonds and notes over the sample period, i.e.
2020
X 2020
X
if BCi,t > BNi,t ⇒ bank.depi = 1 .
t=2002 t=2002
For bondi = 1, firm i is required to have reported the issuance of bonds – conditional on the
maturity bucket – at least once throughout the sample period. Equation (4) collapses to Equation
(4) in case of both dummies just being an identity-vector, i.e. each element i being set to 1, such
t
that Di,t−1 = Dii = 1 the first and third terms in Equation 4 collapse to N Zi,t−1 × BCs,t−1
Z
and
Z
N Zi,t−1 × BNs,t−1 respectively. Figure 4 in Appendix A.4 plots the share of SMEs and respective
subgroups over the sample period 2002-2020.
The results are summarized in Table 5. Models (1)-(3) capture fresh inflows of short-term credit
to non-viable firms and Models (4)-(6)) document the effects of longer-term funding. The first
row in Table 5 shows that, in general, viable firms are not more productive than their non-viable
counterparts. Nevertheless, the negative spillovers from zombie-lending on T F P of non-zombies
can hardly be overlooked and occur in each of the six specifications.
In Model (1) we ask whether zombie-lending compromises productivity of non-zombie SMEs. The
Z
statistically significant relationship between BNs,t−1 , interacted with the non-zombie and SME
indicators, points to this specific subgroup seeing its productivity to drop by about −0.513 for
every percentage point of an industry’s previous period’s share of new inflows in the form of short-
term BN , that was allocated to zombie firms. To get a sense of the economic impact implied by
Z
these results, consider BNi,t−1 to increase by one standard deviation (SD = 0.047)14 . This would
cause T F P of non-zombie SMEs to decrease by SD × βBN ≡ 0.047 × (−0.513) = −0.024 – relative
to the control group. With the median T F P of non-zombie SMEs being 0.157, this translates into
a drop of -15.3%.
14
Standard-deviation is calculated over the sample period 2002-2020.
17Table 5: Regressions Results: Total Factor Productivity & Zombie-Lending
Zombie-Definition Z N AR
Maturity (m) 1Q ≤ m ≤ 4Q 1Q ≤ m ≤ 4Q 1Q ≤ m ≤ 4Q 5Q ≤ m ≤ 40Q 5Q ≤ m ≤ 40Q 5Q ≤ m ≤ 40Q
(1) (2) (3) (4) (5) (6)
Variables T F Pi,t T F Pi,t T F Pi,t T F Pi,t T F Pi,t T F Pi,t
N Zi,t−1 0.011 0.057 0.032 0.014 0.036 0.045
N Zi,t−1 × SMi,t−1 -0.019 0.000
Z
N Zi,t−1 × SMi,t−1 × BCs,t−1 0.072 -0.987**
Z
N Zi,t−1 × SMi,t−1 × BNs,t−1 -0.513*** -2.406***
N Zi,t−1 × SMi,t−1 × bank.depi -0.051 0.009
N Zi,t−1 × SMi,t−1 × bond.depi 0.000 -0.034
18
Z
N Zi,t−1 × SMi,t−1 × bank.depi × BCs,t−1 -0.418 -0.398
Z
N Zi,t−1 × SMi,t−1 × bond.depi × BNs,t−1 -0.871* -4.647***
N Zi,t−1 × SMi,t−1 × bank.depi × no.bondi -0.020 -0.031
N Zi,t−1 × SMi,t−1 × bond.depi 0.015 -0.039
Z
N Zi,t−1 × SMi,t−1 × bank.depi × no.bondi × BCs,t−1 -0.946** 0.838
Z
N Zi,t−1 × SMi,t−1 × bond.depi × BNs,t−1 -0.920* -4.563***
Years 2002 - 2020
Observations 38,490 23,986 23,986 38,492 32,584 32,584
Firms 5,396 2,727 2,727 5,397 4,081 4,081
Fixed Effects X X X X X X
Controls X X X X X X
Within-R2 0.03 0.04 0.04 0.03 0.03 0.03
Notes: Each estimation includes firm-, industry-, year- and -industry-year-fixed effects. Standard errors are clustered at the firm-level. Controls include a measure of lagged size (log ATi,t−1 ) and a firm’s
lagged R&D intensity (XRDi,t−1 /ATi,t−1 ). Robust standard errors in parentheses: *** pIn Model (2) we further zoom in on bank-dependent (bank.depi ) and bond-market dependent
(bond.depi ) non-zombie SMEs. Here, the negative spillovers from public debt markets’ short-term
zombie-lending activities increase by almost 70% to −0.881. In contrast, from a statistical point
of view, banks’ engagement in zombie-credit activities does not signal any significant spillovers –
even when zooming in on bank-dependent, non-zombie SMEs. This picture changes in Model (3):
we restrict the set of bank-dependent, non-zombie SMEs even further by looking at the subgroup
that has no access to bond markets. The median T F P in that subgroup of highly bank-dependent
viable firms is 0.128. Such a firm would see its productivity decrease by -40.6%15 – relative to the
control group – for a standard deviation (SD = 0.055) increase in an industry’s share of new credit
inflows that is intermediated by banks and channeled to zombie firms.
Drawing comparisons on the βBN coefficients across Models (1) and (3) hints at the existence of
another mechanism: the increasing magnitude of the point estimates suggests financial constraints
amplifying the effect of the bond market’s zombie-lending activities. Models (4)-(6) reproduce the
specifications of Models (1)-(3), but inspect the effects of longer-term contracts. The spillovers
and amplification mechanism arising from the investment in bonds and notes issued by zombies
are qualitatively similar to those observed in Models (1)-(3). Drawing a comparison in terms
of economic impact, we conduct the same thought experiment as before, by looking at a one
standard-deviation increase in newly granted industry-credit to zombies in the form of bonds and
notes (SD = 0.026) The coefficient on βBN = −4.563 in Model (6) is attached to bond-market
dependent non-zombies. The median T F P of this subgroup is 0.145. Hence, a capital-market
dependent non-zombie SME with median productivity would subsequently experience a decrease
in T F P of about -82%16 for a one-standard deviation increase in BNs,t
Z
. Compared to Model
(3), which looked at short-term zombie-lending, in which T F P would decrease by roughly -30%17 ,
the economic magnitude of the impact of longer-term zombie-credit is significantly more severe.
For banks’ engagement in zombie-lending, such an amplification channel is not present. Still,
non-zombie SMEs are again not spared from negative spillovers.
In a nutshell, Tables 4 and 5 establish the following results: there exist statistically significant
negative spillovers of zombie-lending on T F P , which however predominantly affect small- and
medium-sized companies. Moreover, financial constraints amplify the economic impact of increased
zombie-lending in the market of short-term bank-funding. Lastly, the negative spillovers emerge
primarily from the bond market, but do also arise via the banking-channel. The effects can both
be found in short-term and longer-term debt contracts, with the economic impact.
15 −0.946 × 0.055
See: × 100 = −40.6.
0.128
16 −4.563 × 0.026
See: × 100 = −81.1.
0.145
17 −0.920 × 0.047
See: × 100 = −29.8.
0.145
195.1.2 Capital Growth
We now turn to the interaction between capital-growth and zombie-lending. Our model is designed
along the lines of McGowan et al. (2018), and collapses to Equation (2) when setting each element
t
i in Di,t−1 and Dii equal to one:
t
∆log (Ki,t ) = βBC N Zi,t−1 × Di,t−1 × Dii × BCs,t−1
Z
+ βX Xi,t−1
(5)
t
+ βBN N Zi,t−1 × Di,t−1 × Dii × BNs,t−1
Z
+ αi + δt + εi,t
where αi and δt again comprise a full set of firm-, sector-, year- and sector-year-fixed effects.
The dependent variable is capital-growth, measured as the first-difference of a firm’s logged stock
of (net) property, plant and equipment (∆log (P P EN Ti,t )). The set of covariates accounts for
t
lagged firm size and lagged asset tangibility. The time-varying (Di,t−1 ) and time-invariant (Dii )
dummies follow the description of Equation (4). As in the previous exercise on productivity,
our main coefficients of interest are βBC and βBN . We again lag the share of zombie-lending in
industry s by one period, in order to disentangle the strain of causality between reduced investment
opportunities for non-zombies and an increase in the share of zombie-lending.
The negative effects in Table 6 are not as dominant as those documented in Table 5. Although non-
zombies invest more than non-viable firms, there is no statistical ground for rejecting the hypothesis
that short-term zombie-lending does not impair capital-growth of non-zombies. This might be
explained by the fact that short-term debt is generally perceived to cover working-capital needs,
whereas expenses for investment purposes are associated with longer-term maturities (Amberg
and Jacobson, 2021). Models (4)-(6) are again only scarcely covered with statistically significant
relationships. Unlike for T F P , the negative spillovers build up exclusively in public debt markets
and only affect non-zombie SMEs, which are capital-market dependent. The coefficient βBN in
Models (5) and (6) quantifies investment of this specific subgroup of viable firms to decrease by
about -1.85%, for a one standard deviation increase in zombies’ industry-share of newly issued
longer-term bonds and notes.18
Though the negative consequences of zombie-lending are less pronounced when measuring non-
zombies’ performance in terms of capital-growth, a common denominator seems to build up: viable
SMEs, which are reliant on funding provided by the bond market, are indeed sensitive to public
debt markets’ lending engagements to zombie firms.
18
For Model (5): SD × βBN ≡ 0.026 × (−0.718) × 100 = −1.87% and for Model (6) respectively: SD × βBN ≡
0.026 × (−0.713) × 100 = −1.85%.
20Table 6: Regressions Results: Capital Growth & Zombie-Lending
Zombie-Definition Z N AR
Maturity (m) 1Q ≤ m ≤ 4Q 1Q ≤ m ≤ 4Q 1Q ≤ m ≤ 4Q 5Q ≤ m ≤ 40Q 5Q ≤ m ≤ 40Q 5Q ≤ m ≤ 40Q
(1) (2) (3) (4) (5) (6)
Variables ∆log (Ki,t ) ∆log (Ki,t ) ∆log (Ki,t ) ∆log (Ki,t ) ∆log (Ki,t ) ∆log (Ki,t )
N Zi,t−1 0.204*** 0.175*** 0.166*** 0.205*** 0.187*** 0.175***
N Zi,t−1 × SMi,t−1 -0.014 -0.016
Z
N Zi,t−1 × SMi,t−1 × BCs,t−1 -0.027 -0.225
Z
N Zi,t−1 × SMi,t−1 × BNs,t−1 -0.180 0.256
N Zi,t−1 × SMi,t−1 × bank.depi -0.034 -0.033*
N Zi,t−1 × SMi,t−1 × bond.depi -0.024 0.003
Z
N Zi,t−1 × SMi,t−1 × bank.depi × BCs,t−1 0.221 0.117
Z
N Zi,t−1 × SMi,t−1 × bond.depi × BNs,t−1 -0.222 -0.718***
N Zi,t−1 × SMi,t−1 × bank.depi × no.bondi -0.036 -0.032
21
N Zi,t−1 × SMi,t−1 × bond.depi -0.019 0.009
Z
N Zi,t−1 × SMi,t−1 × bank.depi × no.bondi × BCs,t−1 0.189 0.435
Z
N Zi,t−1 × SMi,t−1 × bond.depi × BNs,t−1 -0.231 -0.713**
Years 2002 - 2020
Observations 66,133 42,062 42,062 66,216 56,644 56,644
Firms 8,792 4,474 4,474 8,796 6,647 6,647
Fixed Effects X X X X X X
Controls X X X X X X
Within-R2 0.11 0.12 0.12 0.12 0.12 0.12
Notes: Each estimation includes firm-, industry-, year- and -industry-year-fixed effects. Standard errors are clustered at the firm-level. Controls include a lagged measure of size (log ATi,t−1 ) and a firm’s
lagged asset tangibility (P P EN Ti,t−1 /ATi,t−1 ). Robust standard errors in parentheses: *** pYou can also read