2 Business Performance - Hysan Development
←
→
Page content transcription
If your browser does not render page correctly, please read the page content below
2
    Business
    Performance
    32   The Marketplace

    36   Management’s Discussion
         and Analysis
         36 Strategy and Review of Results
         37 Review of Operations
         42 Financial Review
         45 Treasury Policy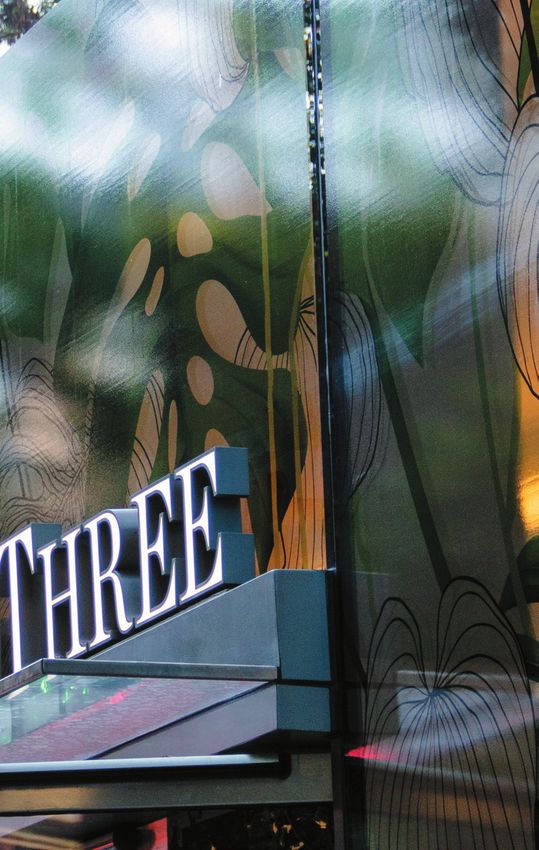
Overview   Business Performance   Corporate Governance   Financial Statements and Valuation

                                                                                              31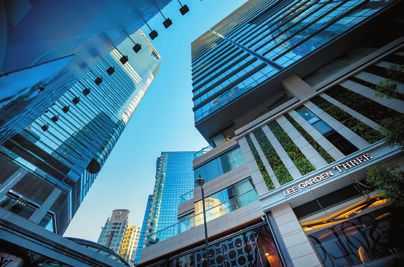
The Marketplace
     Hong Kong Economy
     The Hong Kong economy grew 3.0% in 2018. With 4.1% growth recorded in the first half of
     the year, growth slowed to 2.8% and 1.3% in the third and fourth quarter of the year
     respectively. This was mainly due to the deteriorating global environment stimulated by the
     China-US trade war during the latter half of the year, which also impacted other key
     economic statistics. Imports and exports of goods both showed a marginal drop during the
     fourth quarter following positive growth in previous quarters, with a full year increase of
     4.9% and 3.5% respectively. Exports of services grew by 4.9%, which was mainly due to the
     increase in visitor arrivals. Investment expenditure grew moderately by 2.2%, slowed by
     dampened sentiment during the last quarter of the year. Private consumption expenditure
     increased by 5.6%, which was supported by a favourable employment market.

     Real Gross Domestic Product Growth*
     Year-on-year % change
     5

     4                                                     3.8%

                                                                          3.0%
     3        2.8%
                             2.4%

     2
                                            2.2%

     1

     0
              2014           2015           2016           2017           2018

         * In chained (2016) dollars
         Source: Census and Statistics Department (data as of February 2019)

     Retail
     Following the rebound in the Hong Kong retail market in 2017, consumer sentiment
     continued to be positive. This benefitted the retail sales market in the first half of 2018, with
     growth of 13.4% being recorded in Hong Kong retail sales versus the same period in 2017.
     However, due to various adverse factors such as the China-US trade war, RMB depreciation
     as well as the interest rate hike, growth in Hong Kong retail sales during the second half of
     2018 slowed to 4.3% when compared to the same period in 2017. The overall growth in
     Hong Kong retail sales was 8.8%.

     During the year, the number of visitor arrivals grew by 11.4%. Since the new infrastructure
     linking Hong Kong to Mainland China became operational, the number of visitors from the
     Mainland soared by 14.8%. These visitors were one of the core factors in the overall retail
     sales growth. Local consumers also contributed to the retail market upturn, as is shown by
     the increase in private consumption expenditure.

     The growth in Hong Kong retail sales extended to most trade categories. However, some
     categories recorded better year-on-year growth than others; for example, jewellery, watches
     and clocks and valuable gifts (up 13.7%), commodities in department stores (up 9.6%), and
     medicines and cosmetics (up 14.3%).

32   Hysan Annual Report 2018
Hong Kong Total Retail Sales                                                              Total Number of Visitors

                                                                                                                                                                           Overview
HK$ billion                                                       Year-on-year % change   Million
600                                                                                 32    70
                                                                                                                                                                    65
                                                                                                    61                                         59
              493                                                                         60                                                          57     58     22%
500                            475                                       485        24              22%
                                           437             446                                                                                 22%    24%    24%
                                                                                          50
400                                                                                 16                                                                              78%
                                                                                                    78%                                        78%           76%
                                                                        8.8%              40                                                          76%
300                                                                                  8
                                                          2.2%                            30
              -0.2%
200                                                                                  0
                              -3.7%                                                       20
                                           -8.1%
100                                                                                  -8   10

  0                                                                                 -16    0
              2014             2015        2016           2017          2018                        2014                                       2015   2016   2017   2018

                                                                                                                                                                           Business Performance
                      Total Retail Sales           Year-on-year % change                                        Number of Other Visitors
                                                                                                                 Number of Mainland China Visitors
      Source: Census and Statistics Department (data as of January 2019)
                                                                                               Source: Hong Kong Tourism Board (data as of January 2019)

According to Jones Lang LaSalle, rents for retail premises in premium shopping centres
increased by 2.0% overall.

Premium Prime Shopping Centre Rental Index (2009 Q4=100)

Index
170

                                                                                                                                                                           Corporate Governance
160

150

140

130

120

110

100

 90
        Q1 Q2 Q3 Q4 Q1 Q2 Q3 Q4 Q1 Q2 Q3 Q4 Q1 Q2 Q3 Q4 Q1 Q2 Q3 Q4
              2014             2015        2016            2017            2018

      Source: Jones Lang LaSalle (data as of January 2019)
                                                                                                                                                                           Financial Statements and Valuation
                                                                                                           © Photographed by Geoff Letchford

                                                                                                                                                                           33
The Marketplace

     Office
     Grade “A” office rents in general continued to increase during 2018, being primarily driven
     by the demand from Mainland Chinese firms as well as the growing number of co-working
     operators. Spot rents in Central and Causeway Bay in 2018 showed a solid increase of 8.0%
     and 8.6% respectively over 2017. During 2018, Mainland China companies took up about
     29% of new lettings in Central. Analysed by locations, both the traditional and new
     commercial areas saw a decrease or on par in vacancy rates at the end of 2018 when
     compared to 2017. The exception was Wong Chuk Hang, which showed an increase mainly
     due to new supplies. Strong demand for office space in Central was maintained. With
     limited supply and ongoing rental increases, the decentralisation trend continued as banks
     and professional firms as well as multinational corporations moved to other areas like
     Causeway Bay, Hong Kong East and Kowloon East. Co-working operators expanded into
     Grade “A” offices to provide premium services, a trend that resulted in the occupancy of a
     considerable amount of office space.

     Grade “A” Office Vacancy Rate in 2017 and 2018
     %
     25

                                                                                               20.3%
     20

     15
                                                                        12.5%          12.2%

     10                                                                         9.6%

      5                                                   3.9%
                             3.0%
              1.7% 1.8%             1.7%      2.2% 1.5%          1.7%
      0
                Central   Causeway Bay/ Tsim Sha          Hong Kong Kowloon East Wong Chuk
                            Wanchai       Tsui              East                   Hang

                   2017 year-end                 2018 year-end

              Source: Jones Lang LaSalle (data as of January 2019)

     Grade “A” Office Monthly Net Effective Rental Value
     HK$ per sq. ft., Net Floor Area
     140

     120

     100

      80

      60

      40

      20

          0
               Q1 Q2 Q3 Q4 Q1 Q2 Q3 Q4 Q1 Q2 Q3 Q4 Q1 Q2 Q3 Q4 Q1 Q2 Q3 Q4
                   2014                2015           2016              2017             2018

                   Central                 Causeway Bay/Wanchai

              Source: Jones Lang LaSalle (data as of January 2019)

34   Hysan Annual Report 2018
Luxury Residential

                                                                                                              Overview
Luxury residential rents began to pick up in 2017 and the trend continued in 2018. However,
the traditional luxury market is facing headwinds due to unfavourable economic outlook
and tight housing budgets in multinational corporations.

According to Jones Lang LaSalle, luxury residential rents increased 2.9% as compared to
2017.

Luxury Residential Rental Index (2009 Q4=100)
Index

120

115

                                                                                                              Business Performance
110

105

100

 95

 90

 85

 80
        Q1 Q2 Q3 Q4 Q1 Q2 Q3 Q4 Q1 Q2 Q3 Q4 Q1 Q2 Q3 Q4 Q1 Q2 Q3 Q4
           2014          2015           2016           2017   2018

      Source: Jones Lang LaSalle (data as of January 2019)

                                                                                                              Corporate Governance
                                                                                                              Financial Statements and Valuation
                                                                          © Photographed by Geoff Letchford

                                                                                                              35
Management’s Discussion
and Analysis
Strategy
The Group is committed to providing our shareholders with sustainable returns from our
property portfolio, which is predominantly located in Hong Kong’s prime commercial area of
Causeway Bay. This district will remain the core of our investment and operational focus.
The Group also continues to seek investment opportunities beyond our core geographical
area.
We continuously strive to enhance the value of our properties through asset enhancement,
repositioning and redevelopment. We also focus on curating the contents of the Lee
Gardens community for our tenants and other stakeholders. We are proud of our team of
passionate, responsible and forward-looking professionals who strategically plan and
manage our portfolio while ensuring everything we do is underpinned by sound financial
management.
Review of Results
2018 2017 Change
HK$ million HK$ million %
Turnover 3,890 3,548 +9.6
Recurring Underlying Profit 2,536 2,349 +8.0
Underlying Profit 2,536 2,491 +1.8
Reported Profit 6,033 3,636 +65.9
The Group’s turnover in 2018 was HK$3,890 million, an increase of 9.6% from HK$3,548
million in 2017, mainly attributable to the meaningful contribution from Lee Garden Three
and the strong performance of the office sector.
Recurring Underlying Profit, the key measurement of our core leasing business performance,
was up 8.0% to HK$2,536 million (2017: HK$2,349 million). Our Underlying Profit in 2018,
was also HK$2,536 million, up by 8.0% from 2017 on a normalised basis after excluding the
one-off compensation received from a retail tenant in 2017. Basic earnings per share based
on Recurring Underlying Profit and Underlying Profit correspondingly rose to HK242.40
cents (2017: HK224.68 cents and HK238.26 cents respectively), up 7.9% and 1.7%
respectively.
The Group’s Reported Profit for 2018 was HK$6,033 million (2017: HK$3,636 million). A fair
value gain of HK$3,532 million (2017: HK$853 million) on the Group’s investment
properties’ valuation was the key contributor. As at year-end 2018, the external valuation of
the Group’s investment property portfolio increased by 6.9% to HK$77,442 million (2017:
HK$72,470 million). This reflected a combination of factors: a generally positive rental
outlook for our core portfolio, and a number of asset enhancement works completed. The
capitalisation rates used in valuing each portfolio remained unchanged from those used as
at 31 December 2017.
36 Hysan Annual Report 2018Overview
Review of Operations
Hysan’s portfolio of retail, office and residential investment properties has a total gross floor
area of approximately 4.5 million square feet. As at 31 December 2018, about 85% of the
Group’s investment properties by gross floor area were retail and office properties in
Causeway Bay. The remaining 15% was represented by residential properties mainly in the
Mid-Levels.
The turnover of each sector is shown as below:
Contribution to Turnover
Business Performance
2018 2017 Change 2018 2017
HK$ million HK$ million % % %
Retail sector 1,923 1,925 – 49.4 54.3
Office sector 1,688 1,359 +24.2 43.4 38.3
Residential sector 279 264 +5.7 7.2 7.4
3,890 3,548 +9.6 100.0 100.0
The increased weight from the Office sector towards turnover was mainly due to the new
Lee Garden Three, which provided predominantly office space, together with higher positive
rental reversion achieved by other office buildings in our portfolio.
Corporate Governance
Key Performance Indicators
The Group’s turnover growth and occupancy rate are the key measurements used for
assessment of our core leasing business performance. Cost effectiveness is assessed by the
Group’s management using the property expenses ratio (as a percentage of turnover).
Business Performance
Key Performance Indicators Definition Portfolio 2018 2017
Turnover Growth Rental revenue in current year Retail – -2.2%
vs that in last year Office +24.2% +5.2%
Residential +5.7% -3.6%
Occupancy Rate Percentage of total lettable Retail* 98% 97%
area leased / total lettable area Office* 97% 96%
Financial Statements and Valuation
of each portfolio at year end Residential 88% 75%
Property Expenses Ratio Property expenses divided by N/A 13.4% 12.7%
turnover
* 2017 percentages did not include Lee Garden Three, the redevelopment of which was completed in December 2017.
Note: Except for the occupancy rate mentioned above, no changes have been made to the source data or calculation methods
used when compared to 2017.
Retail Portfolio
The Group’s retail portfolio turnover was on par with last year at HK$1,923 million (2017:
HK$1,925 million). There was good contribution from turnover rent of HK$81 million (2017:
HK$48 million). The overall rental reversion in renewals, rent review and new lettings was
largely neutral reflecting satisfactory positive reversions mixed with the impact from
targeted tenant repositioning. The portfolio’s occupancy, including the new Lee Garden
Three’s retail portion, was 98%, as at 31 December 2018 (31 December 2017: 97%,
excluding Lee Garden Three).
37Management’s Discussion and Analysis
Foot traffic in Hysan’s retail portfolio saw an increase of around 11% in 2018, as compared
to full year 2017. There was also a general improvement in the estimated overall tenant
sales within the portfolio. Estimated tenant sales increased by around 16.2% as compared
to 2017, outperforming Hong Kong’s year-on-year retail sales growth of 8.8%.
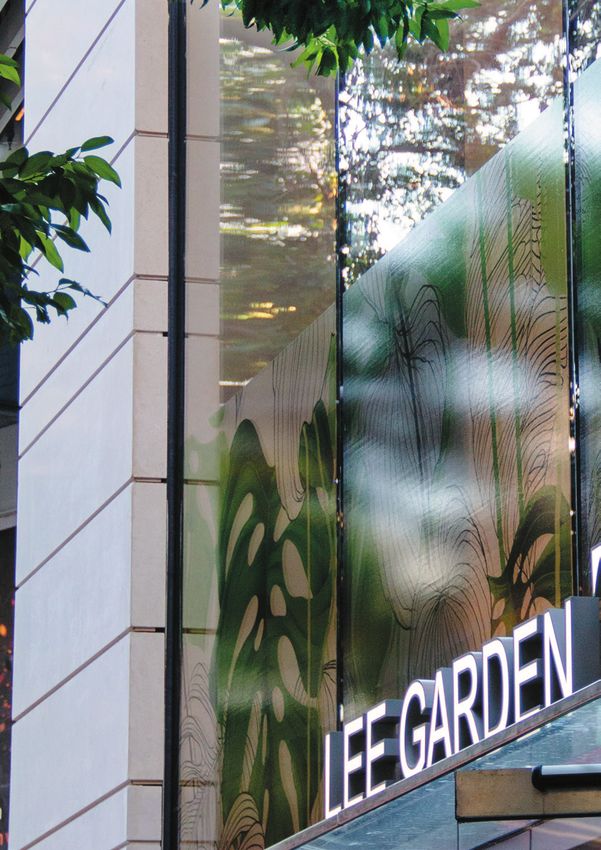
Lee Garden Three held its official opening in November 2018. The event was attended by
hundreds of well-wishers as well as members of the media, and was Hysan’s stand-out event
of the year. Lee Garden Three is well known for its lifestyle shops such as HOMELESS, Tavolo
Kids Living, BoConcept, KitchenAid and Stressless, plus hair stylist M Plus. The building’s food
and beverage outlets have also become some of the most popular dining destinations in
town, with Belgos, John Anthony, Starbucks flagship store, Next Door Café and Bar, NOC
Coffee, Reserva Ibérica Tapas Bar & Café, Sweet Fashion House and Zentro East offering a
wide variety of food and drinks. A Happy Pancake, renowned for its long lines of customers,
rounds off the list.
The new building’s opening was a good opportunity for us to further energise the rest of the
portfolio. 2018 saw a significant improvement in our “content” provision. Initiatives included
an enhanced tenant mix, strong tenant and third-party partnerships, unique experiences
and events, key branding programmes, improved and expanded loyalty programmes, and
the start of a digital transformation.
New tenants included the family members’ club Maggie & Rose, a strong addition to our
children-focused Lee Garden Two. The Spa by Valmont and Sake Diamond added new
lifestyle experiences to the portfolio, while Hysan Place welcomed a number of new or
expanded sportswear tenants. In addition to our new food venues in Lee Garden Three, we
also welcomed destination restaurants like 10 Shanghai and Ta-ke in Lee Garden Two, the
popular experiential Haidilao in Lee Theatre Plaza, and a number of more casual eateries in
Hysan Place.
We believe in maintaining strong relationships with our tenants after they move in. In 2018,
almost a dozen partnership events were held with tenants and third parties, thereby
bringing more attention to the area, generating business for tenants, and providing unique
experiences to high-end shoppers. Brunello Cucinelli, BVLGARI, CHANEL BEAUTÉ, Dior,
Lancôme, Louis Vuitton, Roger Vivier, rue Madame, The Spa by Valmont and TORY BURCH
were among the tenants that hosted exclusive and glamorous events in partnership with
Hysan.
We also generated considerable excitement for our general shoppers in the malls. Chinese
New Year, Valentine’s Day, Mother’s Day and a Go Green restaurant campaign saw us
hosting popular activities backed by strong promotions. The second half of the year also
saw further campaigns for Mid-Autumn Festival with Maxim’s, and Christmas and New Year
with eslite bookstore. These campaigns combined great shopping or dining opportunities
with special experiences.
We are building Lee Gardens’ reputation as a venue for quality children’s entertainment to
attract more family traffic. Absolutely Fabulous Children’s Theatre’s monthly performances,
the Hong Kong International Young Readers’ Festival, and the reading of Gruffalo by
Kidsfest were among the highlights of the year. There was also a Royal Kids Etiquette series
of classes for younger children. More activities for children are planned for 2019.
38 Hysan Annual Report 2018During 2018, we also took our events outdoors. In the first half of the year, the popular
Overview
Cathay Pacific/HSBC Rugby Sevens Festival at Lee Gardens and its partner Lee Gardens
Egglette Festival attracted the most attention. The remaining months began with Hong
Kong Ballet’s Alice (in Wonderland) street performances, as well as the November Standard
Chartered Art Fun in Causeway Bay Night Parade. LOVE is NEARBY Christmas Community
Festival, where top band Supper Moment and other singers performed at a popular street
fair outside Lee Garden One, rounded off the year.
Running alongside more than a hundred of these events and activities were signature key
branding programmes, supported by shopper promotion campaigns. Leeisure, Shopaholic,
DeLeecious, and Athleeisure were all launched to attract more footfall and spending for
different retail segments. In addition, strong efforts were made in both media and social
Business Performance
media to drive awareness of Lee Gardens among Mainland Chinese and other tourists. A
new and comprehensive tourist booklet was launched, while a VIP membership card for
tourists, the Purple Card, was unveiled during the year. Moreover, we reinforced our
partnerships with Hong Kong Tourism Board and leading local hotels to further promote our
messages.
In regard to our loyalty programmes, Club Avenue for VIPs and Lee Gardens Plus for general
shoppers, saw a substantial growth in their membership in 2018, as compared to 2017.
Sales attributable to Club Avenue members experienced double-digit percentage growth.
We are encouraged by the growth of these and will further invest in the hardware and
software of our programmes to benefit all members.
Corporate Governance
On the technology front, the area-wide high-speed Wi-Fi system was successfully launched.
The paperless e-coupon system was also unveiled and was well supported from the outset
by a majority of shop tenants. We made substantial inroads into the enhancement of data
collection from all touchpoints, with enhanced data privacy protection. In addition, an
integrated customer relationship management system is about to be launched. More than
100 digital signs are now under a central control point, while more interactive e-directories
have been added. The use of big data, analytics, prediction and artificial intelligence will be
key to the future of the retail sector. Hysan is committed to making the best use of available
technology to gain better insight and to add value to all our retail tenants.
Retail Lease Expiry Profile by Area Occupied
Financial Statements and Valuation
(As at 31 December 2018)
32%
28%
21%
17%
2019 2020 2021 2022 and beyond
39Management’s Discussion and Analysis
Growing a community and curating its content require committed buy-in from those who do
business in the neighbourhood. Lee Gardens Association has taken on the role of enlivening
the area through street events, activities and social media promotions. Many of the area’s
main events, like the Rugby Sevens Festival, Egglette Festival and Night Parade were
spearheaded by the Association. New Association members include several traditional
businesses that have operated in the area for decades, and which have taken part in a
number of the Association’s social media drives. We are heartened that many of the
neighbourhood’s property owners have expressed interest in the creative business concepts
introduced by the Association. Hysan looks forward to more cooperation with the
Association to further enhance the area as a popular destination for all.
Office Portfolio
The Group’s office portfolio turnover increased by 24.2% to HK$1,688 million (2017:
HK$1,359 million). This performance reflected contributions from the newly completed Lee
Garden Three, as well as overall robust positive rental reversion on renewals, rent review and
new lettings. The office portfolio occupancy was 97%, as at 31 December 2018, including
occupancy of the new Lee Garden Three (31 December 2017: 96%, excluding Lee Garden
Three).
Tenants demand the highest standards of both building hardware and building service
software. Lee Garden Three offers many green and wellness features, including a Hong
Kong-first commercial building running track, together with a popular retail podium of
restaurants and lifestyle shops. All these amenities are further supplemented by the area’s
eclectic mix of commercial and social offerings plus ample convenient parking facilities. Lee
Gardens has become an established and viable choice for multinational and local firms.
We have maintained a diverse tenant mix over the years. With the completion of Lee
Garden Three, which has attracted a number of Banking and Finance tenants, this sector
has increased to about 24% and has now overtaken Professional and Consulting as the
largest sector area-wise in our office portfolio. Banking and Finance, together with the next
three top sectors, including Professional and Consulting, Insurance and Semi-Retail, take up
around 59% of our office lettable floor area (2017: 54%).
Office Tenant Profile by Area Occupied as at Year-end
Banking and Finance
14.3% Professional and Consulting
15.1% 17.8%
24.1% Insurance
6.4% 3.5% Semi-retail
2.1% 1.7% 2017 15.7% Information Technology
4.7% 2018 8.0%
(Excluding
Marketing
Lee Garden
5.9% 16.5% Three) High-end Retailers
7.2%
6.9% 14.2% Consumer Products
7.4% 10.9% 8.0%
9.6% Co-Work
Others
40 Hysan Annual Report 2018Office Lease Expiry Profile by Area Occupied
Overview
(As at 31 December 2018)
26% 26%
22% 23%
2019 2020 2021 2022 and beyond
Residential Portfolio
Hysan’s residential portfolio, comprising mainly the units in Kennedy Road’s Bamboo Grove,
Business Performance
recorded a 5.7% growth in turnover to HK$279 million (2017: HK$264 million). The
residential sector’s occupancy improved to 88% (31 December 2017: 75%). The units
previously under renovation are now available and have proven to be popular. We continue
to make improvements to Bamboo Grove to attract prospective tenants. A small urban farm,
for example, is being planned for Bamboo Grove to enhance the community spirit.
The rental reversion was overall positive in renewals, rent review and new lettings.
Tai Po Luxury Residential Project
The design development of our low-density residential development project at Tai Po is
Corporate Governance
making good progress. Various statutory submissions are ongoing. Site work has also
commenced.
Financial Statements and Valuation
“My great, great grandfather worked as a chef for an
American trading company where he learned how to
cook western cuisine. Eventually, he branched out to
open his own restaurants and moved across the
border to Hong Kong. The design and interiors, much
like certain items on the menu, have not changed
since the restaurant first opened. If we change
anything, it will no longer be ‘Tai Ping Koon’ for our
customers. Some of them, including plenty of
celebrities, have been coming here for generations.”
Andrew Chui
Managing Director of
Tai Ping Koon
41Management’s Discussion and Analysis
Financial Review
A review of the Group’s results and operations is featured in the preceding sections. This
section deals with other significant financial matters.
Operating Costs
The Group’s operating costs are generally classified as property expenses (direct costs and
front-line staff wages and benefits) and administrative expenses (indirect costs largely
representing payroll related costs of management and head office staff).
Property expenses increased by 16.5% to HK$523 million (2017: HK$449 million), reflecting
the commencement of operation of Lee Garden Three during the year. The property
expenses to turnover ratio thus increased slightly from 12.7% to 13.4% as compared to
2017. Administrative expenses decreased by 8.1% to HK$227 million (2017: HK$247
million).
Finance Costs
Finance costs amounted to HK$222 million in 2018, an increase of 40.5% from HK$158
million in 2017, mainly due to (i) cessation of interest expense capitalisation of HK$51
million upon Lee Garden Three’s completion in 2017; and (ii) interest rate increases in 2018,
which impacted interest cost of our floating rate debts. If the capitalised interest expenses
and related borrowing costs were expensed last year, the Group’s finance costs in 2017
would have been HK$209 million. The finance costs of 2018 would then have increased by
HK$13 million or 6.2%. The Group’s average cost of finance in 2018 was 3.6%, a slight
increase from 3.4% reported for 2017.
Further discussion of the Group’s treasury policy, including debt and interest rate
management, is set out in the “Treasury Policy” section.
Revaluation of Investment Properties
As at 31 December 2018, the Group’s investment real estate portfolio was valued at
HK$77,442 million, an increase of 6.9% from HK$72,470 million as at 31 December 2017.
This valuation was carried out by Knight Frank, an independent professional valuer, on the
basis of open market value. The capitalisation rates used in valuing each portfolio remained
unchanged from those used as at 31 December 2017.
42 Hysan Annual Report 2018Fair value gain on investment properties (excluding capital expenditure spent on the
Overview
Group’s investment properties) of HK$3,532 million (2017: HK$853 million) was recognised
in the Group’s consolidated statement of profit or loss for the year. This figure reflected a
combination of factors: a generally positive rental outlook across our portfolio and the
completion of a number of asset enhancement works.
The following shows the property valuation of each portfolio at year-end.
2018 2017 Change
HK$ million HK$ million %
Retail 35,102 33,188 +5.8
Office 34,159 31,325 +9.0
Residential 8,181 7,957 +2.8
Business Performance
77,442 72,470 +6.9
Investment in Associates and a Joint Venture
The Group’s investment in associates mainly represents interests in Shanghai Grand
Gateway in Shanghai, China. The share of results of associates increased to HK$288 million
(2017: HK$220 million). As at 31 December 2018, properties at Shanghai Grand Gateway
had been revalued at fair value by an independent professional valuer. The Group’s share of
the revaluation gain, net of the corresponding deferred tax thereon, amounted to HK$96
million (2017: HK$11 million).
The Group’s investment in a joint venture represents interests in a Tai Po residential project.
Corporate Governance
The increase in carrying value represents costs incurred by the project.
Other Investments
In addition to placing surplus funds as time deposits in banks with strong credit ratings, the
Group also invested in investment grade debt securities.
Excluding recognition of imputed interest income on interest-free loan to a joint venture
company for a residential site development in Tai Po of HK$29 million (2017: HK$28
million), like-for-like interest income increased by 19.5% to HK$49 million (2017: HK$41
million). This figure mainly reflected higher interest rates from deposits. Financial Statements and Valuation
During 2018, the Group invested in a real estate fund covering certain properties in Hong
Kong and other major cities in Asia, with a view to expanding our reach in collaboration with
professional property managers and to generate a new source of income and capital.
43Management’s Discussion and Analysis
Cash Flow
Cash flow of the Group during the year is summarised below. Cash include liquid cash and
bank deposits with less than 3 months’ tenor.
2018 2017 Change
HK$ million HK$ million %
Cash generated from operations 3,224 2,900 +11.2
Net (advance to) repayment from
a joint venture company (56) 935 n/m
Net borrowing (repayment) 46 (130) n/m
Interest and taxation (636) (587) +8.3
Dividends paid and proceeds on
exercise of options (1,551) (1,524) +1.8
Capital expenditure (1,203) (1,947) -38.2
Other investments 211 1,020 -79.3
Net cash inflow 35 667 -94.8
n/m: not meaningful
The Group’s net cash generated from operations was HK$3,224 million (2017: HK$2,900
million), HK$324 million higher than in 2017, reflecting the growth of our core leasing
business.
Net advance to a joint venture company of HK$56 million was for a residential site
development in Tai Po. In 2017, net repayment from a joint venture company was HK$935
million after the completion of project financing on land acquisition costs.
Net borrowing was HK$46 million, reflecting net borrowing of fixed rate notes of HK$150
million, and repayment to non-controlling interest of a subsidiary during the year. In 2017,
net repayment was HK$151 million during the year.
Cash from other investments was HK$211 million (2017: HK$1,020 million), mainly
attributable to reduction in deposits with longer tenor.
The Group paid dividends of HK$1,444 million (2017: HK$1,411 million), being the 2017
second interim dividend of HK111 cents per share (2017: HK109 cents) and the 2018 first
interim dividend of HK27 cents per share (2017: HK26 cents).
Capital Expenditure and Management
The Group is committed to enhancing the asset value of our investment property portfolio
through selective asset enhancement and redevelopment. The Group has also established a
portfolio-wide whole-life cycle maintenance programme as part of our ongoing strategy to
pro-actively implement preventive maintenance activities. Total cash outlay of capital
expenditure during the year was HK$1,203 million (2017: HK$1,947 million), including the
payment of the construction costs of Lee Garden Three.
44 Hysan Annual Report 2018Treasury Policy
Overview
Market Highlights
The global economy performed strongly at the beginning of 2018. However, as sentiment
soured amid growing China-U.S. trade tensions, the Hong Kong stock market tumbled more
than 20% from its peak in January and global financial markets became more volatile. In
view of the 10-year lowest unemployment rate and relatively low inflation rate, the U.S.
Federal Reserve raised the federal fund rate by four hikes, amounting to a total of 100 basis
points in 2018. With the expectation of market volatility and slowing global economic
growth, the Federal Reserve lowered its forecast for interest rate hikes in 2019. Under the
currency board system, Hong Kong Monetary Authority also raised its base rate in line with
the federal funds rate by 100 basis points during 2018. The Hong Kong dollar (HKD) HIBOR
Business Performance
rate also rose sharply during 2018, narrowing the differential with the U.S. dollar LIBOR rate.
The 3-month HKD HIBOR increased from around 1.3% at the end of 2017 to around 2.3%
at the end of 2018. Despite the increase in HIBOR, the Hong Kong bank loans market
continued to be liquid. The credit margin of bank loans for companies with investment
grade credit ratings saw a modest decline.
Despite the slow-down in the global economy and uncertainties in the macro environment,
the Hong Kong economy is fundamentally in good shape and the unemployment rate at
2.8% is the lowest since 1998. The completion of two mega infrastructure projects, namely
the Hong Kong-Zhuhai-Macau Bridge and the Express Rail Link, is set to further increase the
number of inbound tourist arrivals from Mainland China. A rise in domestic household
Corporate Governance
spending may further benefit Hong Kong’s economy. However, the Hong Kong economy
also saw some signs of slowing down when GDP growth in Q3 and Q4 retreated to 2.8%
and 1.3% respectively, when compared to 4.1% in the first half of the year.
Uncertainties in global political issues and financial markets may worsen our operating
environment as well as dampen expansion. It is therefore important for the Group to
continue with our prudent financial management policy.
Capital Structure Management
To ensure a healthy financial position and a suitable capital structure servicing the Group’s
finance needs and sustainable growth, the Group always strives to diversify its funding
Financial Statements and Valuation
sources, maintain a suitable debt maturity profile relative to the overall use of funds,
maintain adequate liquidity, keep a low borrowing margin relative to market conditions, and
adopt suitable hedging and forex management strategies.
45Management’s Discussion and Analysis
Funding Source
During the year, the Group issued and repaid medium-term notes of HK$300 million and
HK$150 million respectively. The Group’s outstanding gross debt1 was HK$6,326 million
(2017: HK$6,176 million) at year-end 2018. All the outstanding borrowings are on an
unsecured basis.
At the end of 2018, the proportion of debts sourced from the capital market increased
slightly to 75.5% (2017: 74.9%). The Group continued to maintain long-term relationships
with a number of local and overseas banks to diversify its funding sources. At year-end of
2018, eight local and overseas banks provided bilateral banking facilities to the Group as
funding alternatives.
The following graph shows the percentages of total outstanding gross debts sourced from
banks and the debt capital markets over the past five years.
Sources of Financing at Year-end (HK$ milion)
6,457 6,305 6,326
6,176
17.0%
4,875 26.6% 25.1% 24.5%
5.1%
83.0% 94.9% 73.4% 74.9% 75.5%
2014 2015 2016 2017 2018
Capital Market Issuances Bilateral Bank Loans
The Group also strives to maintain an appropriate debt maturity profile to match with the
nature of our assets and operations. As at 31 December 2018, the average maturity of the
debt portfolio was about 3.9 years (2017: 4.3 years), of which about HK$300 million or
4.7% of the outstanding gross debt will be due in 2019. Given our strong cash balance, debt
repayment will not cast much immediate refinancing pressure.
To further diversify our source of funding into investors who highly regard businesses with
green initiatives, the Group has established its Green Finance Framework in late 2018,
leveraging our sustainable building development and operations with green initiatives. The
framework supports both green bonds and green loans enabling a choice of flexibility in the
Group’s future financing. After the reporting period, the Group has raised its first green
bond of HK$300 million at a coupon rate of 3.33% due in 2026.
1 The gross debt represented the contractual principal payment obligations as at 31 December 2018. However, in
accordance with the Group’s accounting policies, the debt was measured at amortised costs, using the effective
interest method. As disclosed in the consolidated statement of financial position as at 31 December 2018, the book
value of the outstanding debt of the Group was HK$6,322 million (31 December 2017: HK$6,185 million).
46 Hysan Annual Report 2018Maturity Profile
Overview
The graph below shows the debt maturity profile of the Group at year-end 2018 and 2017.
Debt Maturity Profile at 2018 and 2017 Year-end
2018 300 565 250 1,331 3,230 650 6,326
2017 150 800 565 250 1,331 3,080 6,176
Business Performance
0 1,000 2,000 3,000 4,000 5,000 6,000 7,000
Gross Debt Amount (HK$ million)
Maturing:
Not exceeding 1 year Between 3 – 4 years
Between 1 – 2 years Between 4 – 5 years
Between 2 – 3 years More than 5 years
Gearing Ratio and Net Interest Coverage
The Group’s gearing ratio, as measured by Net Debt to Equity ratio1, decreased slightly from
5.0% at year-end of 2017 to 4.7% at year-end of 2018, because of the increase in equity
from HK$70 billion at year-end of 2017 to HK$74 billion at year-end of 2018 driven by the
Corporate Governance
increase in fair value of investment properties. The Group’s Net Interest Coverage2
increased to 18.1 times for 2018 (2017: 17.1 times) due to the improved operating results.
The low gearing and strong ability to meet interest payments reflected the Group’s
resilience and capability to raise further debt for new investments and projects, if necessary.
The graph below shows the level of leverage and our ability to meet interest payment
obligations over the past five years.
Net Debt to Equity and Net Interest Coverage at Year-end
20.5x
19.5x
Financial Statements and Valuation
17.1x 17.1x 18.1x
5.4% 5.0% 4.7%
4.2%
3.0%
2014 2015 2016 2017 2018
Net Debt to Equity (%) Net Interest Coverage (times)
1 Net Debt to Equity is defined as borrowings less time deposits, cash and cash equivalents divided by shareholders’ funds.
2 Net Interest Coverage is defined as gross profit less administrative expense before depreciation divided by net interest
expenses.
47Management’s Discussion and Analysis
Credit Rating
The Group aims at maintaining investment-grade credit ratings to ensure a stable and lower
cost of financing, and reflect our prudent financial management strategy. During the year,
Fitch upgraded the Group’s credit rating from BBB+ to A-, reflecting the Group’s strong
financial position.
2018 2017
Moody’s A3 A3
Standard and Poor’s BBB+ BBB+
Fitch A- BBB+
Liquidity Management
As at 31 December 2018, the Group had cash and bank deposits totalling about HK$2,817
million (2017: HK$2,662 million). In order to preserve liquidity and enhance interest yields,
the Group invested HK$227 million (2017: HK$737 million) in debt securities.
Further liquidity, if needed, is available from the undrawn committed facilities offered by
the Group’s relationship banks. These facilities, amounted to HK$950 million at year-end
2018 (2017: HK$950 million), essentially allowing the Group to obtain additional liquidity as
the need arises.
Interest Rate Management
The fixed rate debt ratio increased slightly to 75.5% at year-end 2018 from 74.9% at
year-end 2017. 2018 saw the start of interest rate normalisation cycle and it is expected
that interest rate will continue to rise in 2019, although in a slower pace when compared to
2018. We believe we are in a good position to manage our finance costs given our fixed rate
debt ratio.
The diagram below analyses the Group’s debt level in term of gross and net debt, fixed and
floating rates, together with average cost of finance over the past five years.
Debt Levels (HK$ million) and Average Cost of Finance (%)
3.8%
3.5% 3.6%
3.4%
3.2%
6,457 6,305 6,176 6,326
23.7% 26.6% 25.1% 24.5%
4,875
5.1%
3,675 3,514 3,510
2,817
76.3% 94.9% 2,071 73.4% 74.9% 75.5%
2014 2015 2016 2017 2018
Fixed rate debt
Year-end Gross Debt
Year-end Net Debt (Gross debt less time deposits, cash and cash equivalents)
Average Cost of Finance (Total finance costs before capitalisation divided by average gross debt)
48 Hysan Annual Report 2018Foreign Exchange Management
Overview
The Group aims to achieve minimal currency exposure and does not speculate in currency
movements for asset and liability management. Except for US$300 million fixed rate notes,
which have been hedged by an appropriate hedging instrument, all of the Group’s
borrowings were denominated in Hong Kong dollar. For the US$300 million fixed rate notes
issued in January 2013, a hedge was entered effectively to convert the borrowing into Hong
Kong dollar.
On the investment side, as at 31 December 2018, the Group’s outstanding foreign currency
balances in cash, time deposits, debt securities and a real estate fund amounted to US$88
million (2017: US$131 million), of which US$28 million (2017: US$70 million) was hedged
by foreign exchange forward contracts.
Business Performance
Other foreign exchange exposure mainly relates to investments in the Shanghai project.
These unhedged foreign exchange exposures amounted to the equivalent of HK$3,715
million (2017: HK$3,779 million) or 4.3% (2017: 4.6%) of total assets.
Use of Derivatives
As at 31 December 2018, outstanding derivatives were mainly related to the hedging of
foreign exchange exposures. Strict internal guidelines have been established to ensure
derivatives are used to manage volatilities or to adjust the appropriate risk profile of the
Group’s treasury assets and liabilities.
Corporate Governance
Counterparty Credit Risk
All the deposits are placed with banks with strong credit ratings and the counterparty risk is
controlled via prescribed limits and is monitored on a regular basis.
Before entering into any hedging transaction, the Group will ensure that its counterparty
possesses strong investment-grade ratings to control credit risk. As part of our risk
management, a limit on maximum risk-adjusted credit exposure is assigned to each
counterparty, which basically reflects the credit quality of the counterparty.
Financial Statements and Valuation
“We opened our shop first on Lan Fong Road in 1986,
and then we moved to Lee Garden One in 2005, so
we’ve had this shop for 32 years. We have seen
Causeway Bay change over these years, and we have
built up so many memories here. Our customers are
used to us being here, so we’ve never left. We designed
the shop ourselves, and we’ve kept it simple and
minimalistic instead of following trends. We do
everything from our heart. It’s important to us that
when our customers wear our clothes, they feel happy.”
Rosanna Ma & Ben Leung
Zeta store owners
49You can also read