2019 Preliminary Integrated Resource Plan - Page 1 - Tucson Electric Power
←
→
Page content transcription
If your browser does not render page correctly, please read the page content below
2019 Preliminary Integrated Resource Plan

                                 Page ‐ 1
Tucson Electric Power

Page ‐ 2
2019 Preliminary Integrated Resource Plan
Forward
This Preliminary Integrated Resource Plan outlines Tucson Electric Power’s development of an energy portfolio that
supports our reliable, affordable and increasingly sustainable service. I am proud to report that we are on track to
achieve the renewable energy goals outlined in our previous IRP well ahead of schedule. So, as we develop our 2020
Integrated Resource Plan, we are working to set new, more ambitious goals, with expanded input from the
community we serve.
In 2015, TEP set a goal to generate 30% of its power from renewable resources by 2030 – two times the state‐
mandated level of 15% by 2025. Thanks to several significant new projects, we will be approaching that goal nine
years ahead of schedule. In 2021, production from our renewable energy resources will exceed 28% of TEP’s retail
sales, thanks in large part to three new projects that will come online in 2020:
The 247‐megawatt (MW) Oso Grande Wind Project in southeastern New Mexico, developed by EDF
Renewables North America and owned by TEP.
The 99‐MW Borderlands Wind Project in western New Mexico, which will supply TEP energy through a
power purchase agreement (PPA) with Borderlands Wind LLC, a subsidiary of NextEra Energy.
The Wilmot Energy Center in southeast Tucson, including a 100‐MW solar array and a 30‐MW battery
storage system, will supply TEP energy and storage capacity through a PPA with NextEra Energy.
While TEP will continue expanding our renewable energy resources, we are no longer satisfied to gauge our progress
toward greater sustainability by counting kilowatts. Our commitment to serve the best interests of our current and
future customers and stakeholders compels us to develop a revised goal focused on reducing carbon dioxide
emissions. This new, more comprehensive goal, will be based on greenhouse gas reductions that reflect our
proportional contribution toward limiting global temperatures to levels outlined in the 2015 Paris Agreement on
climate change. To that end, we have enlisted the University of Arizona’s Institute for the Environment to help us
develop science‐based targets that allow us to measure our steps toward a global solution.
Achieving these goals will require support and cooperation from our community. That is why we are expanding our
stakeholder outreach through the creation of a new IRP Advisory Council. This group includes representatives of key
stakeholder groups, including residential and business customers, local governments, public schools, low‐income
advocates, solar installers and environmental advocates. The council will meet monthly for workshops and in‐depth
discussions of key resource planning considerations. Combined with the feedback we receive through public
workshops, the council’s contributions will help TEP develop a long‐term plan that satisfies our emission‐reduction
objectives while maintaining affordability and the balance and flexibility needed in our electric system.
Our IRP will address issues covered in several Arizona Corporation Commission dockets, including compliance with
Arizona’s renewable energy and energy efficiency standards and policies for emerging energy technologies. Going
forward, we believe it would be most efficient and effective to incorporate consideration of these issues in a single,
more comprehensive IRP docket so that utilities can review all potential resources in the proper context of their
specific system. Additionally, this will allow utilities the flexibility to achieve greenhouse gas emission reductions and
other objectives through the resource mix that best satisfies their unique, long‐term energy needs.
Thank you for your interest in TEP’s resource planning process. We look forward to working with our customers, our
community and the Commission toward an updated plan that allows us to continue to provide our customers with
reliable, affordable and sustainable energy service.
David G. Hutchens
President and CEO
Page ‐ 3
Tucson Electric Power

Acknowledgements
Tucson Electric Power Company IRP Team

Lee Alter, Lead Resource Planner
Kevin Battaglia, Lead Resource Planner
Luc Thiltges, Lead Resource Planner
Ilse Morales Duarte, Student Intern
Celeste Williams, Student Intern
Greg Strang, Lead Forecasting Analyst
Debbie Lindeman, Supervisor, Planning Analysis and Reporting
Gary Trent, Manager, Transmission Planning
Chris Lindsey, Director, Transmission and Distribution Planning
Ed Beck, Director, Transmission Development
Joe Barrios, Supervisor, Media Relations and Regulatory Communication
Joe Salkowski, Director, Corporate Communications and Community Relations
Chris Norman, Director, Regulatory Services
Jeff Yockey, Director, Resource Planning
Mike Sheehan, Senior Director, Fuels and Resource Planning

IRP Consultants and Forecasting Services

Pace Global
http://www.paceglobal.com/
Biwan Zhou, Project Manager – Consulting Services
Olivia Valentine ‐ Consulting Services
Angela Roth ‐ Consulting Services
Anant Kumar, Project Director ‐ Consulting Services
Gary W. Vicinus, Executive Vice President, ‐ Consulting Services

Wood Mackenzie ‐ Consulting Services

http://public.woodmac.com/public/home

Page ‐ 4
2019 Preliminary Integrated Resource Plan

Table of Contents
 FORWARD ...............................................................................................................................................................................3

 ACKNOWLEDGEMENTS .......................................................................................................................................................4

 ACRONYMS ..............................................................................................................................................................................7

 CHAPTER 1
 OVERVIEW...............................................................................................................................................................................9
 Introduction ...................................................................................................................................................................................................... 9
 Modernization of Arizona’s Energy Rules ........................................................................................................................................... 9
 Planning Objectives .....................................................................................................................................................................................11
 Stakeholder Involvement ..........................................................................................................................................................................11

 CHAPTER 2
 ACTION PLAN UPDATE ..................................................................................................................................................... 15
 Resource Diversification Update ...........................................................................................................................................................15
   Navajo Generating Station ......................................................................................................................................................................... 15
   San Juan Generating Station ..................................................................................................................................................................... 15
   Gila River Power Station ............................................................................................................................................................................. 15
   Reciprocating Internal Combustion Engine (RICE) Project ........................................................................................................ 15
   Renewable Resources.................................................................................................................................................................................... 16
   Solar Resource Projects ............................................................................................................................................................................... 16
   Wind Resource Projects ............................................................................................................................................................................... 16
   Energy Storage Projects .............................................................................................................................................................................. 17
 Resources Adequacy Study ......................................................................................................................................................................17
 Natural Gas Storage .....................................................................................................................................................................................17

 CHAPTER 3
 LOAD FORECAST ................................................................................................................................................................ 19
 Introduction ....................................................................................................................................................................................................19
 COMPANY OVERVIEW ....................................................................................................................................................... 20
 Geographical Location and Customer Base .......................................................................................................................................20
 Customer Growth..........................................................................................................................................................................................21
 Retail Sales by Rate Class ..........................................................................................................................................................................22
 REFERENCE CASE PLAN FORECAST .............................................................................................................................. 23
 Methodology ...................................................................................................................................................................................................23
 Reference Case Plan Retail Energy Forecast ....................................................................................................................................24
 Reference Case Plan Retail Energy Forecast by Rate Class ........................................................................................................25
 Reference Case Plan Peak Demand Forecast ....................................................................................................................................25
 Data Sources Used in the Forecasting Process ................................................................................................................................27
 Risks to Reference Case Plan Forecast and Risk Modeling ........................................................................................................27
 Firm Wholesale Energy Forecast ...........................................................................................................................................................28
 Summary of Load Forecast .......................................................................................................................................................................29

                                                                                                                                                                                                      Page ‐ 5
Tucson Electric Power
CHAPTER 4
PRELIMINARY LOADS AND RESOURCES ..................................................................................................................... 31
TEP’s Updated Renewable Resource Portfolio ................................................................................................................................31
Renewable Resource Contribution to Meeting Peak Demands ................................................................................................32
Energy Efficiency and Demand Response..........................................................................................................................................33
TEP Loads and Resources .........................................................................................................................................................................33
CHAPTER 5
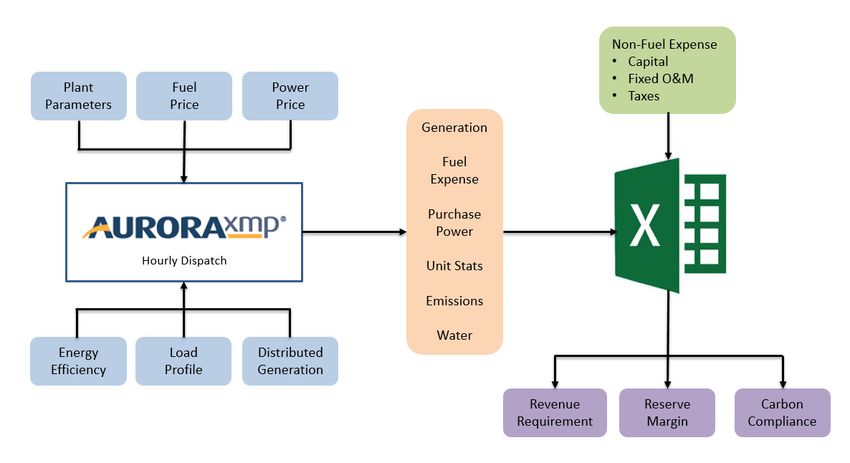
RESOURCE MODELING ASSUMPTIONS ........................................................................................................................ 37
Production Cost Modeling.........................................................................................................................................................................37
Science‐Based Greenhouse Gas Emission Reduction Target.....................................................................................................38
Energy Efficiency Assumptions ..............................................................................................................................................................40
Renewable Integration ...............................................................................................................................................................................40
Coal Assumptions .........................................................................................................................................................................................42
Energy Storage ...............................................................................................................................................................................................43
Energy Imbalance Market .........................................................................................................................................................................44
CHAPTER 6
MARKET AND FUEL ASSUMPTIONS .............................................................................................................................. 45
Natural Gas Price Forecast .......................................................................................................................................................................46
Palo Verde (7x24) Market Prices...........................................................................................................................................................47
CHAPTER 7
RESOURCE OPTIONS AND ECONOMIC ASSUMPTIONS ............................................................................................ 49
Comparison of Resources..........................................................................................................................................................................51
Transmission and Distribution Assumptions ..................................................................................................................................54
Transmission Overview ................................................................................................................................................................................ 54
Ten‐Year Transmission Plan ..................................................................................................................................................................... 54
Regional Planning .......................................................................................................................................................................................... 54
Other Regional Transmission Projects .................................................................................................................................................. 55
Distribution Planning ................................................................................................................................................................................... 57
CHAPTER 8
PORTFOLIO SELECTION ................................................................................................................................................... 59
CHAPTER 9
FUEL, MARKET AND DEMAND RISK ANALYSIS ......................................................................................................... 61
CHAPTER 10
CLOSING ................................................................................................................................................................................ 63
APPENDIX A .................................................................................................................................. EXISITING RESOURCES
APPENDIX B ................................................................................................................ NEW RESOURCE COST FACTORS
APPENDIX C .............................................................................. NEW RESOURCE COST AND PERFORMANCE DATA
Page ‐ 62019 Preliminary Integrated Resource Plan
List of Acronyms
ACRONYMS
ACC – Arizona Corporation Commission
ADMS – Advanced Distribution Management System
BESS – Battery Energy Storage System
BTA – Biennial Transmission Assessment
CAISO ‐ California Independent System Operator
CO2 – Carbon Dioxide
CT – Combined Turbine
DG ‐ Distributed Generation
DR – Demand Response
DSM – Demand Side Management
E3 – Energy and Environmental Economics
EE – Energy Efficiency
EHV – Extra High Voltage
EIA ‐ Energy Information Administration
EIM – Energy Imbalance Market
EPRI – Electric Power Research Institute
ESTF – Energy Storage Task Force
EV – Electric Vehicles
FERC – Federal Energy Regulatory Commission
GHG – Greenhouse Gas
GW – Gigawatt
GWh – Gigawatt‐Hour
Hg – Mercury
HV – High Voltage
IGCC – Integrated Gasification Combined Cycle
IRP – Integrated Resource Plan
ITC – Investment Tax Credit
kW – Kilowatt
kWh – Kilowatt‐Hour
kW‐yr – Kilowatt‐Year
LACE – Levelized Avoided Cost of Energy
LCOE – Levelized Cost of Electricity
LTO – Long‐Term Outlook
LSE – Load Serving Entity
MMBtu – Million British Thermal Units, also shown as MBtu
MW – Megawatt
MWh – Megawatt‐Hour
NEC – Navopache Electric Cooperative
Page ‐ 7Tucson Electric Power NERC ‐ North American Electric Reliability Corporation NGCC – Natural Gas Combined Cycle NOX – Nitrogen Oxide(s) NPV – Net Present Value NPVRR – Net Present Value Revenue Requirement NREL – National Renewable Energy Laboratory NTEC – Navajo Transitional Energy Company NTUA – Navajo Tribal Utility Authority O&M – Operations and Maintenance PCM – Production Cost Model PM ‐ Particulate matter PNM – Public Service Company of New Mexico PPA ‐ Purchased Power Agreement PIRP – Preliminary Integrated Resource Plan PTC – Production Tax Credit R&D – Research and Development REST – Renewable Energy Standard and Tariff RICE – Reciprocating Internal Combustion Engine RFP – Request for Proposal RUCO ‐ Residential Utility Consumer Office SAT – Single‐Axis Tracking SCT – Societal Cost Test SEPA – Smart Electric Power Alliance SMR – Small Modular (Nuclear) Reactor SRP – Salt River Project Agricultural and Improvement District SO2 – Sulfur Dioxide SWEEP – Southwest Energy Efficiency Project TEP – Tucson Electric Power Company TOUA ‐ Tohono O’odham Utility Authority TRICO – Trico Electric Cooperative UES – UniSource Energy Services WECC ‐ Western Electricity Coordinating Council Page ‐ 8
2019 Preliminary Integrated Resource Plan

                                                                                                    Chapter 1

OVERVIEW
Introduction

Tucson Electric Power Company’s (“TEP” or “Company”) 2019 Preliminary Integrated Resource Plan (PIRP)
introduces and discusses the issues that TEP plans to analyze in detail as it develops the Final 2020 Integrated
Resource Plan (IRP) due to be filed with the Arizona Corporation Commission (ACC or “Commission”) on April
1, 2020. The purpose of this PIRP is to increase transparency into, and improve understanding of the IRP, and
to provide the Commission, customers and other stakeholders with the background needed to offer meaningful
feedback on the Company’s future resource plans. TEP will consider stakeholder feedback it receives in
developing the Final 2020 IRP.

In addition to providing a snapshot of TEP’s current loads and resources, this PIRP provides an overview of the
tools, methods, sources and assumptions TEP will use in developing the Final 2020 IRP. This PIRP also provides
an update on near‐term initiatives identified in the TEP 2017 IRP’s Five‐Year Action Plan1 and the TEP 2018
Action Plan Update2.

TEP is introducing several new initiatives during this IRP cycle that we believe will improve the relevance and
usefulness of the IRP to the Commission, stakeholders and to our customers. First, we have formed an IRP
Advisory Council to improve stakeholder engagement through in‐depth discussions with a diverse group of
customers, community leaders and advocacy groups. In addition, we have enlisted the University of Arizona to
assist the Company in establishing science‐based targets for reducing greenhouse gas (“GHG”) emissions.
Finally, we are introducing a new and more rigorous method for evaluating resource adequacy that goes
beyond capacity planning for summer peak to include issues around over‐generation, system regulation, and
ramping needs.

Modernization of Arizona’s Energy Rules

Arizona utility IRPs are developed in accordance with rules established by the Commission3 and are heavily
influenced by other Commission rules relating to the procurement of renewable energy, the implementation of
energy efficiency and demand side management programs, and other initiatives. In August 2018, the
Commission opened a rulemaking docket4 to explore modifications to the Commission’s energy rules (“Arizona
Energy Rules”).

1 TEP 2017 Integrated Resource Plan, April 3, 2017, p 289; https://www.tep.com/wp‐content/uploads/2017/04/TEP‐2017‐Integrated‐
Resource.pdf
2 TEP 2018 Action Plan Update, April 30, 2018, https://www.tep.com/wp‐content/uploads/2018/06/TEP‐Action‐Plan.pdf
3 Arizona Administrative Code R14‐2‐701 et. Seq Resource Planning and Procurement
4 In the matter of possible modification to the Arizona Corporation Commission’s Energy Rules, August 17, 2018, RU‐00000A‐18‐0284

                                                                                                                           Page ‐ 9
Tucson Electric Power
TEP supports a re‐examination of the Renewable Energy Standard and Tariff (REST) rules and we agree with
the premise behind the Arizona Energy Rules docket5 that any such re‐examination should be comprehensive,
including all energy policies before the Commission, both existing and proposed. It would be counterproductive
to continue assessing related energy initiatives such as energy efficiency, baseload security, forest biomass
energy, and electric vehicles in separate dockets and proceedings. These policy choices should be better
aligned.
TEP is committed to the cost‐effective deployment of clean resources and we have a history of appropriate early
adoption of such technologies.
In 1998, TEP began burning landfill gas in Unit 4 at the H. Wilson Sundt Generating Station (“Sundt”).
In 2003, TEP’s solar facility at the Springerville Generating Station (“Springerville”) was one of the largest
photovoltaic (“PV”) solar arrays in the world and demonstrated to produce energy at a levelized cost under
$0.10/kWh6.
TEP ranked #2 in the nation for per‐capita installed storage capacity in a 2017 ranking by the Smart
Electric Power Alliance (SEPA)7.
In 2015, TEP voluntarily adopted a goal to generate 30% of its retail energy use from renewable resources
by 2030, doubling the current mandate of 15% by 2025.
With the addition of three (3) new projects currently under contract, we will be approaching that 2030 goal
nine (9) years ahead of schedule. In 2021, production from renewable energy resources is expected to exceed
28% of TEP’s retail sales. In addition, TEP was early to recognize the need to reduce its reliance on baseload
coal resources.
In 2015, the Company ended the use of coal as a fuel at Sundt Unit 4 (130 MW).
In 2017, TEP retired Unit 2 at the San Juan Generating Station (“San Juan”) (170 MW).
In the TEP 2017 IRP, the Company committed to further reduce its reliance on baseload coal through
planned retirements at Navajo Generating Station (“Navajo”) by the end of 2019 (168 MW) and Unit 1 at
San Juan by the end of June 2022 (170 MW).
These retirements represent a 41% decrease (638 MW) in TEP’s coal capacity since 2014.
Arizona needs a coordinated, integrated energy policy that incorporates resiliency, affordability, reliability,
sustainability, innovation, economic development and resource diversity. Then each utility will develop its
unique contribution to Arizona’s overall policy objectives. The policy itself should not pick winners and losers,
rather, utilities need the flexibility to select the resources that fit best within their existing portfolio. Achieving
an appropriate balance between these objectives is a challenge and it only becomes more difficult when utilities
lose flexibility through narrowly crafted mandates. If given a clear vision of Arizona’s desired energy future,
utilities, through their IRPs, can formulate a balanced path toward that future.
5 Memorandum to Docket Control from Elijah O. Abinah, Director, Utilities Division; RE: Request for New Docket, dated August 17, 2018 lists
specific subjects to be considered in the rulemaking
6 http://www.physics.arizona.edu/~cronin/Solar/References/Shade%20effects/TEPSolar_Springerville.pdf
7 https://sepapower.org/2018‐top‐10‐winners/ TEP was ranked second in the nation for per‐capita additions to its energy storage
resources in 2017 with approximately 50 watts per customer. SEPA also ranked TEP third in the nation for adding 21 megawatts (MW) of
battery storage systems to its local electric grid. https://www.tep.com/news/tep‐ranks‐among‐nations‐top‐utilities‐for‐expanding‐energy‐
storage
Page ‐ 102019 Preliminary Integrated Resource Plan
Planning Objectives
For a long‐term plan to be credible to customers and regulators, and useful to the utility as a guide for decision‐
making, it needs to be focused on meaningful planning objectives. However, planning objectives are often times
competing, therefore, the final plan needs to strike a balance between these objectives which involves trade‐offs
as one optimizes a final plan that represents the best overall outcome. For the Final 2020 IRP, TEP proposes to
develop its plan based on the following key planning objectives.
Affordability for our customers must be our primary planning objective – This objective will be
measured based on the change in total net present value (NPV) revenue requirement and an estimate
of the corresponding aggregated rate impact.
Reliability of Service – All portfolios presented in the Final 2020 IRP will be capable of meeting
anticipated customer demand in every hour during the planning horizon without load curtailment
through a stochastic assessment of peak load, minimum load, 3‐hour ramping, and 10‐minute
regulation.
Risk – Portfolios will be evaluated against a wide range of future conditions to assess the impact on
cost associated with unforeseen circumstances.
GHG Emission Reductions – Rather than a renewable energy target, this objective, more directly
focused on the sustainability challenge of climate change, will be measured by total system GHG
emission reductions.
Stakeholder Involvement
We recognize the need for greater stakeholder involvement in the IRP process and the evolving energy needs of
our customers. The roles that certain resources play within a utility’s portfolio are changing.8 Certain
resources can serve multiple roles, and the overall model that utilities have traditionally relied on (central
power stations serving load through transmission to a distribution grid) is no longer the only model available to
serve customers’ energy needs.
Therefore, as part of the 2020 IRP process, TEP has expanded its outreach efforts and formed an Advisory
Council (AC) to allow for more in‐depth discussions with stakeholders. TEP is holding monthly meetings of the
AC from May 2019 through December 2019. Each meeting will focus on a specific issue(s) relating to the IRP,
allowing the members of the AC and TEP to engage in detailed discussions. For some of the topics, TEP or other
stakeholders will provide background information or analysis prior to the meeting so that all participants
arrive at the meeting prepared to discuss the topic at hand. TEP will summarize the discussions in written
minutes, and AC members will be encouraged to participate in public workshops to be held by TEP and the ACC.
TEP will document these key outcomes from the AC and how those outcomes will be brought forward to be
considered in the Final 2020 IRP.
8 TEP 2017 IRP, p83. A New Integration Approach to Resource Planning
Page ‐ 11Tucson Electric Power
Membership on the AC is by invitation with the intent to represent the local perspective of a broad spectrum of
points of view while keeping the size of the group to a manageable level. The AC includes individuals
representing the following groups:
Customers
o Large customers
o Small to medium sized customers
o Residential customers (Residential Utility Consumer Office [RUCO])
o Low income community
o Seniors
Government
o Municipal
o Pima County
o State of Arizona
o Federal Government
o School District
Stakeholders and Special Interests
o Environmental Advocates
o Energy Efficiency
o Renewable Energy
o Economic Development
In addition to the AC process, TEP will lead and/or participate in public workshops and Commission
proceedings to present our plans for the IRP and to solicit feedback from interested community members. A list
of public workshops and Commission proceedings required by Decision No. 766329, along with the overall
schedule for the 2020 IRP cycle, is presented in Table 1.
9 Dates reflected as modified by Decision No. 77176 (May 15, 2019).
Page ‐ 122019 Preliminary Integrated Resource Plan
Table 1 ‐ 2020 IRP Public Workshops and Commission Proceedings
Topic Responsibility Timing
LSEs file PIRPs LSEs August 1, 2019
Portfolio Selection Workshop TEP / ACC Staff Within 60 days after filing the PIRP
ACC Staff and
PIRP Review August 1, 2019 – September 1, 2019
Stakeholders
Energy Efficiency post 2020
ACC Staff Not specified
Workshop
PIRP Workshop LSEs / ACC Staff September 2019
ACC Open Meeting – September 1, 2019 – November 15,
ACC
Review PIRP 2019
Pre‐filing Workshop –
LSEs / ACC Staff December 1, 2019 – January 15, 2020
Final IRP
Final IRPs Filed LSEs April 1, 2020
Comments due on Final IRPs Stakeholders July 1, 2020
LSE response to Stakeholder
LSEs August 15, 2020
comments due
ACC Staff Assessment and
ACC Staff November 2, 2020
Proposed Order due
ACC Open Meeting and Final
ACC February 15, 2021
Order
Page ‐ 13Tucson Electric Power Page ‐ 14
2019 Preliminary Integrated Resource Plan

                                                                                                                Chapter 2

ACTION PLAN UPDATE
TEP continually evaluates adjustments to the projects addressed in its Five‐Year Action Plan (as updated in the
TEP 2018 Action Plan Update) to respond to changing conditions and new opportunities. This section provides
an update on specific projects and documents any changes to their implementation.

Resource Diversification Update

TEP’s 2018 Action Plan Update described the Company’s commitments to reduce its reliance on baseload
generation resources. By 2022, TEP’s portfolio diversification strategy will have reduced TEP’s coal capacity by
638 MW since 2014. Below are updates on the Navajo and San Juan retirement plans.

Navajo Generating Station
In 2017, the owners of Navajo came to an agreement with the Navajo Nation to extend the land lease through
December 2019. In addition, the plant operator, the Salt River Project Agricultural and Improvement District
(“SRP”) worked with a number of third‐parties to find another entity to operate the plant after 2019, when the
current owners cease operation of the plant. Those efforts have not identified any new entities willing to
continue operation, therefore, the owners of Navajo intend to cease operations at the plant during the fourth
quarter of 2019 and immediately commence decommissioning activities.

San Juan Generating Station
In TEP’s 2017 IRP, the Company stated its intention to exit from its participation in San Juan when the current
coal supply agreement ends in June 2022.10 Subsequently, Public Service Company of New Mexico (“PNM”) filed
an IRP on July 3, 2017, which showed that its most cost effective portfolio would include the retirements of
Units 1 and 4 at San Juan in 2022. Based on these results, TEP and PNM have committed to retiring San Juan
Unit 1 by June 30, 2022.

Gila River Power Station
TEP’s 2018 Action Plan Update described how the Company plans to rebalance its resource portfolio with a
portion of firm capacity sourced from faster ramping, more efficient natural gas resources. In anticipation of
the coal unit retirements mentioned above, the Company entered into an agreement with SRP to acquire rights
to 550 MW of capacity at the Gila River Power Station (“Gila River”). Gila River Unit 2 provides the Company
with the opportunity to acquire a low cost flexible natural gas resource to help support future renewables while
achieving significant reductions in emissions and water consumption in the near‐term. In today’s low‐priced
natural gas commodity market, Gila River Unit 2 is one of the lowest cost resources in the TEP portfolio.11

Reciprocating Internal Combustion Engine (RICE) Project
TEP’s 2018 Action Plan Update described changes to the Company’s plans for procuring flexible resources to
accommodate the increasing penetration of intermittent renewable resources on its system. TEP’s project

10   TEP 2017 IRP at p. 259
11   Based on 2019 forward market and natural gas prices, the full cost of operations at Gila River Unit 2 is projected to be less than 2.1¢/kWh.

                                                                                                                                     Page ‐ 15
Tucson Electric Power involving the installation of ten (10) RICE generators at Sundt received its final Air Quality Permit from the Pima County Department of Environmental Quality on December 3, 2018. Construction of the facility commenced immediately upon receipt of the permit. TEP anticipates commercial operation of the RICE generators during the first quarter of 2020. The RICE generators will have a combined nominal generating capacity of 182 MW and will replace two 1950s‐ vintage natural gas‐fired steam boilers that will be retired prior to commercial operation of the RICE units. The steam boilers have a combined nominal capacity of 162 MW. The project is anticipated to result in a 60% reduction in local area nitrogen oxides (“NOx”) emissions as well as a 70% reduction in local groundwater use. Renewable Resources As part of the 2018 IRP Action Plan Update, the Company made commitments to accelerate its plans to increase the build out of its utility‐scale projects by conducting three separate requests for proposals (RFP) in order to secure additional low‐cost solar and wind resources prior to the reduction of federal tax incentives. As a result of these RFP initiatives, TEP is on track to install an additional 446 MW of new wind and solar projects by the end of 2020. These commitments will increase the Company’s renewable solar and wind capacity to approximately 723 MW and, along with customer sited generation, will enable TEP to serve approximately 28% of the Company’s retail load with renewable energy starting in 2021. These projects are summarized in more detail below. Solar Resource Projects In September 2017, TEP entered into a 20‐year Purchased Power Agreement (PPA) with Wilmot Energy Center, LLC, a subsidiary of NextEra Energy Resources, for 100 MW of PV single‐axis tracking (SAT) solar energy and a 30 MW/120 MWh battery energy storage system (BESS). To accommodate the interconnection of the project to our system, TEP is developing the Sonoran Substation located south and east of the intersection of East Old Vail Connection and South Swan roads. The BESS will be charged directly from the adjacent solar system for at least 75% of its total annual energy for the first five years of operation. The solar system and BESS are anticipated to achieve commercial operation by December 2020. Wind Resource Projects In January 2017, TEP entered into a 20‐year PPA with Borderlands Wind, LLC, a subsidiary of NextEra Energy Resources, for 99 MW of wind energy. The Borderlands Wind project will consist of 36 turbines located in Catron County, New Mexico and will connect to TEP’s 345kV transmission system near Springerville. The system is anticipated to achieve commercial operation by December 2020. The TEP 2018 Action Plan Update provided a status summary of TEP’s effort to obtain high‐quality, low‐cost wind power. In its January 2018 RFP, TEP requested high capacity factor wind power (40 % or greater) that would complement its current renewable energy resources in terms of seasonal and diurnal energy generation. In March 2018, TEP received several proposals for both PPAs and build‐transfer‐agreements (BTAs). After reviewing the proposals and meeting with several of the project developers, TEP entered into negotiations with respondent EDF Renewables North America (“EDF”) on a BTA project in eastern New Mexico referred to as “Oso Grande”. Oso Grande will provide up to 247 MW of capacity and is projected to achieve an average annual capacity factor of 45%. TEP entered into a contract with EDF in March 2019 and the project is scheduled to be in service by the end of 2020, which will enable TEP to secure the maximum value for federal production tax credits and result in a corresponding reduction in customer rate impacts. Page ‐ 16
2019 Preliminary Integrated Resource Plan

Energy Storage Projects
In order to support the use of more renewables, the Company has made investments in grid balancing
resources such as Lithium‐ion (“Li‐ion”) BESSs. In 2017, the Company added three Li‐ion BESSs totaling 21 MW
to its resource portfolio. As mentioned above the additional 30 MW BESS at the Wilmot Energy Center project
will increase the Company’s total storage capacity to approximately 51 MW by the end of 2020.

Resources Adequacy Study
In past IRPs, TEP demonstrated resource adequacy by identifying resource portfolios that provide at least a
15% peak load planning reserve margin in each year. In its 2017 IRP, TEP also included an assessment of the
operating flexibility of its resources by comparing the total 10‐minute ramping capacity of its energy resources
to the 10‐minute ramping needs resulting from contingency requirements and expected changes in net load12.

Given the increasing amount of renewable energy being planned, TEP hired Siemens Industry, Inc. (“Siemens”)
to help the Company enhance its methodology for assessing resource adequacy in terms of both capacity and
flexibility for its Final 2020 IRP. The expected outcome of this work is to develop a resource adequacy
methodology that determines at which point TEP’s planned capacity and flexibility resources may be
inadequate to serve retail load with high saturation levels of renewable resources. This will be done by
examining various combinations of solar and wind power expansion scenarios, resulting in renewable energy
penetration of up to 50% of retail sales. Siemens will use TEP’s historic load and renewable energy variability
to determine stochastically the amount of capacity and flexibility needed under such scenarios.

For each scenario, Siemens will identify the(i) peak net load, (ii) minimum net load, (iii) maximum 3‐hour net
load ramps (e.g., during sunrise and sunset), and (iv) maximum 10‐minute net load ramps (e.g., during periods
of rapid wind change and/or cloud cover). For each of these four criteria, the resource adequacy requirements
will be compared to the resource capabilities of TEP’s portfolio under six distinct scenarios during the year
2024. Any shortfalls in resources will be assumed to be provided through additional energy storage. The
scenarios will then be evaluated using TEP’s production cost model, at 10‐minute intervals to verify that TEP’s
portfolio, plus any additional energy storage, will be sufficient to meet the four reliability criteria identified
above.

Natural Gas Storage
TEP continues to evaluate and support the development of large scale, underground natural gas storage in
Arizona. Natural gas storage within the state would improve the reliability of natural gas fired generation in
responding to rapidly changing loads as a result of the intermittency caused by renewable resources.
Moreover, due to the distance between Arizona’s largest load pockets (Phoenix and Tucson) and the San Juan
and Permian natural gas production basins, a state sourced natural gas storage facility would boost system
resiliency. The boost is achieved by supplying natural gas during periods of shortfalls such as when the natural
gas mainlines experience operational issues, and storing excess natural gas during periods when the natural gas
mainlines have no operational limitations. Natural gas storage in Arizona is feasible, both technically and
economically, if the project includes participation by all the major Arizona electric and natural gas utilities and
with appropriate support from local and state government. TEP will continue to assess the need for, costs of,
and benefits of natural gas storage in Arizona in relation to the specific portfolio options evaluated in the Final
2020 IRP13.

12 Net load is the retail and firm wholesale energy demand in a given period less the total renewable energy production during that same
period.
13 ACC Decision 76632 dated March 29, 2018 (Docket No. E‐00000V‐15‐0094) ordered TEP and other load serving entities to “address

natural gas storage in greater detail in future IRPs, including a discussion of efforts to develop natural gas storage, the costs and benefits of
natural gas storage, and risks resulting from a lack of market area natural gas storage in Arizona”

                                                                                                                                        Page ‐ 17
Tucson Electric Power Page ‐ 18
2019 Preliminary Integrated Resource Plan

                                                                                     Chapter 3

LOAD FORECAST
Introduction

In the IRP process, it is crucial to estimate the load obligations that existing and future resources will be
required to meet for both short‐ and long‐term planning horizons. As a first step in the development of the
resource plan, a long‐term load forecast is produced. This chapter will provide an overview of the anticipated
long‐term load obligations at TEP, a discussion of the methodology and data sources used in the forecasting
process, and a summary of the tools used to deal with the inherent uncertainty surrounding a number of key
forecast inputs.

The specific load and demand projections presented in this chapter represent TEP’s December 2018 forecast.
The Final 2020 IRP will be based on TEP’s December 2019 forecast.

The sections in this chapter include:

        Company Overview: TEP geographical service territory, customer base, and energy consumption by
        rate class

        Reference Case Plan Forecast: An overview of the Reference Case Plan forecast of energy and peak
        demand used in the planning process.

        Wholesale Obligations: An outline of the firm system requirements for wholesale electricity sales

        Summary: Compilation of results from this analysis

                                                                                                       Page ‐ 19
Tucson Electric Power
Company Overview
Geographical Location and Customer Base
TEP currently provides electricity to more than 425,000 customers in the Tucson metro area (Pima County).
Pima County has experienced growth over the last decade and is estimated to have a population of
approximately 1,030,000 people.
Map 2 ‐ Service Area of Tucson Electric Power and Unisource Energy Services14 (UES) Utilities
14
Unisource Energy Services is a regulated utility providing electric and natural gas services in Arizona and is a sister company to Tucson
Electric Power.
Page ‐ 202019 Preliminary Integrated Resource Plan
Customer Growth
In recent years, population growth in Pima County and customer growth at TEP have slowed dramatically
compared to periods before 2008 because of the severe recession and subsequent economic weakness. While
customer growth has rebounded somewhat from its recessionary lows, it is not expected to return to its pre‐
recession level. Chart 1 outlines the historical and expected customer growth in the residential rate class from
2003‐2035. As customer growth is the most significant factor behind growth in TEP’s load, the continuing
customer growth will necessitate additional resources to serve the increased load in the medium term.
Chart 1 ‐ TEP Residential Customer Growth Including Estimates for 2019‐2035
475,000 3.5%
450,000 3.0%
425,000 2.5%
Total Residential Customers
Customer Load Growth %
400,000 2.0%
375,000 1.5%
350,000 1.0%
325,000 0.5%
300,000 0.0%
2003 2005 2007 2009 2011 2013 2015 2017 2019 2021 2023 2025 2027 2029 2031 2033 2035
Axis Title
Low Growth Mid Growth High Growth % Growth Mid
Page ‐ 21Tucson Electric Power
Retail Sales by Rate Class
In 2018, TEP experienced a peak demand of approximately 2,414 MW, a nearly 6% increase from 2016, with
approximately 8,900 GWh of retail sales. Approximately 66% of 2018 retail energy was sold to the residential
and commercial customers, with approximately 34% sold to the industrial and mining customers. Customer
classes such as municipal street lighting, etc. accounted for the remaining sales.
Chart 2 gives a detailed breakdown of the estimated 2019 retail sales by rate class.
Chart 2 – Estimated 2019 Retail Sales % by Rate Class
Other
0.2%
Mining
11.9%
Industrial Residential
22.1% 41.8%
Commercial
24.0%
Page ‐ 222019 Preliminary Integrated Resource Plan
Reference Case Plan Forecast
Methodology
The load forecast used in the TEP IRP process is produced using a “bottom up” approach. A separate monthly
energy forecast is prepared for each of the major rate classes (residential, commercial, industrial, and mining).
As the factors affecting usage in each of the rate classes vary significantly, the methodology used to produce the
individual rate class forecasts also varies. However, the individual methodologies fall into two broad categories:
1) For the residential, commercial, and small industrial classes, forecasts are produced using statistical
models. Inputs include factors such as historical usage, normal weather conditions (e.g. average
temperature and dew point), demographic forecasts (e.g. population growth), and economic conditions
(e.g. real gross county product and real per capita personal income).
2) For the industrial and mining classes, forecasts are produced for each individual customer. Inputs
include historical usage patterns, information from the customers themselves (e.g. timing and scope of
expanded operations), and information from internal company resources working closely with the
mining and industrial customers.
After the individual monthly forecasts are produced, they are aggregated (along with any remaining
miscellaneous consumption falling outside the major categories) to produce a monthly energy forecast for the
Company. Following this aggregation, the retail load is reduced by the amount of customer Energy Efficiency
(EE) and Distributed Generation (DG) anticipated in each year.
TEP used a different approach in forecasting DG resources and Electric Vehicle (EV) loads as these have
significant impacts on load projections. Using an econometric model, DG growth is projected to slow from an
average annual rate of 61.9% for the 2008‐2018 period to 4.3% for the 2018‐2028 period. This is largely a
reflection of the maturation of the DG market and the establishment of a mechanism for reimbursing DG owners
for excess energy transferred to the grid. The current market for EVs is still largely uncertain. To estimate the
market penetration of EVs, TEP used a national EV forecast and adjusted a few assumptions to more closely
relate the forecast to Pima County. The primary assumptions are that Pima County is less economically affluent
than some parts of the United States and vehicles have a longer life expectance due to climatological reasons.
Both of these factors suggest that vehicle turnover rates are slower in Pima County, so the Company is using an
average vehicle age of 14 years instead of the 12‐year average in the United States.
After the monthly energy forecast for the Company is produced, the anticipated monthly energy consumption is
used as an input to estimate the peak demand. The peak demand model is based on historical relationship
between hourly load and weather, calendar effects, and sales growth. Once these relationships are estimated,
60+ years of historical weather scenarios are simulated to generate a probabilistic peak load forecast.
Page ‐ 23Tucson Electric Power
Reference Case Plan Retail Energy Forecast
TEP’s weather normalized retail energy sales fell significantly from 2008, immediately preceding the Great
Recession, through 2017. In 2018, a rebound in commodity prices allowed mining load to return to historical
levels and economic development caused weather normalized sales to increase compared to 2017. As shown on
Chart 3, the underlying sales forecast is showing an expected annual growth rate of 0.7% in the 2020‐2035
period. Including the forecasted growth in electric vehicle use, that estimated growth rate could increase to
1.4% and after accounting for the Rosemont mine project, that growth rate further increases to 2.0%. These
forecast growth rates are all below the historical 2.5% growth rate in the 1993 to 2008 period, prior to the
Great Recession.
Chart 3 ‐ Reference Case Plan Retail Energy Sales, Weather Normalized Historical
13,000
12,000
11,000
GWh
10,000
9,000
8,000
7,000
2008
2009
2010
2011
2012
2013
2014
2015
2016
2017
2018
2019
2020
2021
2022
2023
2024
2025
2026
2027
2028
2029
2030
2031
2032
2033
2034
2035
Ex. Rosemont Ex. Electric Vehicles and Rosemont Total Sales (MWh)
Page ‐ 242019 Preliminary Integrated Resource Plan
Reference Case Plan Retail Energy Forecast by Rate Class
As illustrated in Chart 4, the Reference Case Plan forecast assumes significant short‐term changes for the next
few years followed by slow steady growth starting in 2024. However, the growth rates vary significantly by rate
class. The energy sales trends for each major rate class are detailed in Chart 4.
Chart 4 ‐ Reference Case Plan Retail Energy Sales by Rate Class
5,000
4,500
4,000
3,500
TEP Retail (GWh)
3,000
2,500
2,000
1,500
1,000
500
0
2008
2009
2010
2011
2012
2013
2014
2015
2016
2017
2018
2019
2020
2021
2022
2023
2024
2025
2026
2027
2028
2029
2030
2031
2032
2033
2034
2035
Residential Commercial Industrial Mining Other
After experiencing consistent year over year growth throughout the past, residential, commercial and industrial
energy demand remained nearly flat from 2008 through 2018. Both are assumed in the Reference Case Plan to
increase steadily after 2019. Mining sales are assumed to expand due to the Rosemont mine project.
Reference Case Plan Peak Demand Forecast
As show in Chart 5 below, peak demand is expected to drop in 2019 based on the assumption of a return to
normal weather although the upper confidence band shows it could remain relatively unchanged. Similar to the
sales forecast, as the mining class expands and electric vehicles become more common, the retail peak demand
is expected to grow.
Page ‐ 25TEP Retail Peak Demand (MW)
Page ‐ 26
2,000
2,100
2,200
2,300
2,400
2,500
2,600
2,700
2,800
2,900
3,000
2005
2006
Tucson Electric Power
2007
2008
2009
2010
2011
2012
2013
2014
2015
2016
2017
2018
2019
2020
2021
Chart 5 ‐ Reference Case Plan Peak Demand
2022
2023
2024
2025
2026
2027
2028
2029
20302019 Preliminary Integrated Resource Plan
Data Sources Used in the Forecasting Process
As outlined above, the Reference Case Plan forecast requires a broad range of inputs (demographic, economic,
weather, etc.) For internal forecasting processes, TEP utilizes a number of data sources:
IHS Global Insight
The University of Arizona Forecasting Project
Arizona Department of Commerce
U.S. Census Bureau
National Oceanic and Atmospheric Administration (NOAA)
Risks to Reference Case Plan Forecast and Risk Modeling
As always, there is a large amount of uncertainty with regard to projected load growth. Some of the key risks to
the current forecast include:
Local and regional general economic conditions
Structural changes to customer behavior
Volatility in industrial metal prices and associated shifts in mining consumption
Efficacy of EE programs (i.e. percentage of load growth offset by demand side management programs)
Technological innovations (e.g. electric vehicle penetration)
Volatility in demographic assumptions (e.g. higher or lower population growth)
Regulatory changes (e.g. introduction of a price on Carbon emissions)
Because of the large amount of uncertainty underlying the load forecast, it is crucial to consider the implications
to resource planning if TEP experiences significantly lower or higher load growth than projected. For this
reason, load growth is one of the fundamental factors considered in the risk analysis process that will be
undertaken as part of the Final 2020 IRP. Specifically, the performance of each potential resource portfolio is
considered over 100 iterations of potential load growth (along with correlated gas and power prices in each
case).
Page ‐ 27Tucson Electric Power
Firm Wholesale Energy Forecast
In addition to retail sales directly to customers, TEP is currently under contract to provide firm wholesale
energy to four utility customers:
1) Tohono O’odham Utility Authority (TOUA) through August 2019
2) Navajo Tribal Utility Authority (NTUA) through December 2022
3) TRICO Electric Cooperative (“TRICO”) through December 2024
4) Navopache Electric Cooperative (NEC) through December 2040
TEP’s firm wholesale obligations based on current contracts are shown in Table 2 below. It is important to note
that no contract extensions have been assumed; however, there is a possibility that any or all agreements could
be extended. TEP will evaluate the need for any changes to its resource portfolio to accommodate additional
wholesale load prior to entering any new agreements.
Page ‐ 28You can also read