2020 World Air Quality Report - Region & City PM2.5 Ranking - Greenpeace
←
→
Page content transcription
If your browser does not render page correctly, please read the page content below
2020
World
Air Quality
Report
Region & City PM2.5 Ranking

Contents
                      About this report ................................................................................................ 3
                      Executive summary ............................................................................................. 4
                      Where does the data come from? ........................................................................... 5
                           Why PM2.5?
                      Data presentation ................................................................................................ 6
                      COVID-19, air pollution and health .......................................................................... 7
                           Links between COVID-19 and PM2.5
                           Impact of the COVID-19 pandemic on air quality

                      Global overview ................................................................................................. 10
                           World country ranking
                           World capital city ranking
                           Overview of public monitoring status

                        Regional Summaries
                           East Asia ..................................................................................................... 14
                           		            China ........................................................................................ 15
                           		            South Korea ............................................................................... 16
                           Southeast Asia ............................................................................................. 17
                           		            Indonesia .................................................................................. 18
                           		            Thailand .................................................................................... 19
                           		            Vietnam .................................................................................... 20
                           South Asia ................................................................................................... 21
                           		            India ......................................................................................... 22
                           		            Pakistan ..................................................................................... 23
                           Western Asia ................................................................................................ 24
                           Europe ........................................................................................................ 25
                           Northern America ......................................................................................... 26
                           		            United States ............................................................................. 27
                           Latin America & Caribbean .............................................................................. 28
                           Africa .......................................................................................................... 29
                           		            South Africa ............................................................................... 30
                           Oceania ....................................................................................................... 31

                      Next Steps ........................................................................................................ 32
                           What can governments do? What can I do?
                           Become an outdoor data contributor
                      Methodology .................................................................................................... 34
                           Data sources
                           Data calculation
                           Data availability
                           Disclaimer
                      FAQ ................................................................................................................. 36
                      References ...................................................................................................... 37
                      Acknowledgments ............................................................................................ 41

2 |   2020 World Air Quality Report
About this report
           The 2020 World Air Quality Report analyzes PM2.5 data reported by ground-level monitoring stations around the
           world, as aggregated through IQAir’s air quality information platform.

           By comparing PM2.5 levels across the globe, IQAir strives to highlight a wide variety of air quality challenges as
           well as underscore the threat of human-caused air pollution.1 Raising air pollution awareness empowers people
           to take action to improve air quality and reduce their personal exposure.

           Only PM2.5 monitoring stations with high data availability have been included. Thus, the 2020 World Air Quality
           Report is based on a subset of the information provided on IQAir’s online air quality information platform and
           covers 106 countries.

           An interactive presentation of the report’s dataset is available online, allowing further exploration of air quality
           across global regions and subregions.

           1   An explanation of PM2.5 and its importance is provided on page 5.

3 |   2020 World Air Quality Report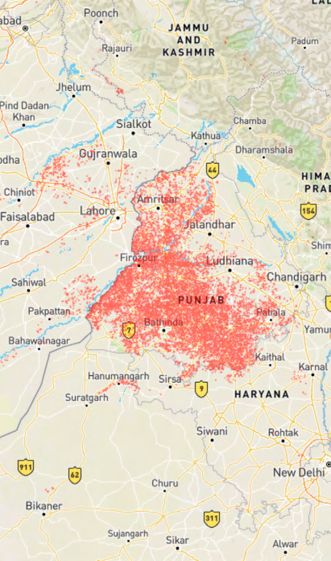
Executive summary
           Air pollution continues to present one of the world’s biggest health hazards to people everywhere, contributing to
           about 7 million premature deaths annually.2, 3 600,000 of these deaths are children.4 Compounding this staggering
           health crisis, air pollution is estimated to cost the global economy upwards of $2.9 trillion per year (3.3% of global
           GDP) due to fossil fuel emissions alone, while also contributing to a range of severe environmental problems.5

                                                            As we learn more about air pollution, we see how it affects our lives. From
            Air pollution contributes                       mental health, Alzheimer’s, and loss of vision to vulnerability to diseases
            to about 7 million early                        such as COVID-19, 2020 brought another year of new insights into the
                                                            extent to which air pollution can impact people’s health and wellbeing.6, 7, 8
            deaths annually, while
            burdening the global                            This report is based on the world’s largest database of ground-based
                                                            air pollution measurements, aggregating PM2.5 data published in real
            economy upwards of                              time from ground-based sensors throughout 2020. This data largely
            $2.9 trillion per year.                         comes from governmental air monitoring stations as well as a growing
                                                            network of non-governmental air quality monitors.

           The data shows several trends:

                    As in previous years, South and East Asian locations emerge as the most polluted globally. Bangladesh,
                    China, India, and Pakistan share 49 of the 50 of the most polluted cities worldwide.

                    The COVID-19 pandemic emerged as a major, exceptional factor influencing air quality during 2020. Termed
                    by some the ‘largest-scale experiment ever’ into air quality, the temporary reduction in fossil fuel consumption
                    caused by lockdowns around the world correlated with significant decreases in air pollution compared
                    to previous years. 2020 saw a remarkable 65% of global cities experience air quality improvements from
                    2019, while 84% of countries saw improvements overall. Due to the circumstances of these improvements,
                    pollutant concentrations are likely to rebound.

                    Unfortunately, 2020 also witnessed several extreme air pollution events in the form of wildfires and dust
                    storms linked to increasing global temperatures as part of climate change as well as agricultural practices.
                    Record-breaking wildfires ravaged the United States, Australia, Siberia, and South America, while Indonesia
                    and parts of Africa also experienced devastating agricultural fires. These events resulted in major air pollution
                    spikes in these areas while also emitting copious greenhouse gases. While continuous contributions to air
                    pollution globally stem from the burning of fossil fuels and industrialization, the mutual benefits of combating
                    those who contribute to both climate change and air pollution are increasingly evident.

           Air quality data is essential to quantify and understand air quality trends like            Air quality awareness
           these in our fast-changing world. The increase in short-term, fast-evolving                 remains low in areas
           air pollution emergencies, such as those caused by wildfires, has only
           increased the importance of access to real-time air quality data, to which                  where real time
           only part of the world has access.                                                          monitoring is sparse
           The 2020 World Air Quality Report includes data for 106 countries, up from                  but pollution levels
           98 countries in 2019 and 69 countries in 2018.                                              may be high.
           Despite significant gains in global air quality monitoring infrastructure, numerous cities and countries still lack the
           data necessary to guide important health decisions. Laser-based PM2.5 sensors, available at a fraction of the cost of
           governmental monitors, provide an opportunity to improve data granularity and allow non-governmental organizations
           and individuals to become air quality data contributors.

4 |   2020 World Air Quality Report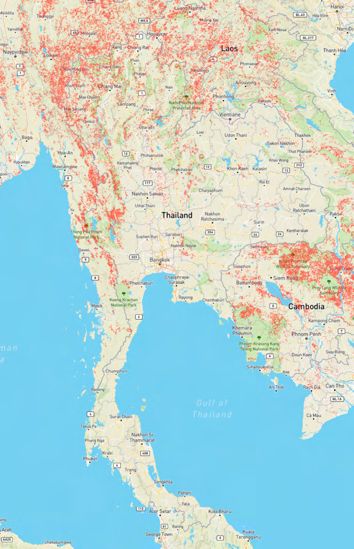
Where does the data come from?
           This report only includes PM2.5 data that has been reported by ground-based monitoring stations in real time
           or close to real time. Data is sourced from both governmental monitoring stations as well as privately owned
           stations operated by individuals and organizations. Additionally, historical datasets provided by governments
           have been selectively added to fill gaps or add locations where available.

           All PM2.5 data has been aggregated at a station level and then organized into settlements (hereafter referred
           to as cities). Depending on local population patterns and administrative structures, these can be cities,
           towns, villages, counties, or municipalities. The size and population density of cities thus varies.

           Why PM2.5?
           Among criteria pollutants commonly measured in real time, fine particulate matter (PM2.5) is currently understood
           to be the most harmful to human health due to its prevalence and far-reaching health risks. Exposure to PM2.5 has
           been linked to negative health effects like cardiovascular disease, respiratory illness, and premature mortality.

           PM2.5 is defined as ambient airborne particulates that measure up to 2.5 microns in size. These particles include
           a range of chemical makeups and come from a range of sources. The most common human-made sources
           include fossil-fuel powered motor vehicles, power generation, industrial activity, agriculture and biomass burning.

           The microscopic size of PM2.5 allows these particles to be absorbed deep into the bloodstream upon inhalation,
           potentially causing far-reaching health effects like asthma, lung cancer, and heart disease.
           PM2.5 exposure has also been associated with low birth weight, increased acute
           respiratory infections, and stroke.

5 |   2020 World Air Quality Report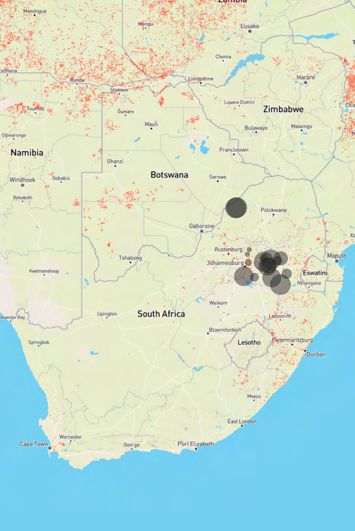
Data presentation
           This report refers to two guidelines in order to correlate PM2.5 concentration values to a more relatable reference
           for health risk: the World Health Organization (WHO) Air Quality Guideline for annual PM2.5 exposure and the
           United States Air Quality Index (US AQI).9, 10 The color key uses the US AQI standard, supplemented by the WHO
           guideline (in blue) for values under 10 μg/m³.

           WHO Air Quality Guideline
           The WHO states that, while no level of PM2.5 exposure is free from adverse health effects, annual average
           exposure below 10 μg/m³ minimizes risks.

                                                WHO PM2.5 Target: 10 µg/m³

           United States Air Quality Index (US AQI)
           This report uses the US Air Quality Index (AQI) to visualize PM2.5 levels that exceed the WHO target. The index
           translates daily pollutant concentrations into 6 categories ranging from “good” (green) to “hazardous” (maroon).
           This system has been adopted because it is widely used. However, adverse health effects can occur at any level
           of PM2.5 exposure, including those labeled as “good” by the US AQI. Moreover, while the US AQI is designed to
           communicate the hazards from short-term (24h) PM2.5 exposure, persistent long-term PM2.5 exposure at the same
           level is more dangerous.11 Thus, the AQI category names for daily exposure do not capture the full severity of the
           annual mean pollution exposure.

                                                             PM2.5                 Health Recommendation
                             US AQI Level                   (μg/m³)                  (for 24hr exposure)

                                  Good       0-50           0-12.0          Air quality is satisfactory and poses little or no risk.

                                                                            Sensitive individuals should avoid outdoor activity
                              Moderate      51-100        12.1-35.4         as they may experience respiratory symptoms.

                             Unhealthy                                      General public and sensitive individuals in particular are
                            for Sensitive   101-150       35.5-55.4         at risk to experience irritation and respiratory problems.
                               Groups
                                                                            Increased likelihood of adverse effects and aggravation
                              Unhealthy     151-200 55.5-150.4              to the heart and lungs among general public.

                                Very        201-300          150.5-         General public will be noticeably affected.
                              Unhealthy                      250.4          Sensitive groups should restrict outdoor activities.

                                                                            General public is at high risk to experience strong
                             Hazardous       301+           250.5+          irritations and adverse health effects. Everyone
                                                                            should avoid outdoor activities.

6 |   2020 World Air Quality Report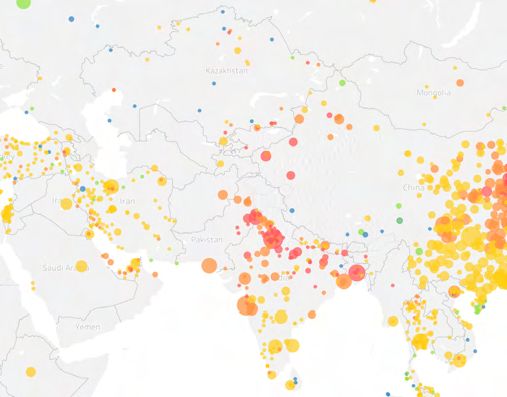
COVID-19, air pollution and health
           In March 2020, COVID-19 was deemed a pandemic, resulting in widespread restrictions on economic activity
           and drastic changes in human behavior.12 As billions sheltered in place for weeks at a time, transitioned to
           remote-work where possible, and limited movement to essential trips, dramatic air quality improvements were
           observed around the world in what has been described as an unprecedented air quality experiment.13

                                                          While lockdown measures and changes in human behavior and the
            Between 7 and 33% of                          economy led to healthier air in 2020 (with improvements observed in
            deaths from COVID-19                          67% of global cities), these environmental health improvements were
                                                          coupled with the spread of the deadly SARS-CoV-2 virus. A growing
            are attributable to long-                     body of research suggests that people exposed to air pollution,
                                                          particularly long-term air pollution, are more vulnerable to serious
            term air pollution
                                                          health impacts of COVID-19, which attacks people’s respiratory and
            exposure.                                     cardiovascular systems.

           Globally, an early study estimated the proportion of deaths from COVID-19 attributable to long-term air pollution
           exposure from anthropogenic emissions to be between 7 and 33% of deaths.14 These deaths may have been
           prevented by reducing human-made air pollution.

           Links between PM2.5 and COVID-19
           Several factors link PM2.5 pollution to increased COVID-19 vulnerability, including:
                    increased incidence of comorbidities: chronic air pollution exposure increases the risk of respiratory and
                    cardiovascular complications associated with more severe COVID-19 outcomes.
                    weakened lungs and autoimmune responses: particle pollution triggers cellular inflammation and promotes
                    the production of free radicals that induce cellular damage.15
                    increased virus susceptibility: evidence suggests that particle pollution can stimulate a receptor (ACE-2) on
                    cell surfaces and promotes uptake of the virus.16
                    increased virus transmission: COVID-19 cases have been linked to greater levels of air pollution, a trend that
                    may be attributed to air pollution extending the longevity of the viral particle load in the air.17

7 |   2020 World Air Quality Report
Impact of the COVID-19 pandemic on air quality
The connection between COVID-19 and air pollution has shone new light on the latter, especially as many locations
have observed visibly cleaner air – revealing that air quality improvements are possible with urgent, collective action.18
However, human-related emissions from industry and transport that may have been slowed by COVID-related lock-
downs are not the only factor influencing air pollution. Emissions aside, weather is the other main influence, affecting
how air pollution gathers, disperses, and undergoes chemical reactions, impacting what we breathe.
To more clearly understand how human behavior changes and human-made emissions influenced air pollution during
the COVID-19 pandemic in 2020, it is important to isolate other influencing factors, such as weather. To do this, The
Centre for Research on Energy and Clean Air (CREA) has conducted a data analysis of our 2020 dataset by applying
a “weather correction”.19 This method essentially links weather and air quality data at a given location and aims to
correct for the effects of weather on air pollution, better isolating the impact of emissions on overall air quality. Data
that has been corrected to eliminate the influence of weather is hereafter referred to as “de-weathered” data.
Observed and de-weathered changes in annual PM2.5
Many major cities across the world experienced reductions in annual PM2.5 levels in 2020 compared to 2019.
The map shows de-weathered changes on top with observed changes below.
Wuhan
-12 %
deweathered
-18 %
observed
Kathmandu Beijing
Wroclaw
-17 % -23 %
-18 %
deweathered
deweathered
deweathered
-18 % -11 %
-9 %
observed
observed
observed
London Bangkok
Los Angeles Tel Aviv-Yafo
+1 % Chicago -15 % -20 %
deweathered -15 % deweathered
deweathered
-9 % deweathered
-10 %
+15 % deweathered
-16 %
observed -21 % observed
observed
-13 %
observed
observed
Taipei
Lahore -11 %
deweathered
-15 %
deweathered
-10 %
-12 %
observed
observed
São Paulo Paris
+5 %
deweathered -14 %
deweathered
-7 %
observed -17 % Kampala
observed
-10 %
deweathered Tokyo
Buenos Aires -10 % -17 %
observed
-18 % observed
deweathered
Manama
-14 %
observed
+14.5 % Mumbai
observed -12 %
deweathered -13 %
Johannesburg deweathered Seoul
Santiago
-9 % -15 %
observed -9 % -9 %
-14 % deweathered observed deweathered
deweathered
-12 % -16 %
-15 %
observed
observed observed
Hanoi
Delhi
-16 % -8 %
deweathered
deweathered
Dubai
-15 % -19 %
-2 %
deweathered observed
observed
-20 % Jakarta
-11 %
observed
deweathered Melbourne
-20 %
observed
+1 %
observed
+27 %
observed
Singapore
-25 %
deweathered
-39 %
observed
Map of observed and de-weathered PM2.5 reductions in select major cities
From the sample, Singapore (-25%), Beijing (-23%), and Bangkok (-20%) observed the greatest reductions in
PM2.5 based on weather-corrected data from 2020 and the prior year. São Paulo (+5%), Los Angeles (+1%), and
Melbourne (+1%) observed the greatest increases – all three were impacted by severe wildfire seasons, which
greatly affected annual PM2.5 averages.
8 | 2020 World Air Quality Report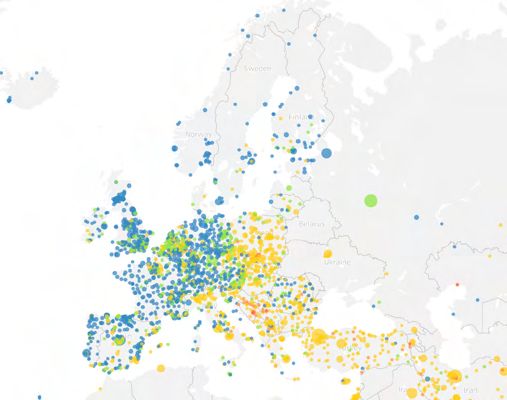
PM2.5 anomaly trends
           To visualize PM2.5 trends over 2020, the difference between observed and weather-corrected PM2.5 levels has been
           graphed for 6 cities: Bangkok, Delhi, Johannesburg, Kathmandu, Los Angeles, and Paris.

           The timing of lockdown measures in each city is indicated with different intensities of orange highlight
           (1: recommended; 2: curfew; 3: total confinement) to visualize the concurrence with lower air pollution levels.

           Red bars on the graph represent the amount of smoke (e.g. wildfires, biomass burning) that may have impacted the
           city air quality in any given week. This fire activity index represents the sum of fire radiative power along air trajectories
           flowing into these cities, and is calculated using air trajectory simulations and satellite-based fire detection. The
           concurrence of fires with PM2.5 increases is very clear in cities like Bangkok, Delhi, Johannesburg, and Los Angeles.

          Negative trends (or anomalies) indicate that PM2.5 levels were lower than what would have been expected in these
          weather conditions, suggesting a decrease in PM2.5 emissions. Often, the most dramatic negative anomalies coincide
          with the city’s first COVID-19 lockdown. Anomalies in Bangkok, Delhi, Johannesburg, Kathmandu, and Los Angeles nearly
          all reached -50% on a 30-day running average, meaning PM2.5 levels were almost halved for extended periods of time.

          The correlation between more relaxed or lifted lockdown measures and neutralized PM2.5 anomalies indicates that
          PM2.5 air quality improvements are not currently sustainable in a post-COVID-19 world without significant changes to
          our energy mix or behaviors.

9 |   2020 World Air Quality Report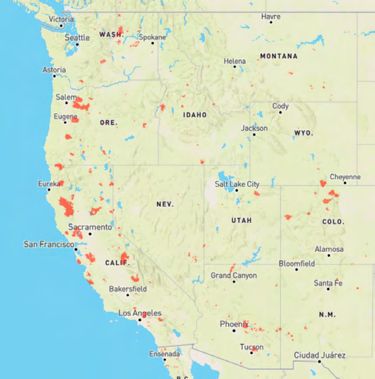
Global overview
           Global Country/Region PM2.5 Exposure

                  PM2.5
                   (µg/m³)

                   250.4

                   150.4

                    55.4

                    35.4

                    12.0
                    10.0

                                       Global map of estimated PM2.5 exposure by country/region in 2020

           Countries and regions in East Asia, Southeast Asia and South Asia suffer from the highest annual average
           PM2.5 concentration weighted by population. Notably, the Africa region has least data representation, with a
           majority of countries greyed out as a result.

10 |   2020 World Air Quality Report
World country/region ranking
Arranged by annual average PM2.5 concentration (µg/m³), weighted by population based on the available data
1 Bangladesh 77.1 37 Georgia 20.4 73 Singapore 11.8
2 Pakistan 59.0 38 Algeria 20.2 74 Lithuania 11.7
3 India 51.9 39 Madagascar 20.0 75 Latvia 11.3
4 Mongolia 46.6 40 Kosovo 20.0 76 Senegal 11.2
5 Afghanistan 46.5 41 South Korea 19.5 77 France 11.1
6 Oman 44.4 42 Chile 19.3 78 Austria 10.9
7 Qatar 44.3 43 Ukraine 19.2 79 Curacao 10.5
8 Kyrgyzstan 43.5 44 Guatemala 19.2 80 Spain 10.4
9 Indonesia 40.7 45 Mexico 18.9 81 Germany 10.2
10 Bosnia Herzegovina 40.6 46 Turkey 18.7 82 Japan 9.8
11 Bahrain 39.7 47 Italy 18.5 83 Netherlands 9.7
12 Nepal 39.2 48 Greece 18.4 84 USA 9.6
13 Mali 37.9 49 South Africa 18.0 85 Denmark 9.4
14 China 34.7 50 Peru 17.9 86 Russia 9.4
15 Kuwait 34.0 51 Macao SAR 17.8 87 Portugal 9.1
16 Tajikistan 30.9 52 Turkmenistan 17.0 88 Luxembourg 9.0
17 North Macedonia 30.6 53 Poland 16.9 89 Switzerland 9.0
18 Uzbekistan 29.9 54 Israel 16.9 90 Belgium 8.9
19 Myanmar 29.4 55 Albania 16.0 91 Ireland 8.6
20 UAE 29.2 56 Cyprus 15.8 92 United Kingdom 8.4
21 Vietnam 28.1 57 Romania 15.8 93 Costa Rica 8.2
22 Bulgaria 27.5 58 Malaysia 15.6 94 Ecuador 7.6
23 Iran 27.2 59 Colombia 15.6 95 Australia 7.6
24 Ghana 26.9 60 Hong Kong SAR 15.4 96 Andorra 7.4
25 Montenegro 26.1 61 Slovakia 15.3 97 Canada 7.3
26 Uganda 26.1 62 Taiwan 15.0 98 Iceland 7.2
27 Armenia 24.9 63 Jordan 14.9 99 New Zealand 7.0
28 Serbia 24.3 64 Ethiopia 14.7 100 Estonia 5.9
29 Saudi Arabia 23.3 65 Hungary 14.3 101 Norway 5.8
30 Sri Lanka 22.4 66 Argentina 14.2 102 Finland 5.0
31 Laos 22.4 67 Kenya 14.2 103 Sweden 5.0
32 Ivory Coast 21.9 68 Brazil 14.2 104 U.S. Virgin Islands 3.7
33 Kazakhstan 21.9 69 Angola 13.0 105 New Caledonia 3.7
34 Thailand 21.4 70 Philippines 12.8 106 Puerto Rico 3.7
35 Croatia 21.2 71 Czech Republic 12.3
36 Cambodia 21.1 72 Malta 11.8
11 | 2020 World Air Quality ReportWorld capital city ranking
Arranged by annual average PM2.5 concentration (µg/m³)
1. Delhi, India (84.1) 47. Warsaw, Poland (16.7)
2. Dhaka, Bangladesh (77.1) 48. Kuala Lumpur, Malaysia (16.5)
3. Ulaanbaatar, Mongolia (46.6) 49. Canberra, Australia (16.4)
4. Kabul, Afghanistan (46.5) 50. Tirana, Albania (16.0)
5. Doha, Qatar (44.3) 51. Bucharest, Romania (15.5)
6. Bishkek, Kyrgyzstan (43.5) 52. Nicosia, Cyprus (15.5)
7. Sarajevo, Bosnia & Herzegovina (42.5) 53. Hong Kong, Hong Kong SAR (15.4)
8. Manama, Bahrain (39.7) 54. Nairobi, Kenya (14.7)
9. Jakarta, Indonesia (39.6) 55. Addis Ababa, Ethiopia (14.7)
10. Kathmandu, Nepal (39.2) 56. Bogota, Colombia (14.3)
11. Islamabad, Pakistan (39.0) 57. Buenos Aires, Argentina (14.2)
12. Hanoi, Vietnam (37.9) 58. Bratislava, Slovakia (14.2)
13. Bamako, Mali (37.9) 59. Budapest, Hungary (13.8)
14. Beijing, China (37.5) 60. Rome, Italy (13.6)
15. Kuwait City, Kuwait (34.0) 61. Vilnius, Lithuania (13.4)
16. Dushanbe, Tajikistan (30.9) 62. Metro Manila, Philippines (13.1)
17. Skopje, North Macedonia (30.6) 63. Luanda, Angola (13.0)
18. Tashkent, Uzbekistan (29.9) 64. Taipei, Taiwan (12.6)
19. Tehran, Iran (29.0) 65. Paris, France (12.2)
20. Sofia, Bulgaria (27.5) 66. Singapore, Singapore (11.8)
21. Accra, Ghana (26.9) 67. Berlin, Germany (11.8)
22. Kampala, Uganda (26.1) 68. Riga, Latvia (11.3)
23. Yerevan, Armenia (24.9) 69. Vienna, Austria (11.0)
24. Belgrade, Serbia (24.3) 70. Prauge, Czech Republic (10.9)
25. Abu Dhabi, United Arab Emirates (23.9) 71. Moscow, Russia (10.5)
26. Santiago, Chile (23.6) 72. Tokyo, Japan (10.1)
27. Riyadh, Saudi Arabia (23.3) 73. Amsterdam, Netherlands (9.9)
28. Vientiane, Laos (22.4) 74. London, United Kingdom (9.6)
29. Colombo, Sri Lanka (22.4) 75. Copenhagen, Denmark (9.4)
30. Nur-Sultan, Kazakhstan (21.9) 76. Bern, Switzerland (9.4)
31. Abidjan, Ivory Coast (21.9) 77. Brussels, Belgium (9.3)
32. Phnom Penh, Cambodia (21.1) 78. Lisbon, Portugal (9.1)
33. Seoul, South Korea (20.9) 79. Madrid, Spain (9.0)
34. Antananarivo, Madagascar (20.7) 80. Luxembourg, Luxembourg (8.7)
35. Bangkok, Thailand (20.6) 81. Dublin, Ireland (8.6)
36. Tbilisi, Georgia (20.4) 82. Cape Town, South Africa (8.0)
37. Algiers, Algeria (20.2) 83. Quito, Ecuador (7.6)
38. Pristina, Kosovo (20.0) 84. Washington DC, USA (7.4)
39. Kyiv, Ukraine (19.2) 85. Ottawa, Canada (7.3)
40. Mexico City, Mexico (18.8) 86. Reykjavik, Iceland (7.2)
41. Ankara, Turkery (18.5) 87. Oslo, Norway (6.4)
42. Lima, Peru (18.0) 88. Tallinn, Estonia (6.2)
43. Macao, Macao SAR (17.8) 89. Wellington City, New Zealand (6.0)
10 44. Athens, Greece (17.7) 90. Helsinki, Finland (5.2)
45. Tel Aviv-Yafo, Israel (17.2) 91. Stockholm, Sweden (5.1)
46. Ashgabat, Turkmenistan (17.0) 92. Charlotte Amalie, U.S. Virgin Islands (3.8)
0 10 20 30 40 50 60 70 80 90 100 110 0 10 20 30 40 50 60 70
WHO PM2.5 Target WHO PM2.5 Target
12 | 2020 World Air Quality ReportOverview of public monitoring status
The availability of public air quality data varies considerably between cities and countries. China, Japan, and the
United States have the most comprehensive government monitoring networks that publish continuous air quality
data. Data is included in this report only if it achieved a set level of data availability, further explained on page 34.
The map below illustrates the unequal global distribution of PM2.5 air quality monitors that met data availability
requirements for 2020.
Global distribution of PM2.5 air quality monitoring stations included in this report.
Red dots indicate government stations. Blue dots indicate data from independently operated air monitors.
Populated areas that lack air quality monitoring include vast regions on the African and South American continents.
Higher-income countries tend to have more data availability and public access than lower-income countries.
For areas that lack governmental real-time air quality monitoring, lower-cost PM2.5 sensors can offer an
opportunity to accelerate access to air quality information, as they can be installed and managed with fewer
resources.
This report includes both governmental data, typically provided by reference-grade monitors, and data from low-
cost monitoring stations, all validated by IQAir’s AirVisual platform artificial intelligence.
Community-contributed monitors provide the only real-time, public air quality data for Andorra, Angola, Cambodia,
Latvia, Oman, Qatar, Senegal, U.S. Virgin Islands, and Ukraine.
13 | 2020 World Air Quality ReportEAST ASIA
China Mainland | Hong Kong SAR | Japan | Macau SAR | Mongolia | South Korea | Taiwan
PM2.5 Country/Region Ranking
(µg/m³)
1. Mongolia (46.6)
250.4
2. China Mainland (34.7)
3. South Korea (19.5)
150.4
4. Macau SAR (17.8)
55.4
5. Hong Kong SAR (15.4)
35.4
6. Taiwan (15.0)
12.0
10.0 7. Japan (9.8)
0 10 20 30 40 50 60 70 80 90 100
Available cities with real time monitoring in 2020 PM2.5 annual mean (µg/m³)
SUMMARY
33.8%
Regional cities which met the
East Asia is estimated to carry the highest regional share of glob-
20
al outdoor air pollution-related deaths (37%). Air pollution also
costs 7.5% of this region’s annual gross domestic product (GDP)
21
in welfare losses. While cities from this region comprise 42 of
WHO PM2.5 target in 2020 the 100 most polluted cities globally, PM2.5 concentrations are
trending downward overall. This improvement is attributable to
the considerable steps taken by East Asian countries to improve
air quality monitoring and pollution control. In 2020, temporary
4.8 110.2 measures established to reduce the spread of SARS-CoV-2 re-
Minami Ward, Japan Hotan, China Mainland sulted in lowered transportation emissions and some reductions
in manufacturing and industry, further reducing ambient PM2.5.
WHO Target Air pollution sources vary across the region, but the most common
10.0 12.0 35.4 55.4 150.4 250.4 PM2.5 sources include coal-based energy production, industrial
Range of annual mean PM2.5 (µg/m³) across regional cities activity, fossil-fuel based transportation, and domestic heating.
Hong Kong, Taiwan, Macao, and South Korea are additionally
impacted by transboundary pollution from regional neighbors,
Most Polluted Regional Cities Least Polluted Regional Cities as PM2.5 can travel large distances when carried by wind.
22
Rank City 2020 AVG Rank City 2020 AVG
1 Hotan, China Mainland 110.2 1 Minami Ward, Japan 4.8
2 Kashgar, China Mainland 81.0 2 Obihiro, Japan 5.6
MONITORING STATUS
3 Anyang, China Mainland 61.5 3 Minamiaizu, Japan 5.8
4 Puyang, China Mainland 59.3 4 Otaru, Japan 5.9 East Asia has a robust air quality monitoring network with some
of the best global data coverage and availability. Data in this re-
5 Hebi, China Mainland 58.9 5 Shimamoto, Japan 6.2
gion is mostly provided by governments, with China, Japan, and
6 Handan, China Mainland 58.9 6 Minamiuonuma, Japan 6.2 South Korea hosting the largest governmental networks here.
7 Aksu, China Mainland 58.4 7 Otofuke, Japan 6.2 While China has the largest monitoring network in the region,
8 8 Gero, Japan 6.2 Japan has the most granular network globally, with 30% fewer
Yuncheng, China Mainland 57.7
stations than China but distributed over a land area that is 25
Shijiazhuang, Ngari, China Mainland 6.2
9
China Mainland
57.6 9 times smaller.
Toyono, Japan 6.7
10 Shihezi, China Mainland 57.5 10
Air quality monitoring in Mongolia is growing rapidly, largely
11 Jiaozuo, China Mainland 56.2 11 Okinawa, Japan 6.7 due to non-governmental organizations and individuals whose
community-deployed sensors now supply two-thirds of nation-
12 Xingtai, China Mainland 55.9 12 Gojo, Japan 6.7
al data. Most stations here are concentrated in Ulaanbaatar,
13 Kaifeng, China Mainland 55.5 13 Shima, Japan 6.7 which has quickly become one of the most densely monitored
6.7
cities globally with 40 stations, up from 8 stations in 2018.
14 Luohe, China Mainland 55.4 14 Ebina, Japan
15 Zaozhuang, 54.8 15 Uchinada, Japan 6.7
China Mainland
14 | 2020 World Air Quality ReportCHINA MAINLAND
PM2.5 Beijing Guangzhou Chengdu
(µg/m³)
Shanghai Shenzhen Chongqing
100
250.4
90
80
70
150.4 60
50
55.4
40
30
35.4
20
10
12.0
10.0 0
2015 2016 2017 2018 2019 2020
Available cities with real time monitoring in 2020 PM2.5 annual mean (µg/m³) over 6 years
PM2.5: µg/m³ 2020 Percent of days
Annual JAN FEB MAR APR MAY JUN JUL AUG SEP OCT NOV DEC in 2020
AVG ≥ 25 µg/m³
Beijing 37.5 63.3 62.5 34.7 31.3 35.3 30.7 35.8 25.1 21.9 41.1 38.9 30.2 57.7%
Shanghai 31.5 53.1 32.4 26.3 33.0 37.9 28.8 27.2 19.9 24.9 19.7 26.7 47.1 50.3%
Guangzhou 22.6 28.8 23.2 21.3 26.2 18.3 11.4 11.5 17.0 20.4 26.8 31.0 34.7 35.8%
Shenzhen 19.0 27.0 18.7 20.5 21.7 13.1 6.6 6.8 12.1 15.5 23.8 26.7 34.2 26.5%
Chengdu 40.5 67.5 51.3 40.7 39.0 40.5 28.8 21.9 22.8 23.9 30.1 56.4 62.9 67.2%
Chongqing 31.7 48.0 48.1 36.0 32.2 27.2 20.5 15.2 17.6 18.2 25.7 36.0 56.6 56.0%
PROGRESS HOTAN, CHINA KASHGAR, CHINA
Overall, air quality in cities across China has been improving. In 2020, 86% of Chinese cities observed
cleaner air than the previous year, and average pollution exposure by population fell 11%. PM2.5 PM10 PM2.5 PM10
100%
3.8%
Long-term trends of improving air quality are attributable to China’s comprehensive air pollution policy, 7.3%
23 10.9%
updated every three years. China’s Air Pollution Action Plan for 2020 did not set tougher targets but 9.3%
16.9%
rather included more cities in the scope, requiring them to meet annual targets of < 35 μg/m³ in 2020 or 90%
9.6%
a minimum PM2.5 reduction of 18% from 2015 levels. 4.9%
China notably became the earliest epicenter of COVID-19 in 2020 and mandated rigorous lockdown measures 80% 5.9% 10.7%
to limit its spread. From January to April 2020, mobility and industry were greatly limited, resulting in some of
24
the cleanest air on record for this time period among key cities (including Wuhan and Beijing).
70% 16.0%
CHALLENGES 42.3%
19.7%
Only 2% of the 388 Chinese cities included in this report achieved the WHO annual PM2.5 target of < 10 μg/m³, 60%
50.6%
while 61% of cities met China’s national Grand II annual standard of < 35 μg/m³ (in line with the WHO
interim target 1). 50%
China remains the world’s largest producer and consumer of coal, a principal contributor to PM2.5 pollution 29.5% 29.5%
25
nationally. Although China is achieving the largest growth of any country in renewable energies, these
26
sources account for just 23% of China’s energy consumption, while coal accounts for 58%. China’s thermal 40%
27 15.5%
power plants are estimated to contribute up to 24% of PM, 39% of SO2, and 52% of NOx. Petroleum and 37.0%
other liquids are the second-largest source of energy, significantly contributing to national PM2.5 pollution.
30%
HIGHLIGHT: SANDSTORMS 21.1%
20%
29.0% 20.7%
During 2020, Xinjiang dominated China’s most polluted cities, with 4 of China’s top 10 located in this
sand- and storm-prone province that has also seen rapid increases in coal and fossil fuel emissions. The
oasis town of Hotan experienced the highest monthly PM2.5 pollution worldwide from March to June and 10%
16.8%
was China’s most polluted city from February to October. Dust storms in this region are typically most 10.5%
severe in the spring months of March and April due to weather patterns, although human influence in the 2.7%
6.0%
0%
form of land manipulation for agriculture and human-influenced climate change increasing the severity
28, 29
and frequency of droughts are also linked to more extreme dust storms. In parts of Xinjiang, dust and
30 Annual hours spent in different AQI levels
human-made pollution combine to create extreme pollution episodes.
15 | 2020 World Air Quality ReportSOUTH KOREA
PM2.5 Seoul Incheon Daejeon
(µg/m³)
Busan Daegu Ulsan
26
250.4
25
24
23
150.4 22
21
55.4
20
19
35.4
18
17
12.0
10.0 16
2017 2018 2019 2020
Available cities with real time monitoring in 2020 PM2.5 annual mean (µg/m³) over 4 years
PM2.5: µg/m³ 2020 Percent of days
Annual JAN FEB MAR APR MAY JUN JUL AUG SEP OCT NOV DEC in 2020
AVG ≥ 25 µg/m³
Seoul 20.9 28.8 28.3 24.9 20.5 19.2 20.9 13.8 15.0 10.8 17.6 24.5 27.3 30.1%
Busan 16.7 20.5 21.9 16.0 16.6 17.1 14.8 10.0 18.3 12.5 14.7 16.7 21.0 15.6%
Incheon 17.7 26.9 22.2 20.7 16.2 14.8 16.9 12.2 13.7 9.7 14.9 20.4 23.8 20.5%
Daegu 19.8 26.7 25.8 20.3 18.0 19.2 19.7 13.6 15.9 14.4 17.5 23.0 24.1 25.7%
Daejeon 16.9 25.2 22.9 19.7 17.1 15.7 17.9 8.1 9.9 10.8 16.5 19.6 20.0 19.9%
Ulsan 16.3 19.1 19.2 16.4 16.6 18.3 18.2 10.5 16.3 12.9 14.4 16.0 18.2 15.8%
PROGRESS SEOUL, SOUTH KOREA
Between 2019 and 2020, all cities in South Korea observed air quality improvements. On average, PM2.5
levels fell by 19% across South Korean cities. The country’s cleaner air is partially attributable to temporary 2016 2017 2018 2019 2020
measures established to reduce the spread of the SARS-CoV-2 virus, which restricted some transportation 100% 2.6%
4.1% 5.2% 6.0% 6.5%
and economic activity.
31 11.4%
Coal comprises half of South Korea’s energy mix and is a key contributor to ambient PM2.5. In 2019, measures 90%
15.9% 15.8% 12.4% 11.4%
were put in place to mitigate the seasonal impact of coal on air quality from December through March, including
temporarily capping or closing operations at coal-fired plants. 2020 marked the first year of that policy.
80%
Between January and March, pollution levels were down 32% compared to the same time period in 2019.
South Korea has also committed to achieving carbon neutrality by 2050, which could require all coal-fired
32 70%
power generation be replaced with renewable energy sources as soon as 2029.
CHALLENGES 60% 54.4%
Despite continued year-over-year reductions in average ambient PM2.5, none of the included cities in 51.2%
South Korea met the WHO annual PM2.5 target of < 10 μg/m³, and only 5 of 60 cities met South Korea’s 58.3% 58.4%
50%
annual PM2.5 guideline of < 15 μg/m³. Pollution levels exceeding the WHO standard are estimated to 66.0%
33
cost South Koreans an average of 1.4 years of life expectancy.
40%
The northwestern provinces of Chungcheongnam-do and Gyeonggi-do exhibit the highest pollution
levels in South Korea, claiming 15 of the country’s 20 most polluted cities due to their coal-fired power
production and manufacturing industries as well as heating and vehicular emissions. 30%
5.8% 7.2%
While transboundary air pollution accounts for 30-50% of South Korea’s ambient PM2.5, the remainder
is from national anthropogenic sources. National sources can comply with WHO standard air quality 20% 6.7% 26.7%
34 6.2%
through more stringent national policy and enforcement.
24.6%
10% 4.8% 24.4%
HIGHLIGHT: SEOUL 14.5% 17.0%
9.2%
Seoul’s 15.7% reduction in annual average PM2.5 in 2020 follows years of little change to air quality levels. 0%
This reduction is likely attributable to changes in transport emissions as a result of lockdowns as well as
new restrictions on coal-fired plants during the winter. The latter cut PM2.5 emissions from 60 coal-fired Annual hours spent in different PM2.5 pollution levels
35
plants nationwide, from 8,781 tons in December 2018 to 3,527 tons in December 2020.
16 | 2020 World Air Quality ReportSOUTHEAST ASIA
Cambodia | Indonesia | Laos | Malaysia | Myanmar | Philippines | Singapore | Thailand | Vietnam
PM2.5 Country/Region Ranking
(µg/m³)
1. Indonesia (40.8)
250.4
2. Myanmar (29.4)
3. Vietnam (28.0)
4. Laos (22.4)
150.4
5. Thailand (21.4)
55.4
6. Cambodia (21.1)
35.4 7. Malaysia (15.6)
8. Philippines (12.8)
12.0
10.0
9. Singapore (11.8)
0 10 20 30 40 50 60 70 80 90 100
Available cities with real time monitoring in 2020 PM2.5 annual mean (µg/m³)
SUMMARY
10.8%
Regional cities which met the
Southeast Asia faces air pollution challenges largely stemming
from rapid population growth and economic development. The
region’s energy demand has steeply increased as a result, with
36
electricity demand increasing at around 6% per year. The region
mostly relies on fossil fuels for energy, with oil as the leading and
WHO PM2.5 target in 2020
coal the fastest-growing source.
PM2.5 emission sources in Southeast Asia vary by country and
environment. In urban areas, dominant emission sources include
5.7 74.9 construction, industry, and transportation.
Calamba, Philippines South Tangerang, Indonesia In rural areas, a leading contributor to PM2.5 is open burning, an
agricultural practice involving setting fire to stubble to clear land
for next season’s cultivation. Agricultural burning is estimated to
WHO Target 37
contribute 5-30% of this region’s total human-made emissions.
10.0 12.0 35.4 55.4 150.4 250.4
Although most countries in the region have policies against open
Range of annual mean PM2.5 (µg/m³) across regional cities burning, there is generally poor enforcement. The transboundary
transport of air pollutants from open burning sites to neighboring
countries is also a concern in the region, especially for Singapore
and Malaysia – both experience seasonal air pollution as a result.
Most Polluted Regional Cities Least Polluted Regional Cities
Southeast Asia is also susceptible to wildfires. Deforestation and
Rank City 2020 AVG Rank City 2020 AVG
agriculture have caused large land-use changes that exacerbate
Calamba, Philippines 38
1 South Tangerang, Indonesia 74.9 1 5.7 conditions in which fires spread both in forests and peatland.
Pai, Thailand
However, the region experienced fewer fires in 2020 than in 2019
2 53.0 2 Palangkaraya, Indonesia 5.9 39
due to a wetter dry season.
3 Bekasi, Indonesia 48.1 3 Kapit, Malaysia 6.4
On a positive note, 70% of cities in Southeast Asia enjoyed im-
4 Chiang Saen, Thailand 43.7 4 Limbang, Malaysia 6.6 proved air quality in 2020. However, cities in northern Thailand
endured a severe agricultural burning season and comprised the
5 Phan, Thailand 41.6 5 Tawau, Malaysia 6.7
largest portion of cities in the region that experienced worsened
6 Saraphi, Thailand 40.5 6 Mukah, Malaysia 6.7 air quality in 2020.
7 Jakarta, Indonesia 39.6 7 7.2
MONITORING STATUS
Kota Samarahan, Malaysia
8 Hanoi, Vietnam 37.9 8 Banjarmasin, Malaysia 7.3
Despite the region’s high air pollution burden, governmental
9 San Kamphaeng, Thailand 37.8 9 Sarikei, Malaysia 7.3
monitoring in Southeast Asia is generally sparse. Roughly two-
10 Hang Dong, Thailand 36.8 10 Bongawan, Malaysia 7.6 thirds of air quality monitoring infrastructure in the region is
contributed by non-governmental organizations and individuals.
11 Ben Cat, Vietnam 36.4 11 Sri Aman, Malaysia 7.8
Thailand has the largest governmental network in the region
12 Chiang Rai, Thailand 36.3 12 Tanjong Malim, Malaysia 7.9 (158 stations) as well as the largest network of non-governmental
Pong, Thailand 35.6
stations (424 locations). In the Philippines, there are a total of 55
13 13 Putatan, Malaysia 8.3
government PM2.5 stations, the majority of which are located in
14 Si Samrong, Thailand 35.1 14 Shibu, Malaysia 8.4 the Manila metropolitan area (22 stations).
15 San Sai, Thailand 34.0 15 Bandar Penawar, Malaysia 8.7 Only non-governmental data is available in Cambodia, Myanmar,
and Laos.
17 | 2020 World Air Quality ReportINDONESIA
PM2.5 Jakarta Pekanbaru Ubud
(µg/m³)
Surabaya South Tangerang Bekasi
100
250.4
90
80
70
150.4 60
50
55.4
40
30
35.4
20
10
12.0
10.0 0
2016 2017 2018 2019 2020
Available cities with real time monitoring in 2020 PM2.5 annual mean (µg/m³) over 5 years
PM2.5: µg/m³ 2020 Percent of days
Annual JAN FEB MAR APR MAY JUN JUL AUG SEP OCT NOV DEC in 2020
AVG ≥ 25 µg/m³
Jakarta 39.6 30.9 27.0 32.9 40.3 39.8 57.9 54.4 52.4 45.3 39.0 41.3 13.7 75.1%
Surabaya 33.4 35.6 29.5 40.7 34.8 30.7 36.0 37.1 30.8 28.1 31.3 37.8 28.9 71.0%
Bekasi 48.1 42.0 36.0 42.6 53.1 48.1 68.7 62.0 57.8 51.8 40.7 25.3 7.8 82.8%
South Tangerang 74.9 53.7 46.9 53.2 72.8 73.2 97.0 101.1 98.5 89.4 -- -- -- 96.5%
Pekanbaru 24.2 25.6 31.5 34.4 29.3 23.8 27.3 25.0 23.1 16.7 18.9 15.6 19.3 40.4%
Ubud 22.2 23.2 25.5 26.8 30.6 23.6 21.7 23.1 19.9 16.3 16.0 16.7 19.7 32.5%
PROGRESS JAKARTA, INDONESIA
From 2018 to 2019, every city in Indonesia with available data observed worsened air quality. In
2016 2017 2018 2019 2020
2020, amid measures to contain the COVID-19 pandemic, annual mean PM2.5 concentrations in
100%
every city dropped compared to 2018.
8.6%
However, the country’s continued economic growth and rapid urbanization are likely to contribute to
90% 22.1% 22.6%
worsened air quality in the future unless government action is taken to further control emissions.
32.2%
Public air quality awareness in Indonesia is on the rise. From 2016 to 2020, Indonesia’s public re-
80% 22.9% 38.2%
al-time air quality monitoring network grew from a few monitors in Jakarta to 77 stations across 19
cities. Nearly half of these newly deployed air quality monitors are government-operated, while the
remainder were contributed by non-governmental individuals and organizations. 70%
CHALLENGES 32.4%
27.5%
60%
Rapid urbanization and population growth have led to increases in new construction and energy demand.
40 28.2%
Indonesia’s energy is mostly supplied by polluting fossil fuels, with oil and coal as significant contributors.
50%
Major sources of Indonesia’s air pollution include agricultural burning and wildfires. Agriculture drives 29.8%
this pollution in different ways:
53.4%
40%
• Many farmers are economically driven to agricultural burning of cropland, as it is a cheap and com-
mon method of preparing the land for the next harvest.
• Global demand for agricultural products, such as palm oil, drives deforestation and draining of land for 30% 39.7%
agriculture, exacerbating conditions for large-scale forest and peat fires to spread. 29.3%
42.7%
Agricultural land change makes typically waterlogged peat more vulnerable to fires. Peat fires are particularly 20%
41 26.7%
challenging to extinguish and cause very harmful types of air pollution.
4.2%
10%
HIGHLIGHT: JAKARTA 10.9%
3.3%
7.9% 6.7%
0% 3.4%
To slow the spread of the SARS-CoV-2 virus, Jakarta implemented a large-scale social restriction policy
42
on April 10 that closed offices, schools, and places of worship. The restrictions lasted until June 5
and correlated with observed PM2.5 reductions of 12.8% in April and 31.7% in May as compared to
Annual hours spent in different PM2.5 pollution levels
the previous year.
18 | 2020 World Air Quality ReportTHAILAND
PM2.5 Bangkok Nakhon Ratchasima Mae Hong Son
(µg/m³)
Nonthaburi Chiang Mai Khon Kaen
250.4
40
35
150.4
55.4
30
35.4
25
12.0
10.0
2017 2018 2019 2020
Available cities with real time monitoring in 2020 PM2.5 annual mean (µg/m³) over 4 years
PM2.5: µg/m³ 2020 Percent of days
Annual JAN FEB MAR APR MAY JUN JUL AUG SEP OCT NOV DEC in 2020
AVG ≥ 25 µg/m³
Bangkok 20.6 44.7 43.8 22.2 20.3 12.3 6.9 7.7 9.2 8.9 16.9 24.1 30.4 28.7%
Nonthaburi 21.1 47.3 48.1 23.5 21.1 11.9 5.2 6.4 8.0 7.7 15.7 27.1 32.6 30.1%
Nakhon Ratchasima 21.6 41.5 43.4 40.5 27.8 17.2 7.5 7.8 9.1 8.4 10.9 21.5 24.4 34.7%
Chiang Mai 30.5 42.3 57.5 94.1 66.7 20.7 6.1 6.3 9.3 10.2 9.2 18.5 26.0 39.3%
Khon Kaen 26.1 41.4 44.6 49.5 36.7 24.5 11.4 12.5 12.9 14.1 17.2 27.1 33.3 46.4%
Mae Hong Son 29.7 29.8 87.3 129.1 73.0 17.2 4.8 3.6 4.5 5.0 7.0 11.2 17.6 29.8%
PROGRESS
From 2017 to 2020, Thailand’s public air quality monitoring network has grown from 54 to 565 stations.
While the Thai government provides the region’s largest monitoring network, non-governmental contributors
operate 73% of monitoring stations nationally. Engagement around this data has increased public awareness
and promoted the importance of clean air and reduced pollution exposure.
Bangkok is home to 283 of Thailand’s air quality monitoring stations, and non-governmental data contributors
have helped provide Bangkok with the largest number of public PM2.5 stations globally. While recent im-
provements in air quality monitoring in Bangkok have coincided with air quality improvements, annual PM2.5
concentrations are still more than double the WHO annual pollution exposure target of 10 μg/m³.
CHALLENGES
In 2020, only one Thai city (Satun) was able to meet the WHO target for annual average PM2.5 con-
centration of < 10 μg/m³ and even the more lenient WHO Interim target-3 of < 15 μg/m³ was met by
only 12 cities of 106. On average, Thai cities exceed WHO targets for daily PM2.5 exposure 31% of
the year. Northern Thai cities exposed to smoke from agricultural burning carry the greatest pollution
burden, with PM2.5 concentrations 2 to 5 times the WHO target.
PM2.5 emissions from open burning practices occur primarily in Northern Thailand across Chiang
Mai, Chiang Rai, and Mae Hong Son. However, southward wind transports pollution nationwide from
January to March, increasing PM2.5 concentrations throughout the country. In 2020, the northern
cities of Pai, Chiang Saen, and Phan experienced the most extreme pollution of the year (average of
> 150 μg/m³) during March, correlating with widespread fires across Southeast Asia during the agricultural
43
burning season. Other sources of PM2.5, particularly in urban areas, include fuel-powered trans-
44
port, industry, and construction.
HIGHLIGHT: OPEN BURNING PRACTICES
In Northern Thailand, air pollution is largely related to agricultural burning practices used in maize
45
farming. Maize’s cash crop status has resulted in illegal land conversion of the forested areas as
well as year-over-year increases in the land size area of satellite-observed burn scars in the Mekong
Basin, from 14.7% in 2015 to 24.4% in 2019. During the peak burning season in March and April, air
pollution averages “very unhealthy” levels as defined by the US AQI. Map of acreage burned in 2020
19 | 2020 World Air Quality ReportVIETNAM
PM2.5 Hanoi Ho Chi Minh City Ha Tinh
(µg/m³)
Hue Da Nang Ben Cat
50
250.4
40
150.4
30
55.4
35.4 20
12.0
10.0 10
2016 2017 2018 2019 2020
Available cities with real time monitoring in 2020 PM2.5 annual mean (µg/m³) over 5 years
PM2.5: µg/m³ 2020 Percent of days
Annual JAN FEB MAR APR MAY JUN JUL AUG SEP OCT NOV DEC in 2020
AVG ≥ 25 µg/m³
Hanoi 37.9 49.8 62.8 45.4 43.4 34.5 27.5 23.9 23.3 27.9 27.4 39.7 50.5 69.4%
Ho Chi Minh City 22.0 32.6 27.2 16.1 19.9 15.0 22.5 19.6 16.3 20.6 19.7 28.5 26.4 34.4%
Da Nang 14.8 18.6 17.5 18.4 13.8 13.7 12.2 11.2 9.4 13.4 12.8 18.7 17.8 6.6%
Hue 24.2 26.7 26.4 38.8 36.6 39.5 10.6 8.7 9.7 14.5 19.1 28.9 32.9 37.2%
Ha Tinh 33.4 43.7 46.1 51.3 47.7 31.2 10.1 11.8 9.9 20.5 25.5 43.5 60.5 55.2%
Ben Cat 36.4 47.7 42.9 33.2 31.5 31.1 38.2 39.4 27.1 -- -- 41.0 31.2 77.0%
PROGRESS HANOI, VIETNAM
Vietnam’s air quality monitoring network nearly doubled between 2019 and 2020, growing from 54 monitoring 2016 2017 2018 2019 2020
stations across 4 cities to 90 stations across 24 cities. This achievement is attributable to gains in both gov- 100%
ernmental and non-governmental air quality monitoring, which contributed 67 and 51 stations, respectively. 2.6%
In 2020, the average pollution exposure in Vietnam fell by 18% from 2019 levels. Strict measures to 15.3%
90% 20.3%
reduce the spread of SARS-CoV-2, including mass quarantines, a 1-month nationwide lockdown, and 20.2% 24.8%
restrictions on mass gatherings and mobility, have contributed to an 8% reduction in PM2.5 in 2020, 31.4%
46
based on de-weathered data analysis in Hanoi. 80%
In 2019, Can Tho became the first Vietnamese city to join the worldwide BreatheLife Network and to commit
to reaching WHO air quality guidelines for PM2.5 and other pollutants by 2030. With this commitment, 27.1%
70%
Vietnam’s 4th largest city set an air quality control precedent for other Vietnamese cities to follow.
47 17.4% 25.6%
CHALLENGES 60%
33.0%
26.9%
Air pollution remains a major environmental health threat in Vietnam. The WHO estimates that as many 50%
48
as 60,000 deaths in Vietnam were caused by air pollution in 2016.
While gains in air quality monitoring have helped raise awareness, most cities still lack public real-time 40%
data. In rural areas, the impact of open burning rice straw and other biomasses for heating and cooking 45.5%
remains largely unmitigated.
30% 45.9% 54.0%
Rapid urbanization and a growing economy also contribute to ambient PM2.5 levels. Without additional
49
policy measures, PM2.5 concentrations in Vietnamese cities may increase as much as 20-30% by 2030. 34.0%
20% 40.2%
HIGHLIGHT: HANOI
10% 4.7%
Hanoi’s average annual PM2.5 concentration improved in 2020 following 3 consecutive years of
worsening conditions. Despite improvements, air quality within the capital remains nearly 4 times the 8.5%
4.1%
WHO target for annual exposure (10 μg/m³), exceeding the air pollution levels of Beijing, China for the 0%
second consecutive year. Annual hours spent in different PM2.5 pollution levels
20 | 2020 World Air Quality ReportCENTRAL & SOUTH ASIA
Afghanistan | Bangladesh | India | Iran | Kazakhstan | Kyrgyzstan | Nepal | Pakistan | Sri Lanka
Tajikistan | Turkmenistan | Uzbekistan
PM2.5 Country/Region Ranking
(µg/m³)
1. Bangladesh (77.1)
250.4
2. Pakistan (59.0)
3. India (51.9)
4. Afghanistan (46.5)
5. Kyrgyzstan (43.5)
150.4
6. Nepal (39.2)
7. Tajikistan (30.9)
55.4
8. Uzbekistan (29.9)
35.4 9. Iran (27.2)
10. Sri Lanka (22.4)
12.0 11. Kazakhstan (21.9)
10.0
12. Turkmenistan (17.0)
0 10 20 30 40 50 60 70 80 90 100
Available cities with real time monitoring in 2020 PM2.5 annual mean (µg/m³)
SUMMARY
1.6%
Regional cities which met the
South Asia has some of the world’s worst air quality on record,
with 37 of the world’s 40 most polluted cities in 2020. An
estimated 13-22% of deaths in this region are linked to the
health effects of air pollution exposure, with associated
50, 51
WHO PM2.5 target in 2020 estimated costs equating to 7.4% of the region’s GDP.
India, Pakistan, and Bangladesh generally experience the worst
air quality in this region, with 32%, 67%, and 80% of cities averaging
a US AQI measurement of “Unhealthy” (> 55.5 μg/m³), respectively.
8.6 106.6 Several improvements in air quality were observed in the region
Digana, Sri Lanka Ghaziabad, India during 2020. The 25 most polluted cities in this region with
historical data demonstrated either reductions from 2019
WHO Target PM2.5 levels or an overall downward trend over the past 4 years.
10.0 12.0 35.4 55.4 150.4 250.4 In 2020, 5 of 7 capital cities observed reductions in PM2.5, with
Range of annual mean PM2.5 (µg/m³) across regional cities the greatest reductions seen in Kabul (-21%), Kathmandu (-18%)
and Delhi (-15%). Meanwhile, Tehran (+12%) and Islamabad
(+11%) experienced increases in 2020, and only 3 South Asian
cities, located in Iran and Sri Lanka (Digana, Sanandaj and
Most Polluted Regional Cities Least Polluted Regional Cities Dambulla), achieved WHO annual targets.
Rank City 2020 AVG Rank City 2020 AVG Key trends contributing to South Asia’s air pollution include
Ghaziabad, India Digana, Sri Lanka 8.6
urbanization, economic growth, and industrialization. Common
1 106.6 1
sources of air pollution include biomass burning (especially
2 Bulandshahr, India 98.4 2 Sanandaj, Iran 9.6 for cooking in rural areas), burning of fossil fuels, dust from
construction and vehicles, and agricultural burning (which can
3 Bisrakh Jalalpur, India 96.0 3 Dambulla, Sri Lanka 9.8 52
cause transboundary air pollution issues within the region).
4 Bhiwadi, India 95.5 4 Semnan, Iran 10.6
MONITORING STATUS
5 Noida, India 94.3 5 Ratnapura, Sri Lanka 12.9
6 Greater Noida, India 89.5 6 Ashgabat, Turkmenistan 17.0
India, Iran, and Nepal are still the only South Asian countries
7 Kanpur, India 89.1 7 Satna, India 17.2
with domestic government monitoring networks reporting
8 Lucknow, India 86.2 8 Mysuru, India 17.2 real-time data to the public. However, data coverage from
governmental networks and non-governmental low-cost
9 Delhi, India 84.1 9 Tabriz, Iran 17.6 sensor networks is growing. In 2020, 55 additional cities
10 Faridabad, India 83.3 10 Arak, Iran 18.2
were monitored compared to 2019. Given the severity of
air pollution within this region, more real-time monitoring is
11 Meerut, India 82.3 11 Yazd, Iran 18.5 needed to enable more people to respond and protect their
health.
12 Jind, India 81.6 12 Hamedan, Iran 18.8
13 Hisar, India 81.1 13 Kochi, India 19.0
14 Agra, India 80.2 14 Meybod, Iran 19.2
15 Manikganj, Bangladesh 80.2 15 Kerman, Iran 19.8
21 | 2020 World Air Quality ReportINDIA
PM2.5 Delhi Bengaluru Chennai
(µg/m³)
Mumbai Hyderabad Kolkata
120
250.4
110
100
90
150.4 80
70
55.4
60
50
35.4
40
30
12.0
10.0 20
2015 2016 2017 2018 2019 2020
Available cities with real time monitoring in 2020 PM2.5 annual mean (µg/m³) over 6 years
PM2.5: µg/m³ 2020 Percent of days
Annual JAN FEB MAR APR MAY JUN JUL AUG SEP OCT NOV DEC in 2020
AVG ≥ 25 µg/m³
Delhi 84.1 128.1 99.8 54.8 53.6 55.2 52.5 42.0 35.5 58.9 128.0 143.6 157.3 90.2%
Mumbai 41.3 68.8 73.3 46.2 31.6 20.6 15.9 18.6 20.0 24.7 42.1 63.8 70.6 63.9%
Bengaluru 27.5 36.5 35.9 30.4 26.0 22.7 19.9 18.4 22.4 21.3 32.0 27.2 37.1 46.7%
Hyderabad 34.7 46.4 42.0 33.6 31.1 32.1 23.5 21.9 19.7 23.5 44.9 39.9 57.8 61.7%
Chennai 26.5 36.5 31.1 26.7 14.4 17.8 18.9 22.7 24.8 24.1 34.2 25.9 40.1 51.6%
Kolkata 46.6 79.9 66.9 47.2 29.3 26.2 24.8 24.7 26.3 27.9 38.9 65.7 101.3 49.2%
PROGRESS
India showed an overall improvement in several cities, with 63% reporting direct improvements over
2019 averages. All cities whose pollution levels increased in 2020 still show an overall downward trend
from 2018 and earlier.
Progress is only marginally attributable to India’s flagship National Clean Air Programme (NCAP) introduced
in January 2019, which targets PM2.5 reductions between 20-30% in 122 selected cities by 2024 from a
53
2017 baseline. Officials cite the pandemic as part of the reason for the program’s slow implementation.
CHALLENGES
Despite widespread air quality improvements during 2019 and 2020, air pollution in India is still danger-
ously high. India continues to dominate annual PM2.5 rankings by city – 22 of the top 30 most polluted
cities globally are located in India.
Major sources of India’s air pollution include transportation, biomass burning for cooking, electricity genera-
tion, industry, construction, waste burning, and episodic agricultural burning. Transportation constitutes one
54
of India’s leading PM2.5 emission sources, responsible for emitting pollutants and resuspending road dust.
Biomass cookstoves are the main source of indoor pollution nationally, particularly affecting women
and children. While India promotes access to fuels which emit less particulate pollution like liquefied
gas and increases the share of clean energy extending electricity access across the country, coal
55, 56
remains the major domestic source of India’s energy supply.
HIGHLIGHT: AGRICULTURAL BURNING
In India’s Punjab and Haryana province, open burning practices have provided a means for quickly and
57
affordably transitioning fields from the summer rice crop to the winter wheat crop. During 2020, there
58
was a record number of stubble-burning incidents in Punjab (76,537), increasing 46.5% over 2019. In
order to reduce agricultural burning, the government should provide viable alternative solutions.
Delhi, the world’s second most populous city, is located southeast of India’s agricultural breadbasket, where
open burning is common. It is estimated that as much as 20 to 40% of Delhi’s air pollution originates from
59
Punjab farm fires. During peak burning season, Delhi experienced average PM2.5 levels of 144 μg/m³ in No-
Map of acreage burned in 2020
vember and 157 μg/m³ in December, exceeding the WHO’s annual exposure guideline by more than 14 times.
22 | 2020 World Air Quality ReportYou can also read