2021
Results of the Urban Kingston
Point-in-Time Count
←
→
Page content transcription
If your browser does not render page correctly, please read the page content below

2021 Results of the Urban Kingston Point-in-Time Count
Results of the Urban Kingston 2021 Point-in-Time Count

Acknowledgments
Partners                                                    Advisory Committee

-   City of Kingston                                        -   Reaching Home: Canada’s
-   Housing & Homelessness Service                              Homelessness Strategy Community
    Providers                                                   Advisory Board
-   Emergency Services, Detox Kingston                      -   Emergency Shelter and Transitional
-   Kingston Health Sciences Centre                             Housing Service Providers
-   Kingston Police

United Way of KFL&A would like to acknowledge this                          Project Team
traditional territory’s longer existence and its significance for           -   United Way,
the Indigenous people who lived and continue to live on                         Kingston Frontenac,
Turtle Island.                                                                  Lennox & Addington
We are situated on traditional Anishinaabe and                              -   City of Kingston
Haudenosaunee land. There are Métis and other non-status
First People from many Indigenous Nations present in our
community today. This acknowledgement symbolizes the
United Way KFL&A’s first step of many, along this path
toward Indigenous reconciliation, in a respectful manner.

            This project is funded by the Government
            of Canada’s Reaching Home: Canada’s
            Homelessness Strategy

                                                                                           Page | 1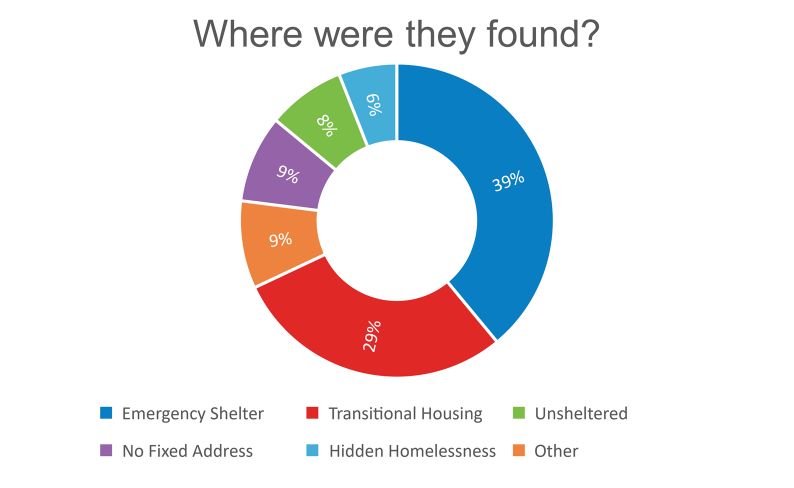
Results of the Urban Kingston 2021 Point-in-Time Count

Table of Contents
Key Findings ................................................................................................................................................ 3
Overview ...................................................................................................................................................... 4
   2021 PiT Count Background ..................................................................................................................... 4
   Enumeration & Survey Highlights ............................................................................................................. 6
   Housing and Homelessness Updates ..................................................................................................... 10
   PiT Count Methods.................................................................................................................................. 13
   PiT Count Limitations .............................................................................................................................. 14
Results ....................................................................................................................................................... 15
   Homeless Populations & Absolute Homelessness ................................................................................. 15
   Precarious Housing ................................................................................................................................. 16
    Shelter Occupancy ................................................................................................................................. 16
Survey Demographics .............................................................................................................................. 17
   Gender .................................................................................................................................................... 17
   Age .......................................................................................................................................................... 18
   Indigenous Identity .................................................................................................................................. 18
   Racial Identity .......................................................................................................................................... 18
   Immigrant / Refugee Status…………………………………………………………………………………….19
   Language ................................................................................................................................................ 19
   Sexual Orientation ................................................................................................................................... 19
   Veteran Status......................................................................................................................................... 19
   Foster Care ............................................................................................................................................. 19
   Physical and Mental Health ..................................................................................................................... 20
Experiential Survey Data .......................................................................................................................... 21
    Sleeping Arrangements ......................................................................................................................... 21
    Duration of Homelessness ..................................................................................................................... 21
    Age of First Episode ............................................................................................................................... 22
    Service Usage ........................................................................................................................................ 23
    Geography ............................................................................................................................................ 24
    Reasons for Housing Loss ..................................................................................................................... 25
    Sources of Income ................................................................................................................................. 26
    Level of Education ................................................................................................................................. 26
    Barriers to Housing ................................................................................................................................ 27
Youth-Specific Data and Demographics................................................................................................. 28
2018-2021 Comparative Data ................................................................................................................... 33
Conclusion ................................................................................................................................................. 40

                                                                                                                                                     Page | 2
Results of the Urban Kingston 2021 Point-in-Time Count
Key Findings of the 2021 Urban
Kingston Point-in-Time Count
The perspectives of people More youth were living in
experiencing hidden transitional housing (23)
homelessness were better than in 2018 (22) and 2016
captured in 2021 than in (17) and more youth were in
the previous 2018 and 2016 shelter (19) than in 2018
counts. (13) and 2016 (4).
A smaller percentage of Slightly fewer people were
people indicated that they unsheltered and sleeping
had multiple episodes of rough on the night of the
homelessness in 2021 count in 2021 (8%)
(18%) than in 2018 (27%) compared with 2018 (9%)
and 2016 (28%). and 2016 (15%).
Page | 3Results of the Urban Kingston 2021 Point-in-Time Count
Results of the 2021 Urban
Kingston Point-in-Time Count
Overview of 2021 Point-in-Time Count
On April 14, 2021, United Way KFLA, through a grant from Employment and Social Development
Canada’s Reaching Home: Canada’s Homelessness Strategy (RH), conducted a coordinated
Point in Time (PiT) Homeless Count in urban Kingston as part of the nationally coordinated PiT
count.
Background
A Point-In-Time (PiT) Homeless Count is a snapshot of individuals and families experiencing
homelessness that collects numerical and basic demographical information at a single point in
time. There are two primary purposes of conducting a PiT count:
A count of people experiencing absolute homelessness: It is intended to identify how many
people in a community experience homelessness in shelters and on the streets at a given time.
Conducted over several years, PiT Counts can be used by the community to track progress in
reducing homelessness.
A survey of the homeless population: Through an accompanying survey, the Count gives the
community information on the demographics and service needs of their homeless population. This
information can be used to target community resources to where they are most needed. 1
By comparison, a unique identifier list, or By Name List, is a registry process that collects real-
time, person-specific data that tracks monthly inflow and outflow measures of homelessness. This
data is much more specific and actionable for homeless individuals than the general, anonymous
data collected by the PiT Counts, which is “valuable for policy making and research.” 2
Individuals enumerated in the PiT Count included those staying in emergency shelters, domestic
violence shelters, transitional housing, service hubs, police custody, detox programs, hospitals
and those staying outdoors in parks, makeshift shelters, on the streets, and in other public areas.
A PiT Count is the best available method of obtaining an accurate picture of the number of people
experiencing homelessness in urban centres, but its limitations must be considered.
For example, a PiT Count is unable to capture all of those persons experiencing hidden
homelessness, who may be staying at a friend’s house or living in a motel room. Additionally, the
1 Employment and Social Development Canada, “Everyone Counts: A Guide to Point-In-Time Counts in Canada”
2Canadian Alliance to End Homelessness, “Why real-time data is the foundation for ending
homelessness”, May 19, 2018
Page | 4Results of the Urban Kingston 2021 Point-in-Time Count
unsheltered count traditionally relies on volunteers to find those experiencing homelessness in
public areas, and some who may not appear to be homeless, who are well-hidden, or who are
actively avoiding being counted may be missed. All PiT counts, due to their inherent limitations,
underrepresent the total number of people experiencing homelessness in a given community. The
findings from this PiT count should therefore be considered the minimum number of people that
were homeless in Kingston on the night of April 14, 2021.
Through a grant from ESDC’s Reaching Home: Canada’s Homelessness Strategy (RH), United
Way KFL&A conducted Kingston’s fourth PiT homeless count as part of the third nationally
coordinated count on the evening of April 14, 2021. The nationally coordinated PiT Count is
normally scheduled to take place bi-annually, however, due to the COVID-19 pandemic, many
communities, including Kingston, were unable to conduct the Count in 2020. Most communities
opted to postpone their counts until the following spring, in 2021, to capture more comparable
results in terms of the time of year, as weather conditions can impact where those experiencing
homelessness may be found.
On April 14, 2021, while the COVID-19 pandemic was still present, the Kingston PiT Count was
able to proceed through a modified process to ensure the health and safety of our community.
Shelter occupancy totals were obtained from the Homeless Individuals and Families Information
System (HIFIS), a city-wide database used by homelessness service providers in KFL&A to track
demographics and services accessed by people experiencing homelessness. Surveys were
administered at shelters and transitional housing units, data was collected from institutions, and
a limited outdoor enumeration and surveys were conducted to obtain demographic and
experiential data.
United Way KFLA had a dedicated PiT Count Coordinator who provided support to the planning
phase of this initiative and was responsible for the implementation of the 2021 Urban Kingston
Point in Time Count. United Way coordinated with frontline service providers within the
homelessness services system to conduct both the enumeration and survey components for the
count. Staff in 5 emergency shelters, 8 transition houses, 2 service ‘hubs’, and Street Outreach
workers conducted interviews with clients and residents to provide survey data from these
individuals on the night of the count.
To conduct the street portion of the count, a street outreach team of frontline staff enumerated
and surveyed individuals only in areas they knew that people experiencing homelessness are
usually found. A screening tool was used to determine whether individuals were experiencing
homelessness and consent was obtained to proceed with conducting the survey. If the person
was not homeless, the survey was discontinued, and the interaction was recorded on a tally sheet.
If any person declined to participate in the survey, perceived evidence and information that the
person was experiencing homelessness (i.e., carrying bag of belongings, sleeping bag, blankets,
sleeping on a bench or vehicle, etc.) was recorded as “observed homeless” on a tally sheet.
In the past, the City of Kingston, as Service Manager for the County of Frontenac, has conducted
a separate enumeration of people living in rural areas of our community who were currently
Page | 5Results of the Urban Kingston 2021 Point-in-Time Count
homeless or experiencing housing vulnerability to better understand the extent of challenges
associated with rural homelessness. These enumerations were conducted in 2016 and 2018, with
a separate report developed by the City of Kingston on the findings of the 2018 rural
homelessness study. Due to the COVID-19 pandemic, the separate rural homelessness count
was not conducted in 2020 or 2021.
Enumeration Highlights
Absolute homelessness refers to those individuals who are unsheltered or “sleeping rough,” and
those who are emergency sheltered. Employment and Social Development Council defines
emergency shelters as:
Facilities providing temporary, short-term accommodation for homeless individuals and families.
This may or may not include other services such as food, clothing or counselling. 3
The Reaching Home Strategy defines transitional housing as:
Housing intended to offer a supportive living environment for its residents, including offering them
the experience, tools, knowledge and opportunities for social and skill development to become
independent. It is considered an intermediate step between emergency shelter and supportive
housing, and has limits on how long an individual or family can stay. Stays are typically between 3
months and 3 years. 4
The Canadian Observatory on Homelessness defines homelessness as “the situation of an
individual or family without stable, permanent, appropriate housing, or the immediate prospect,
means and ability of acquiring it. Homelessness describes a range of housing and shelter
circumstances, with people being without any shelter at one end, and being insecurely housed at
the other.” 5
134
Number of people experiencing absolute homelessness
found in Kingston in 2021, as compared to 81 in 2018.
207
Total number of people encountered who were homeless
in Kingston in 2021, as compared to 152 in 2018.
3Employment and Social Development Canada, “Shelter Capacity Report 2015”
4 Employment and Social Development Canada, “Reaching Home: Canada’s Homelessness Strategy Directives”
5 Canadian Observatory on Homelessness, “Canadian Definition of Homelessness”
Page | 6Results of the Urban Kingston 2021 Point-in-Time Count
On the night of April 14, 2021, 134 people were found to be absolutely homeless. These
individuals were staying in an emergency or overflow shelter, domestic violence shelter, an
institution, service hub or in public spaces on the night of the count. Also included are people that
were either unknown by the enumerator where they would be staying the night of the count, or
respondents were unsure of where they were staying or declined to answer.
An additional 60 individuals were staying in transitional housing, including 5 children.
A total of 13 survey respondents who did not have a permanent residence were sleeping at a
motel or at someone else’s place. These individuals are considered to be a part of the hidden
homeless population, as they lack permanent housing but often do not interact with the
homelessness system and service providers.
A total of 207 people encountered on the evening of April 14, 2021 were experiencing
homelessness. Of these, 67% were adults, 26% were youth ages 16-24 and 7% were children.
52% were identified as male, 40% as female, and 3% identified as transgender or non-
binary/gender non-conforming. 5% are listed as gender unidentified.
As is the case with any homeless count, this should be considered the minimum number of people
experiencing homelessness on that night. Those who are precariously housed, living in motels,
or “couch-surfing” may not all be captured.
Page | 7Results of the Urban Kingston 2021 Point-in-Time Count
Survey Highlights
Of the 207 people counted on the night of April 14, 2021, meeting the criteria of the Canadian
definition of homelessness, 176 individuals agreed to participate in brief surveys in order to
capture demographic and experiential data.
The statistics that follow represent those 176 people who were surveyed.
40% identify as women
Kingston has a high rate of female homelessness than other Canadian cities. Female
homelessness in Canada was 36% based on the 2018 National PiT Count.
4% identify as transgender or non-
binary/genderqueer
A large proportion were youth aged 16-24.
31% identify as Indigenous
In Kingston, people who are indigenous make up approximately 3.4% of the city’s
population.
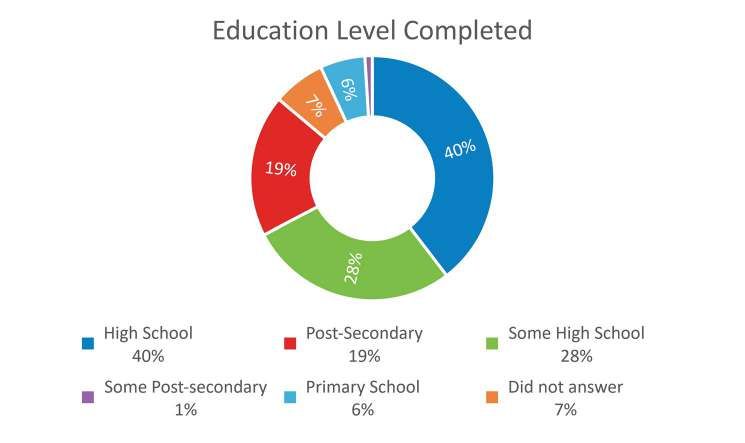
75% are sheltered
37% were found in emergency or domestic violence shelters, 29% were living in
transitional housing, 3% were staying at a motel/hotel, and 6% were couch surfing.
270 days
The median length of time people spent homeless within the past year
230 days
The average length of time people spent homeless within the past year
37 years old
The average age of people experiencing homelessness
58% are chronically homeless
Over half of respondents have been homeless for 6 months or more in the past year.
Page | 8Results of the Urban Kingston 2021 Point-in-Time Count
18% are episodically homeless
Almost one sixth of respondents have been homeless 3 or more times in the past year
80% receive income assistance
Provincial Disability or Social Assistance benefits are the main sources of income for
people experiencing homelessness.
53% say they don’t have enough income to
afford housing
53% say rents are too high to be affordable; 31% say housing is not available.
9 families
9 families were found homeless, including 16 children.
Population Percent
Male 51%
Female 40%
Transgender 3%
Indigenous Identity 31%
Chronically Homeless 58%
Episodically homeless 18%
Children (0-15) 7%
Youth (16-24) 26%
Adults (25-64) 65%
Seniors (65+) 4%
Page | 9Results of the Urban Kingston 2021 Point-in-Time Count
Housing and Homelessness in Kingston
Since 2013, there have been significant changes to the City of Kingston’s approach to housing
and homelessness. These shifts in strategic direction and service provision align with the City of
Kingston’s 10-Year Municipal Housing & Homelessness Plan, adopted in 2013.
The City has adopted a Housing First approach to address the most vulnerable populations
experiencing chronic homelessness. Housing First is defined as:
A specific type of intervention which seeks out homeless people that have complex and co-
occurring issues and serves those with the highest acuity first with minimal pre-conditions, such as
“housing readiness”. The only real expectation that the person agrees to before starting the
program is to have their support workers visit them in the home, to pay rent on time, and to work
hard to avoid disrupting others that might lead to eviction. 6
As of December 31, 2018, there were 1317 households on the City’s Social Housing centralized
waitlist and 149 households were housed from the waitlist throughout 2018. 7 The waitlist reached
a high of 1344 in December of 2019, but dropped to its lowest number in several years, to 1109
in 2020, due to new program options being added to the Social Housing portfolio. 8
# of applicants housed from
Year # of households on waitlist
waitlist
2020 1109 150
2019 1344 176
2018 1317 149
2017 1303 185
2016 1115 168
1109
Number of households on the social housing waiting list
as of December 31, 2020.
150
Number of households housed from the social housing
waitlist in 2020.
6 City of Kingston Housing and Social Services Department, “10-Year Municipal Housing &
Homelessness Plan”
7 City of Kingston Housing and Social Services Department, “City of Kingston & County of Frontenac
2018 Housing & Homelessness Report”
8 City of Kingston Housing and Social Services Department, “City of Kingston Housing and Social
Services Report 2020”, 36.
Page | 10Results of the Urban Kingston 2021 Point-in-Time Count
Vacancy Rate By Year
2.8% 3.2%
4 2.6%
1.9%
2 0.7% 0.6%
0
2015 2016 2017 2018 2019 2020
Vacancy Rate
While a healthy vacancy rate is 3%, Kingston’s vacancy rate has fluctuated over the last several
years. In 2015 the vacancy rate was 2.8%, in 2016 it dropped slightly to 2.6%, and in 2017 it was
the lowest in Ontario at 0.7%. It dropped again in 2018, to 0.6%. In 2019 we saw the vacancy rate
increase to 1.9%, and again in 2020 to 3.2%; however, this was not followed by a decrease in
rental prices. 9
The average market rent in Kingston in 2017 and 2018 was higher than the average for
communities of similar size and rental rates are disproportionate to the housing allowances for
social assistance. 10 By early 2020, the average monthly rent had increased to around $1,101
then up to $1,145 by year’s end. 11
Max shelter
Avg monthly rent Max shelter allowance allowance for a
Year for for a couple on Ontario couple on Ontario
1bdrm apartment Works (OW) Disability Support
Program (ODSP)
2020 $1,145 $642 $781
2019 $1,101 $642 $781
2018 $1,008 $642 $781
2017 $975 $632 $769
2016 $942 $609 $753
2015 $921 $602 $753
There have also been changes to the shelter system since 2018. During an operational review of
homeless services beginning in August 2017, the Elizabeth Fry Society notified the City of
Kingston that it no longer had the capacity to run the emergency shelter program, but agreed to
deliver the program until April 30, 2018 to ensure continuation of services specific to women.
The Elizabeth Fry Society of Kingston’s 8-bed shelter for women closed in May 2018.
9 Alexandra Mzur, Global News, “Kingston’s Vacancy rate jumps to 1.9 percent but rents continue to
skyrocket: CMHC.” 2020; City of Kingston, “Kingston’s vacancy rate increases to 3.2 per cent.”
10 City of Kingston Housing and Social Services Department, “City of Kingston & County of Frontenac
2017 Housing & Homelessness Report”; “City of Kingston & County of Frontenac 2018 Housing &
Homelessness Report”
11 City of Kingston Housing and Social Services Department, “City of Kingston Housing and Social
Services Report 2020”, 41.
Page | 11Results of the Urban Kingston 2021 Point-in-Time Count
An RFI was issued for the provision of emergency shelter beds for vulnerable women, and
Kingston Home Base Non-Profit Housing was selected to operate 6 women’s emergency shelter
beds. These beds are co-located at In From the Cold, Home Base Housing’s co-ed adult
emergency shelter, with renovations completed to provide a segregated women-only space for
these clients. These beds became operational on May 1, 2018.
At the time of the Point in Time Count, the number of emergency shelter beds in Kingston was
67, down from 96 in 2018. Overall shelter capacity was down to 71% of the pre-COVID capacity
of 94 beds. An additional 6-bed Overflow shelter, operated by the Kingston Youth Shelter at their
Brock Street location, was opened in December 2020 to address the reduction of beds at the
adult shelter. The Kingston Youth Shelter relocated during the pandemic to a building that could
accommodate social distancing and they also increased their capacity to take in high acuity youth.
In response to the COVID-19 pandemic, the increase in need of the communities most
vulnerable, and the awareness of gaps in services, the Integrated Care Hub (ICH) was opened.
The Hub is a full-service hub for vulnerable populations, primarily for those experiencing
homelessness. This site offers a meal program, counselling, crisis support, overnight spaces, a
safe consumption site and access to a registered nurse and some healthcare services. It also
offers opportunities to connect to housing services with other community partners. The ICH is
operated by HIV/AIDS Regional Services (HARS) Kingston and Street Health and is funded by
the City of Kingston and United Way KFLA.
The Street Outreach program at Home Base Housing was expanded during the pandemic to
cover 7 days a week with multiple partners.
In 2020, the City of Kingston Housing and Social Services Department and the Housing and
Homeless system worked to implement the By-Name List, a unique-identifier list which gathers
real time data on those experiencing homelessness in Kingston. This Built For Zero Canada
initiative serves to “better support individuals and understand the system of care”. 12 The
community met the criteria for Quality By-Name List status in 2020 and will utilize this data to
identify and address gaps and challenges in service delivery, as well as highlight what the system
is doing well.
12City of Kingston Housing and Social Services Department, “City of Kingston Housing and Social
Services Report 2020.”
Page | 12Results of the Urban Kingston 2021 Point-in-Time Count
Methods
To ensure a more accurate number and utilize resources most efficiently, the following techniques
were used to enhance data quality:
1. Obtaining shelter occupancy totals from the City of Kingston’s Homeless Individuals
and Families Information System (HIFIS), a city-wide database used by homelessness
service providers in KFL&A to track demographics and services accessed by people
experiencing homelessness.
2. Engaging with the Street Outreach Team through Home Base Housing, to identify
specific “hot spots” such as camp sites, abandoned buildings, and forested areas
where homeless individuals are known to be, and enumerate and survey individuals
in these areas as the team is familiar with those who are often found there.
3. Working with staff at shelters, transitional housing programs, and service hubs to
enumerate and survey individuals staying at these locations.
4. Gathering counts from institutions such as hospitals, detox, police regarding
individuals with no fixed address.
During the planning stages, the PiT Count Coordinator worked to engage the local community
and the homelessness services sector. The United Way Reaching Home: Canada’s
Homelessness Strategy (RH) Community Advisory Board (CAB) acted as the oversight
committee.
The Coordinator worked with frontline agency staff to develop the survey, identify the sheltered
and unsheltered count locations and logistics for agencies and institutions to conduct the Count.
Following the Count, the Coordinator oversaw data cleaning, data entry into HIFIS, and the
analysis of results.
The PiT Count survey included 15 core questions recommended by the Canadian Observatory
on Homelessness (COH), as well as several of the sub-set questions from the same source.
Additional community questions were added in consultation with key stakeholders. Follow-up
meetings were scheduled with shelter and transitional housing providers and community agencies
to seek their feedback on questions and methodology and to engage them in the PiT Count
process. As a result, many frontline staff agreed to take part in the PiT Count. This facilitated the
implementation of the plan, despite the COVID-19 pandemic.
Due to the COVID-19 pandemic, in keeping our local Public Health guidelines and restrictions,
community volunteers were not asked to participate in the 2021 PiT Count, as they have in
previous years. For the street count portion of the count, we relied on Home Base Housing’s
Street Outreach team, who have experience with the homeless population and having knowledge
of where those experiencing homelessness can be found, particularly those that are unsheltered
or ‘sleeping rough’.
Page | 13Results of the Urban Kingston 2021 Point-in-Time Count
Each surveyor was given a tally sheet on which they listed their name and indicated the location
for which they were responsible. Surveys were numbered so that they could be matched with the
corresponding surveyor and tally sheet. These were reviewed to detect and correct omissions
and inaccuracies (i.e. if the question “Where are you staying tonight?” was left blank, but the
survey was conducted at an emergency shelter, “Emergency Shelter / Domestic Violence Shelter”
was assumed during the data cleaning process).
Of the 207 people counted, 176 (aged 16 and over) consented to participate in the survey.
Respondents could end their participation at any time or could opt out of any question(s) in the
survey. The demographic and experiential results in this report reflect the data collected through
the 176 survey respondents. Individuals who elected to participate in the survey were offered an
honorarium consisting of a dry bag that contained a grocery gift card.
Limitations
Though a Point-in-Time Count is the most comprehensive methodology for enumerating and
facilitating the collection of data on people experiencing homelessness, its limitations must be
considered in full. When conducted over several years, PiT Counts can be used to measure
community progress in reducing homelessness.
By focusing on a single day, the count will not include some people who cycle in and out of
homelessness. What it will do, is provide an estimate of how many of these people are homeless
at a given time. 13
It is important to note that any PiT Count under-represents the number of people experiencing
homelessness, and that the results should therefore be taken as the minimum value. There are
likely to be additional people experiencing homelessness who were not counted. However,
through this process we know that there were at least 207 people who were homeless and an
additional 60 people living in time-limited transitional housing on the night of April 14, 2021.
Homeless persons enumerated in outdoor spaces were only counted if they were encountered
on public property, or in participating indoor locations (such as Kingston Street Mission). If people
who are homeless are indoors in non-participating locations, they are not counted. This includes
those who are couch-surfing, living in a motel, sleeping in ATM foyers, or other comparable
arrangements. As previously mentioned, the outdoor/street portion of the count was reduced in
terms of the number of people conducting the enumeration and surveys due to the inability to
onboard community volunteers to the process.
Though weather can often impact the count in terms of who may be found outdoors, on the night
of the 2021 count, April 14th, the weather was moderate spring temperatures.
13 Employment and Social Development Canada, “Guide to Point-In-Time Counts in Canada of the Homelessness
Partnering Strategy”
Page | 14Results of the Urban Kingston 2021 Point-in-Time Count
2021 Point-in-Time Results
Homeless Populations
207 homeless individuals were encountered during the Point in Time Count process, including
children under 16. This total includes those who were unsheltered and those staying in
emergency or domestic violence shelters (absolute homelessness) as well as individuals living
in time limited transitional housing. Some of the individuals encountered and included were
couch surfing, staying in a motel, or in a treatment facility with no permanent residence to return
to.
Accompanied % of
2021 Adults Youth Total
Children Total
Emergency Shelter 54 19 7 80 39%
Transitional Housing 32 23 5 60 29%
No Fixed Address 14 2 2 18 9%
Unsheltered 15 2 0 17 8%
Motel 0 2 2 4 2%
Couch surfing 5 4 0 9 4%
Unknown 18 1 0 19 9%
Total 138 53 16 207 100%
% of Total 67% 26% 7% 100%
Absolute Homelessness
A total of 134 people were found to be absolutely homeless on April 14, 2021, with an additional
60 living in transitional housing and 13 staying at a motel or at a friend’s place. Of the 134 people,
80 or 60% were sheltered, meaning that they slept in an emergency shelter or a domestic violence
shelter on the night of the count. 18 additional people (13%) were found in a hospital, detox or
treatment centre, or isolation motel on the night of the count, and stated that they had No Fixed
Address (NFA). 17 people, or 13%, were unsheltered, meaning that they were found in parks, on
the streets, encampments, or in other public spaces. 19 people encountered (14%) are counted
in absolute homelessness as staying in an unknown overnight location.
Accompanied % of
2021 Adults Youth Total
Children Total
Sheltered 54 19 7 80 60%
Unsheltered 15 2 0 17 13%
No Fixed Address 14 2 2 18 13%
Unknown 18 1 0 19 14%
Total 101 24 9 134 100%
% of Total 75% 18% 7% 100%
Page | 15Results of the Urban Kingston 2021 Point-in-Time Count
Precarious Housing
60 of the 207 people encountered on April 14, 2021 were living in transitional housing. An
additional 4 were staying in a motel, and 9 were staying at someone else’s place, or “couch
surfing”. According to the Canadian definition of homelessness, these individuals are considered
to be homeless. Their tenure in transitional housing is time limited, and thus they cannot be
considered to have attained stable, permanent housing. Similarly, individuals staying at a motel
or with a friend who do not have a permanent residence to return to are also considered to be
homeless.
Accompanied % of
2021 Adults Youth Total
Children Total
Transitional
32 23 5 82%
Housing 60
Motel 0 2 2 4 6%
Couch surfing 5 4 0 9 12%
Total 37 29 7 73 100%
% of Total 51% 40% 9% 100%
Shelter Occupancy
On the night of April 14, 2021, the overall shelter capacity was at 75%. The In from the Cold
emergency was operating at 100% capacity (only 37% of its usual capacity of 35 beds), the
Kingston Youth Shelter was at 93% capacity, the family shelter was at 68% capacity and the
overflow shelter was at 83% capacity the night of the count. Shelter capacity and usage has been
considerably impacted by the COVID-19 pandemic due to the guidelines around social distancing
and screening. Beyond this, there can often be a variety of other factors that can affect shelter
occupancy.
20
18
16 6
14 1
0
12
10
9
8
13 14 13
6
1
4
2 5 5
0
In From the Cold Kingston Youth Lily's Place Kingston Interval Overflow
Shelter House
Occupied Vacant
Page | 16Results of the Urban Kingston 2021 Point-in-Time Count
Survey Demographics
Gender
On the night of April 14th, 41% of people experiencing homelessness in Kingston were women. If
dependent children are excluded, the percentage of adult and independent youth who identify as
women is 39%. This is a decrease from the 2018 results, though still atypical to the national rate
of the proportion of women experiencing homelessness. However, the national average of female
homelessness does appear to be trending upwards.
Female Homelessness
60%
55%
50%
41%
40% 36%
National Average
30% 27% Kingston 2018
Kingston 2021
20%
10%
0%
2016 2018 2021
Of the 176 surveys conducted, 73 or 41% of the respondents were women. The 176 survey
respondents reported a total of 16 accompanied children. There is an additional 5 females when
accompanied children are included in the demographics. Of the 73 adults and independent youth
who were women, the average length of time spent homeless within the past year was 6.5 months.
60% of all female survey respondents had stayed in an emergency shelter within the past year.
The average age of female survey respondents was 37 years. When accompanied children are
included, the average age is 34.5 years.
3% of adult / independent youth survey respondents identified as transgender. Of these, 60%
were trans women. 1% of respondents identified as non-binary. People who identify as
transgender disproportionately experience violence and discrimination when compared with the
cisgender population. 14 Of those that identified as transgender or non-binary, 83% were youth
aged 16-24.
14 Mark Cull, Hazel Platzer, & Sue Balloch, “Out On My Own: Understanding the Experiences and Needs
of Homeless Lesbian, Gay, Bisexual and Transgender Youth”
Page | 17Results of the Urban Kingston 2021 Point-in-Time Count
Age
The average age of people experiencing homelessness on the night of the PiT Count was 33
years. Excluding accompanied children, the average age is 37. The most common age range was
25-64. The majority of people encountered were adults (69%).
69
Age of the oldest person who was homeless
33
Average age
3 months
Age of the youngest person who was homeless
7% 24%
were children youth aged 16-24
69%
were adults 25+
Indigenous / Aboriginal Communities
During the data collection process, individuals who were experiencing homelessness were asked,
“Do you identify as Indigenous, or do you have Indigenous ancestry?” Respondents self-reported
whether or not they were indigenous or could opt not to answer the question. 23% indicated that
they were First Nations (14%), or Métis (9%). A further 8% said that they had Indigenous ancestry,
and 4% were unsure whether they were Indigenous.
Racial Identity
In 2018, a question was added to the PiT Count survey that asked respondents if they identified
with any of the listed racialized identities. Respondents were asked to indicate all identities that
apply. Of the 176 surveyed, 34% did not answer this question, 3% said they don’t know and 3%
identified as Indigenous only. Of those that answered yes, the majority (92%) of respondents
identified themselves as white. 4% identified as Black, 2% identified as Latin American, 2%
identified as Asian.
Page | 18Results of the Urban Kingston 2021 Point-in-Time Count
Immigrant and Refugee Status
Respondents were asked if they had come to Canada as an immigrant, refugee, or refugee
claimant. 5% of respondents indicated they were immigrants, and 2% indicated they had refugee
or refugee claimant status.
Language
An additional question was added to the survey in 2018 that asked participants in what language
they feel best able to express themselves. 89% indicated that they were most comfortable
communicating in English, 1% in French, 3% were most comfortable expressing themselves in a
language other than English or French, and 7% did not provide an answer.
Sexual Orientation
As a part of the PiT Count survey, individuals experiencing homelessness were asked how they
self-identify regarding sexual orientation. 15% of survey respondents indicated that they identify
as LGBQ+ (lesbian, gay, bisexual, queer, pansexual), 73% identify as straight / heterosexual, and
10% did not provide an answer to the question.
Of the individuals who identified themselves as LGBQ+, 38% were independent youth. We know
that youth who identify as LGBQ+ are more likely to become homeless than their heterosexual
peers due to family conflict and homophobia in the home. 15 Preliminary research is also being
conducted that suggests that adults who are LGBQ+ also disproportionately experience
homelessness. 16 14% of adult respondents identified as LGBQ+. Survey respondents were
asked at what age they first experienced homelessness. The average age at which individuals
who identified as straight / heterosexual first became homeless was 26 years, while the average
age that LGBQ+ individuals first became homeless was 19 years.
Veteran Status
A total of 6 (4%) respondents indicated that they were veterans who had served in the Canadian
Armed Forces and 1 indicated they had service in the military and Royal Canadian Mounted
Police. Less than 2% of Canadians are veterans, which tells us that the number of people
experiencing homelessness within this population in Kingston is somewhat high. However, in both
Canada and the United States, veterans are known to be at higher risk of homelessness than the
general population.
Foster Care
In 2018, a question was added to the PiT Count survey that asked respondents whether they had
ever been in foster care or a group home and was once again asked on the 2021 survey. 25% of
participants indicated that they had been in foster care or a group home as a child. The median
length of time between the respondents leaving foster care and becoming homeless was 120
days.
15 Canadian Observatory on Homelessness, “Where am I Going to Go? Intersectional Approaches to
Ending LGBTQ2S Youth Homelessness in Canada & the U.S.”
16 Dr. John Ecker, “A Review of the Literature on LGBTQ Adults Who Experience Homelessness”
Page | 19Results of the Urban Kingston 2021 Point-in-Time Count
36% of those who had been in foster care were youth on the night of April 14, 2021. Of the youth
(ages 16-24) who completed surveys, 35% had been in foster care. Across Canada, about 43%
of homeless youth have been in foster care or group homes. 17 This includes foster youth who
have aged out of the system, youth who have left their placement homes due to negative
experiences, and youth who returned to their family home or lived with relatives.
Physical and Mental Health
The 2021, as in previous years, the survey included additional local questions that asked
respondents about their physical and mental health. A large portion of respondents that
identified as having any of the listed health challenges indicated at least 2 or more.
38% indicated that they had an illness or medical condition (e.g diabetes, arthritis), and 27%
indicated that they had a physical limitation. 34% indicated that they had learning or cognitive
limitations, which could include dyslexia, autism spectrum disorder or ADHD, while 20%
indicated an acquired brain injury (46% of those were women).
46% of respondents self-identified as having a substance use issue. 65% of survey respondents
self-identified as having mental health issues, a disproportionate percentage compared with the
general population in Kingston. We know that people with poor mental health are more likely to
become homeless, and that experiencing homelessness amplifies symptoms of poor mental
health. In general, 30-35% of people (up to 75% of women) experiencing homelessness have
mental illnesses, and 20-25% have concurrent disorders (i.e. have severe mental illness and
addictions simultaneously). 18
17Stephen A. Gaetz, “Coming of Age: Reimagining the Response to Youth Homelessness in Canada”
18Laura Munn-Rivard, “Current Issues in Mental Health in Canada: Homelessness and Access to
Housing”
Page | 20Results of the Urban Kingston 2021 Point-in-Time Count
Experiential Survey Data
Sleeping Arrangements
The 2021 PiT Count found that the majority of individuals experiencing homelessness in Kingston
are sheltered. Of the 176 people who completed surveys, the majority indicated that they were
sleeping in an emergency shelter, domestic violence shelter, or in transitional housing on the night
of April 14, 2021. 37% of respondents indicated that they would be sleeping in an emergency or
domestic violence shelter, and 29% were staying in transitional housing.
7% of those surveyed were staying in a public space; 4% reported that they would be sleeping in
a public space unsheltered, and 3% were sleeping in encampments. 12% indicated that they
would be sheltered in some capacity, but with no fixed address (e.g. motel, with a friend, treatment
centre or safe bed).
Where are you sleeping tonight?
Emergency Shelter
37% 18%
Transitional housing
29%
37%
Public Space/unsheltered 6%
7%
3%
Motel
3%
7%
Couch surfing
6%
Other, or unknown
18% 29%
Duration of Homelessness
Kingston’s 2021 PiT Count found that 58% of survey respondents had been homeless for 6
months or longer, with the largest portion of that reporting they’d been homeless for a year. 20%
had been homeless for 0-2 months, and 10% had been homeless for 3-5 months. 2% did not
know how long they had been homeless, and 6% did not provide an answer. The average length
of time respondents had spent homeless in the past year was 230 days.
270 days
Median length of time spent homeless
230 days
Average length of time spent homeless
Page | 21Results of the Urban Kingston 2021 Point-in-Time Count
57% of survey respondents reported that they had been homeless only once within the past year.
10% said they had been homeless twice, and 18% said they had been homeless three or more
times. 2% did not know how many times they had been homeless, and 6% did not provide an
answer. 12% of respondents had been homeless for 6 months or longer and had been homeless
three or more times within the past year.
6%
2%
1 time 18%
2 times
3+ times
Unsure
57%
Did not answer
10%
Age of First Episode
Those who completed surveys were asked at what age they first became homeless in their lives.
An alarming proportion of people experiencing homelessness as adults first became homeless
as youth, which provides further evidence of the need to focus on both preventative and
intervention-based solutions to end youth homelessness. 53% of those surveyed said they were
under 25 the first time they were homeless.
7 years 69 years
Lowest age first homeless Highest age first homeless
53% Were under the age of 25 the first time they experienced homelessness.
28% Were between the age of 25 and 55 the first time they experienced
homelessness.
8% Were over the age of 55 the first time they experience homelessness.
Page | 22Results of the Urban Kingston 2021 Point-in-Time Count
The City of Kingston’s 10-Year Housing & Homelessness Plan hopes to address chronic
homelessness. In January of 2015, the City of Kingston began implementing changes to end
chronic homelessness by moving toward a Housing First model through collaboration with
community partners in both the public and private sectors in order to better address the housing
needs of the chronically homeless population. The City has prioritized an integrated system of
housing and individualized supports with coordinated access and service provision in an attempt
to move people out of chronic homelessness.
Service Usage
The programs/and or services most frequently used by people experiencing homelessness in
Kingston include emergency shelters and emergency health services. In the past year, 65% of
those surveyed had stayed in an emergency shelter at least once. 51% had been to the
Emergency Room, with 38% of those having gone 2 or more times and 41% had been
hospitalized.
65%
of respondents have stayed in an
emergency shelter in the past year.
Emergency Shelter 65%
Services used at least once within the
Emergency services 40%
past year
Hospitalized 41%
Emergency Room 51%
Been to jail/incarcerated 23%
0% 10% 20% 30% 40% 50% 60% 70% 80% 90% 100%
Page | 23Results of the Urban Kingston 2021 Point-in-Time Count
Geography
When individuals were asked how long they had lived in the community, the majority indicated
they had been living in the City of Kingston for at least one year. 22% of respondents had lived in
Kingston for the entirety of their lives.
22% 22%
11%
23%
20%
Always been here 1 year or less 1-5 years 5-10 years 10+ years
If respondents indicated that they had not always lived in Kingston, they were asked where they
moved from.
Where are you from?
3%
15% 22%
48%
Kingston Elsewhere in Ontario Elsewhere in Canada Another country
Page | 24Results of the Urban Kingston 2021 Point-in-Time Count
Reasons for Housing Loss
The most common reasons that survey respondents said they became homeless were the
following: not enough income for housing (20%), family conflict (34% - 18% conflict with
parent/guardian, 16% conflict with spouse/partner), abuse (22% - 12% by spouse/partner, 5 %
by parent/guardian, 5% other), landlord/tenant conflict (16%), mental health issue, and
substance use (each 15%). Some respondents may have indicated more than one reason for
their housing loss.
Complaint (e.g. noise,damage) 4%
Hospitalization or Treatment Program 3%
Physical Health issue 3%
Landlord/Tenant conflict 16%
Unfit/unsafe housing condition 12%
Substance Use issue 15%
Incarceration 14%
Abuse by: other 5%
Abuse by Parent/Guardian 5%
Abuse by Spouse/Partner 12%
Mental Health issue 15%
Not enough income 20%
Conflict with: other 15%
Conflict with Spouse/Partner 16%
Conflict with Parent/Guardian 18%
0% 5% 10% 15% 20% 25%
In a separate question, only 6% of respondents indicated that their most recently housing loss
was related to the COVID-19 pandemic.
When accounting for gender, or more specifically female homelessness, reporting conflict with
or abuse by a partner/spouse as the reason for housing loss is higher for woman than for men.
Of the respondents that reported conflict with a partner/spouse, women make up 56%; for
abuse by a partner/spouse women were 83% of respondents. 20% of women reported that the
reason for their housing loss was conflict with a spouse/partner and 22% reported it was due to
experiencing abuse by a spouse/partner; this is a higher rate than the overall results, at 16%
and 12%. Women were 42% of respondents that indicated unfit/unsafe housing condition as a
reason for housing loss. As with the overall results, women often indicated more than one
reason for their loss of housing.
Page | 25Results of the Urban Kingston 2021 Point-in-Time Count
Sources of Income
The most common method through which people experiencing homelessness obtain money is
social assistance such as Ontario Works or Ontario Disability Support Program.
80% of survey respondents that provided a source of income reported that they rely on these
programs, with 34% receiving support from provincial welfare/social assistance programs and
46% from disability benefits. 6% said they had no sources of income whatsoever. 16% said
they obtain money through formal employment. It is important to note that some respondents
indicated more than one source of income, as represented in the below data.
Did not answer 8%
Other 7%
Welfare/social assistance 34%
Seniors benefits 5%
Self employment 1%
Pension 1%
Part-time employment 5%
Money from a service agency 2%
Informal income sources 5%
GST/HST refund 7%
Full-time employment 7%
Employment Insurance 5%
Disability benefit 46%
Child and family tax benefits 5%
CERB 1%
Casual employment 3%
Alimony 1%
0% 5% 10% 15% 20% 25% 30% 35% 40% 45% 50%
Level of Education
Of the 176 survey respondents, 40% had completed high school and 20% had taken at least
some post-secondary schooling.
Page | 26Results of the Urban Kingston 2021 Point-in-Time Count
Barriers to Housing
People who have become homeless face many barriers to obtaining and
maintaining affordable permanent housing. Survey respondents were asked
what they felt was preventing them from finding a permanent place to live and
could provide as many answers as necessary to represent their situation; only
1% reported that they did not have any barriers to housing. The most common
responses were overwhelmingly that they did not have enough income and
that rents were too high for them to afford.
53% of respondents reported that they were homeless because they did not have enough income
to afford rent, and 53% because rents were too high to be affordable. Further, 31% indicated that
housing was not available and 19% said housing options were undesirable or not suitable. There
are a number of factors that could have contributed to these results.
It is important to note that neither Ontario Works nor Ontario Disability Support Program (the two
most commonly reported sources of income) provides a housing allowance that is adequate to
cover the average cost of rent in Kingston.
Not enough income Rents are too high
53% said they do not have enough 53% identified the cost of rent as
income to afford permanent housing a barrier to housing
Housing not available
31% said that permanent housing options are not available in Kingston
Barriers to Housing
Did not answer 11%
Unemployment 23%
Substance abuse/addiction 21%
Rent is too high 53%
Pets 3%
Not enough income 53%
Mental health issues 20%
Housing options undesirable/not suitable 19%
Housing not available 31%
Health problems/disability issues 9%
Family/relationship breakdown or conflict 16%
Eviction 5%
Don't want housing 1%
Discrimination 13%
Children 3%
0% 10% 20% 30% 40% 50% 60%
Page | 27Results of the Urban Kingston 2021 Point-in-Time Count
Youth-Specific Data and Demographics
We know that youth have a unique experience of homelessness, and that their needs are not
always met within adult systems. The following survey findings reflect the experiences and
demographics of young people between the ages of 16-24 who are homeless.
37%
of surveyed youth identified as female
52%
of surveyed youth identified as male
11% of surveyed youth identified as transgender
or non-binary/genderqueer
The majority of youth surveyed on the night of April 14, 2021 were sheltered. 34-35% were staying
in an emergency or domestic violence shelter, 41% were staying in transitional housing, 8-9%
were couch surfing or staying in a motel, 4% were sleeping in a public space (unsheltered) or in
an encampment.
Page | 28Results of the Urban Kingston 2021 Point-in-Time Count
Of the surveyed youth who were
12.5% staying in an emergency shelter
Identify as female
25% or domestic violence shelter on
the night of the count, 25%
Identify as male
Youth in identify as female, 62.5% identify
shelter as male, and 12.5% identify as
transgender or gender non-
Identfiy as conforming.
transgender or non-
62.5%
binary
Of the surveyed youth who
were staying in transitional 16% Identify as female
housing on the night of the
count, 42% identify as female,
Youth in 42%
42% identify as male, and 16% Identify as male
identify as transgender or
Transitional
gender non-conforming. Housing
42% Identify as transgender
or non-binary
4% of surveyed youth were couch surfing on the night of April 14, 2021
Of these, 50% identify as female
50% identify as male
4% of surveyed youth were sleeping in a public space on the night of April 14, 2021
Of these, 100% identify as male
Page | 29Results of the Urban Kingston 2021 Point-in-Time Count
35% of surveyed youth
22% have been in foster care or
a group home
Of surveyed youth
identify as gay, lesbian
bisexual, or queer
Of the surveyed youth who are
26% Indigenous:
- 25% identify as female
of surveyed youth - 58% identify as male
- 17% identify as transgender
identify as Indigenous or gender non-conforming
(First Nations or Métis) An additional 11% of surveyed youth
have indigenous ancestry.
10%
Of surveyed youth are family heads
Page | 30Results of the Urban Kingston 2021 Point-in-Time Count
20 15
the average age surveyed
the average age of
youth became homeless
surveyed youth
52%
of surveyed youth had
stayed in an emergency 218 days
shelter in the past year
compared with 74% of surveyed adults (7 mos)
the average length of time
surveyed youth spent
homeless in the past year
28%
52% of surveyed youth
came to Kingston from
Of surveyed youth are
elsewhere in Ontario
from Kingston
Page | 31Results of the Urban Kingston 2021 Point-in-Time Count
83% of surveyed youth
self-identified as having
mental health challenges
Of these, 42% identify as male, 42% as female
and 13% as transgender or non-binary
52% of surveyed youth
self-identified as having a
substance use issue
17% of surveyed youth
self-identified as having an
illness or medical condition
Page | 32Results of the Urban Kingston 2021 Point-in-Time Count
2018-2021 Comparative Data
The following charts and graphics provide a comparison between the data collected in Kingston
in 2018 and 2021 as a part of the second and third nationally coordinated PiT Counts.
Absolute Homelessness in Kingston
81 134
people experiencing absolute people experiencing absolute
homelessness found in 2018 homelessness found in 2021
Homelessness in Kingston
152 207
people encountered who were people encountered who were
homeless in 2018 homeless in 2021
Where they were staying
45%
40% 38% 39% 39%
35%
29%
30%
25%
20%
15%
15% 13%
9% 9% 8%
10%
5% 1%
0%
Emergency Shelter Transitional No Fixed Address Unsheltered Other
Housing
2018 2021
Page | 33You can also read