2023 Plan of Conservation and Development Committee Meeting #5 Economic Development
←
→
Page content transcription
If your browser does not render page correctly, please read the page content below

2023 Plan of Conservation and Development
Committee Meeting #5 Economic Development
2/1/22

Agenda
1.   Review economic development trends
2.   Discuss ideas surrounding economic development
3.   Discuss draft online survey
4.   Review draft vision statement
5.   Next steps

Project Schedule
   15 months (concluding by end of 2022)
   Collaboration w/Town & P&Z Commission

                         Community Engagement

   Existing Conditions Assessment

                     AHP           Adoption

                                        POCD Document                 Adoption

                               BTD Zoning        Review

Sept. Oct.   Nov. Dec. Jan. Feb. Mar. Apr. May June July Aug. Sept. Oct. Nov. Dec.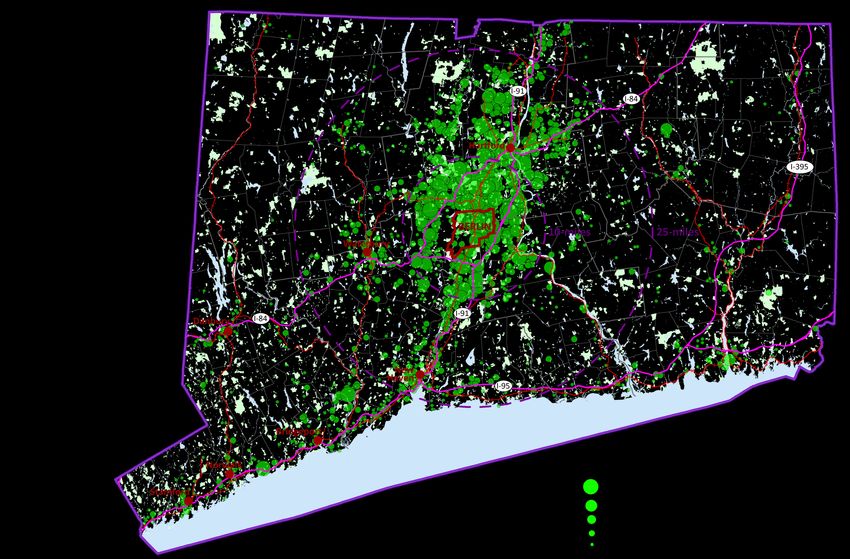
Regional Context
Regional
Connections
• Berlin is located in the center of the
  state and southern Hartford County. It is
  between Hartford, Waterbury, and New
  Haven (3 of the state’s top 5 most
  populous cities), which are all within 25   10-miles        25-miles
  miles from the town’s center.
• Berlin has strong regional connections.
    • The Hartford Line runs through
        the town, providing direct rail
        service to both Hartford (just 1
        stop away) and New Haven.
    • Amtrak provides connections to
        Boston and New York City.
    • I-91 and I-84 are easily accessible
        via Routes 9 and 5/15.

                                                         Rail
                                                         Interstate
                                                         Open Space
                                                         Water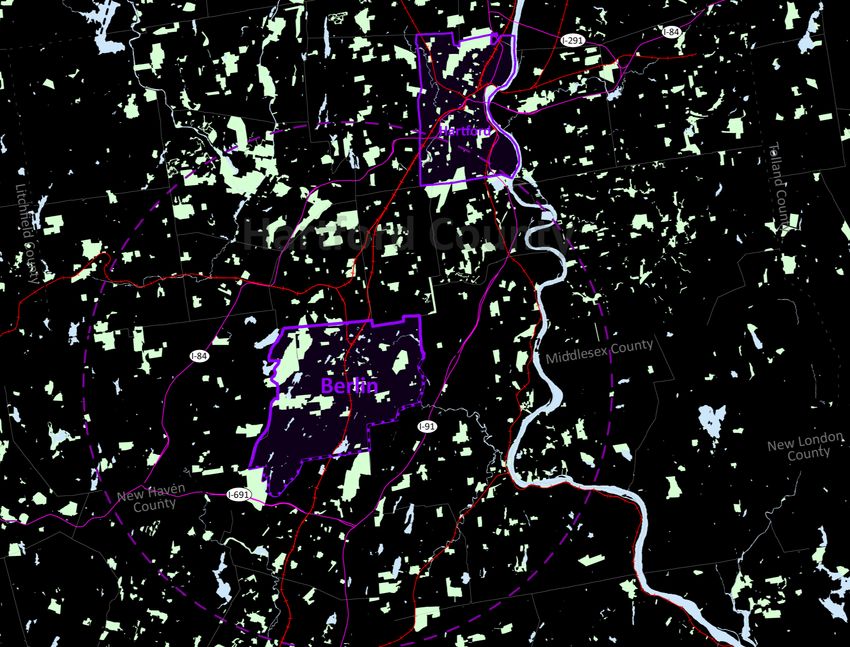
Regional
Employment
Nodes
Berlin is proximate to a large pool of
workers with excellent rail and highway
access.
• According to Census data:
    • There are approximately 265,000
       primary jobs within a 10-mile
       radius from the center of Berlin.
    • There are over 855,000 jobs
       located within a 25-mile radius of
       the town
• Employment corridors are noticeable
  along the many rail lines and interstate
  highways.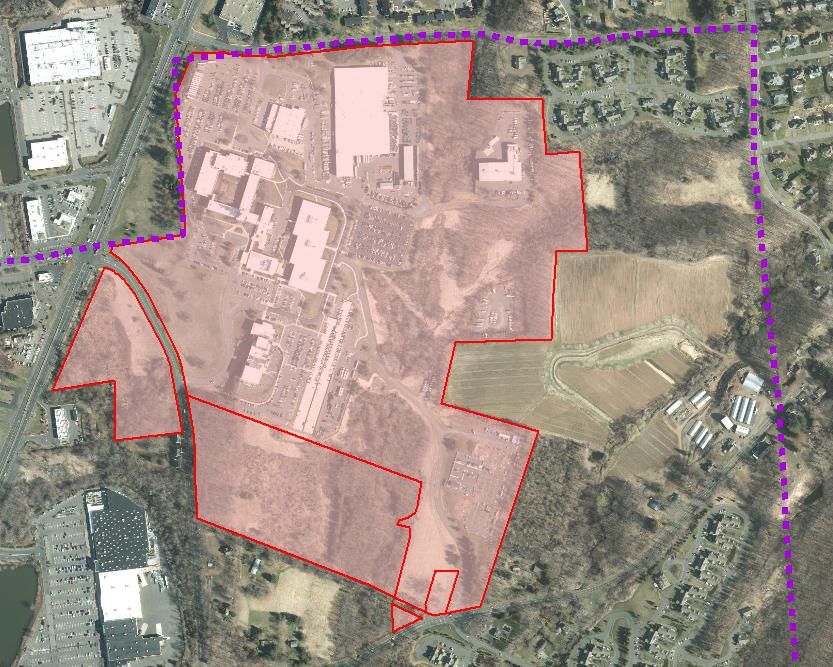
Immediate
Region
• Berlin is within 10 miles
  of Hartford and is home
  to the first train station
  south of Hartford.
• It lies in southern
  Hartford County,
  bordering both New
  Haven and Middlesex
  Counties
• The town is located less                         10-miles
  than 10-miles from the
  Connecticut River and
  between two major
  interstate highways (I-84    Connecticut River
  and I-91)

Labor Force

12,000                                                11,952
                               Berlin’s Labor Force                                                                                     Connecticut River
11,800
                                                               11,650
11,600 11,421
11,400
                                                               11,338
11,200
11,000

Source: CT DOL, October 2021

•   Berlin’s labor force is smaller than most of its neighbors as of October 2021. It is roughly a third the size of both Meriden and New
    Britain’s labor force, its neighbors to the north and south.
•   Berlin is home to roughly 2.5% of Hartford County’s labor force (460,531).
•   The town’s labor force had been rising prior to the pandemic and now sits just below 2010 levels, 600 less than the peak in 2019.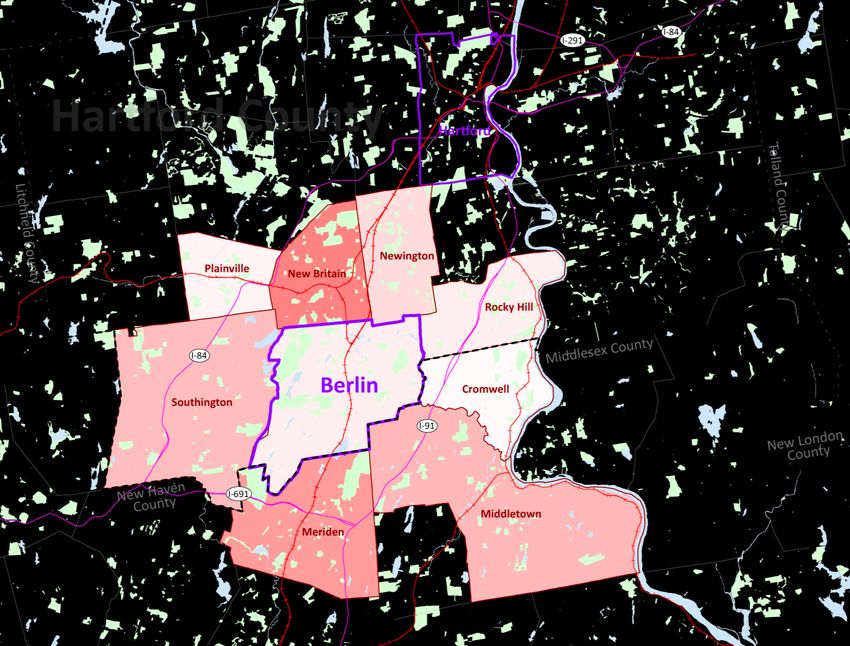
Employment
  Employment Change, 2010 - 2021
                                                                                                                                Berlin
                                                                                                                             Meriden
                                                                                                                Rocky Hill
                                                                                                       Southington
                                                                                    Hartford County
                                                               Connecticut
                                                           New Britain
                                                             Plainville
                                                           Cromwell
                                               Newington
                                   Hartford
                         Middletown
-4.0%                      -3.0%              -2.0%            -1.0%         0.0%             1.0%    2.0%                   3.0%        4.0%
Source: CT DOL, October 2021

  • Berlin has experienced stronger employment growth relative to its neighbors as well as Hartford, Hartford County, and the
    state.
  • Employment in Berlin is now 3% higher than in 2010.
      • While employment within Hartford County has remained relatively unchanged since 2010, it has decreased by 0.3%
        across the state and by 2.2% in the City of Hartford.
Unemployment
16.0%
           14.9%
14.0%                                                                                                                        13.3%

12.0%

10.0%      9.4%
            9.1%                                                                                                                8.1%        9.2% Hartford
 8.0%                                                                                                                             7.9%
            7.8%
                                                                                                                              6.2%
 6.0%                                                                                                                                       5.5% Hartford County
                                                                                                                                            5.3% Connecticut
 4.0%                                                                                                                                       4.3% Berlin

 2.0%

 0.0%
              2010              2011   2012   2013    2014           2015   2016         2017        2018        2019        2020        Oct-21
   Pandemic Recovery: 2019 - 2021 Unemployment Change
3.5%                                                                 3.1%
3.0%                                                          2.6%            •    Berlin’s unemployment has remained well below the City of
2.5%                                                                               Hartford, the county, and the state over the past decade.
                                                       2.0%
2.0%                               1.6% 1.6% 1.7% 1.9%
                         1.3% 1.4%                                            •    The town’s labor force appears to be among the least affected
1.5%      1.0% 1.1% 1.1%                                                           by the pandemic within the immediate region.
1.0%
0.5%                                                                                   • Berlin’s unemployment is just 1.1% higher in October
0.0%                                                                                      2021 than it was in 2019 (pre-pandemic levels).
                                                                                       • Comparatively, the City of Hartford’s unemployment
                                                                                          remains 2.6% higher, New Britain’s is 3.1% higher, and
                                                                                          both the county and state remain 1.6% higher.

 Source: CT DOL, October 2021
Commute Flow
Inflow/Outflow of Workers in Berlin (all jobs)
Source: US Census Bureau OnTheMap 2019
11,251 Berlin has a positive job inflow.
Outside residents
• More workers come into the town
work in town
for work than leave on a daily basis.
1,105 8,711
residents work
residents work in town
outside of townJobs to Housing Balance Berlin’s jobs to housing ratio is in line with the immediate
region. The town has a higher ratio than the majority of its
Cromwell, neighbors, but it is lower than Newington, Rocky Hill and
Middletown Hartford.
1.3 Berlin,
Waterbury,
Meriden,
Greenwich Berlin’s ratio lags behind some larger job hubs within the
Southington 1.5 state, including Stamford and New Haven, but is ahead of
1.0 Stamford, many others like Waterbury, Bridgeport, Norwalk, and
Newington Danbury.
Bristol, Hartford
1.6
New Britain Rocky Hill 2.4
0.9 1.9
New
0 Bridgeport 1 Haven 2 3 4 5 6
0.8 1.8
Norwalk
Danbury,
1.2
Plainville
1.4
JOB TO
HOUSEHOLD
RATIO
Housing Centric Areas Balanced Jobs Centric Areas
More workers commuting out of the Employment centers with ample More workers commuting into the area
area housing, balance of land uses
Source: US Census 5-yr ACS 2014 - 2019, US Census LEHD 2019Property Taxes
Tax Rate and Tax Base Trends
Source: CT Data Center, Grand List by Town, Mill Rates, 2011-2020
2020 Share of Real Property 2011-2020 Change Berlin has a relatively low tax rate compared to its
neighbors, which could be an economic development
FY 2022 Commercial/ Commercial/
Mill Rate
Residential
Industrial
Residential
Industrial
tool to incentivize businesses to choose to locate in the
town. The town’s tax rate is in line with Plainville, Rocky
Berlin $33.93 76.6% 21.3% 0.2% 0.2%
Hill, and Middletown but far lower than Meriden and New
Cromwell $30.33 75.1% 24.8% -3.8% 4.8% Britain.
Meriden $40.86 70.2% 23.9% -0.1% -1.2%
While Berlin’s share of commercial and industrial
Middletown $35.70 61.1% 28.7% -9.1% 11.5% property was not as high as some of its neighbors in
New Britain $49.50 69.4% 18.5% -3.5% 1.7% 2020, recent development activity suggests this number
will rise in the future, which could help reduce the tax
Newington $38.81 71.7% 24.1% -1.8% 1.6%
burden on residents.
Plainville $34.56 69.9% 26.2% -0.7% 1.3%
Rocky Hill $34.10 63.1% 28.6% -5.9% 2.6%
Southington $29.03 82.2% 14.9% 0.1% 0.1%
Mill
Rates
$30 $40 $50Property Taxes
2021 Berlin Property Tax Base by Assessed Value
• The Town’s 2021 total
Industrial
assessed value of real Utilities
6.51%
property was $2.1 billion 0.17%
Commercial
18.93%
Forest & Open
Space
0.02%
Farm
0.02%
Residential
69.89%
Vacant
4.45%
Source: Town of Berlin AssessorRegional Considerations & Questions • Berlin’s labor force demonstrated strong resiliency relative to neighboring communities throughout the pandemic. How do we continue to successfully grow back lost jobs due to Covid? • Berlin demonstrates a healthy jobs to household balance and inflow/outflow of workers. How can the town maintain this balance while growing the economy? • Is Berlin well positioned within the region to attract future employers? What assets should we focus on for future growth?
Local Context -
Employment
Employment Nodes

  Higher concentrations of
  employment are visible
  along the Berlin Turnpike,
  Route 9, and Farmington
  Ave. corridors.
All Businesses
According to the town’s business list, prepared by the Economic
Development Department, the strongest commercial corridor is clearly
along Farmington Ave., which boasts the highest concentration of
businesses in town. This is where most restaurant and retail businesses
are located. The Berlin Turnpike is also an active, more auto-focused,
retail corridor that is also home to some larger businesses.

    Types of Businesses
    Source: Town of Berlin Economic Development Department, Business
    List, 2021

                                        Businesse
     Type                                               Share
                                            s
     Industrial                            95           18.2%
     Construction/Home Services            66           12.6%
     Personal Services                     58           11.1%
     Health Care                           57           10.9%
     Retail                                52           10.0%
     Restaurant/Coffee
                                           47            9.0%
     Shop/Brewery
     Professional Services                 40            7.7%
     Auto Related                          35            6.7%
     Other                                 29            5.6%
     Recreational                          25            4.8%
     Agriculture                           11            2.1%
     Bank                                   7            1.3%
                                Total     522           100%
Top 10 Employers
Top Employers
Source: Town of Berlin Economic Development Department, 2021
Share of
Company Industry Employees Town
Employment
Eversource (formerly
1 Electric Power Generation 1,200 11.62%
Northeast Utilities)
2 Town of Berlin Government 688 6.66%
3 Assa Abloy Hardware Manufacturing 410 3.97%
EuroAmerican Home
4 Home Health Care Services 287 2.78%
Care
Comcast Cable/TCI, Cable and Other
5 274 2.65%
CT Subscription Programming
Industrial & Commercial
6 TOMZ Corporation 251 2.43%
Machinery & Equipment Mfg
7 Keep Me Home Pet Supplies Stores 250 2.42%
Budney Overhaul and Appliance Repair and
8 180 1.74%
Repair Maintenance
9 Parker Fluid Control Instrument Manufacturing 157 1.52%
10 Stop & Shop Grocery Stores 137 1.33%
3,834 37.14%
• Most of the town’s top employers are located along the Berlin Turnpike.
• The top 10 employers contribute to 37% of Berlin’s overall workforce.
• The town is the second leading employer, behind Eversource.
• Approximately 65% of the town’s employees are unionized Board of
Education employees. 27% are unionized general government employees.
The remaining 8% are non-union employees.Employment by Berlin’s Total Employment by Industry
Source: EMSI, 2021
Industry
2021 %
NAICS Description
Jobs Share
31 Manufacturing 1,992 19%
62 Health Care and Social Assistance 1,401 14%
Manufacturing is the largest industry 44 Retail Trade 1,325 13%
90 Government 1,255 12%
in Berlin, accounting for 19% of the
48 Transportation and Warehousing 753 7%
City’s jobs in 2021 23 Construction 695 7%
• Industrial uses are clearly important to 54 Professional, Scientific, and Technical Services 521 5%
Berlin’s economy, as the Manufacturing, 42 Wholesale Trade 504 5%
Transportation & Warehousing, 81 Other Services (except Public Administration) 420 4%
Construction, and Wholesale Trade 72 Accommodation and Food Services 286 3%
industries are all among the town’s top 8 22 Utilities 258 2%
Administrative and Support and Waste
industries by employment in 2021. 56 Management and Remediation Services 240 2%
• All industries that encompass 71 Arts, Entertainment, and Recreation 223 2%
heavy commercial and industrial 52 Finance and Insurance 181 2%
use businesses. 51 Information 116 1%
61 Educational Services 82 1%
53 Real Estate and Rental and Leasing 80 1%
11 Agriculture, Forestry, Fishing and Hunting 41Resident vs
Town Berlin Resident Jobs Jobs in Berlin
NAICS Description Jobs Share Jobs Share
Workforce 11 Agriculture, Forestry, Fishing and Hunting 10 0.1% 8 0.1%
21 Mining, Quarrying, and Oil and Gas Extraction 2 0.0% 0 0.0%
The town is home to a higher share of 22 Utilities 51 0.6% 20 0.2%
workers in industries that cater to heavy
23 Construction 448 4.9% 667 5.8%
commercial and industrial activity.
31 Manufacturing 1,148 12.5% 2,487 21.7%
• Manufacturing: 12.5% of residents 42 Wholesale Trade 418 4.6% 588 5.1%
work in this industry; 21.7% of Berlin
jobs were in this industry in 2019. 44 Retail Trade 844 9.2% 1,042 9.1%
48 Transportation and Warehousing 230 2.5% 603 5.3%
• Transportation & Warehousing: 2.5% 51 Information 210 2.3% 529 4.6%
of residents work in this industry 52 Finance and Insurance 718 7.8% 265 2.3%
compared to 5.3% of Berlin jobs.
53 Real Estate and Rental and Leasing 86 0.9% 51 0.4%
• Wholesale Trade: 4.6% of residents
work in this industry compared to 5.1% 54 Professional, Scientific, and Technical Services 612 6.7% 480 4.2%
of Berlin jobs. 55 Management of Companies and Enterprises 250 2.7% 1,513 13.2%
Administration & Support, Waste Management
The town’s workforce significantly lags 386 4.2% 483 4.2%
the resident workforce in two typically 56 and Remediation
high-paying white-collar industries: 61 Educational Services 943 10.3% 236 2.1%
62 Health Care and Social Assistance 1,378 15.1% 1,249 10.9%
• Finance & Insurance 116 1.0%
71 Arts, Entertainment, and Recreation 140 1.5%
• Professional, Scientific, & Technical 72 Accommodation and Food Services 493 5.4% 537 4.7%
Services Other Services (excluding Public
291 3.2% 407 3.5%
81 Administration)
The town’s workforce significantly lags 496 5.4% 186 1.6%
the resident workforce in the Educational 90 Public Administration
Services and Health Care industries as 11 Agriculture, Forestry, Fishing and Hunting 10 0.1% 8 0.1%
well. 9,154 100% 11,467 100%
Source: US Census LEHD, 2019
* Note that these town-wide industry totals differ from the previous page. This data is from a different source and is from 2019 (the most recent LEHD data).Where
Residents Work
Town # Jobs % Share
Hartford 1,076 11.8%
Berlin 1,021 11.2%
New Britain 719 7.9%
Farmington 512 5.6%
Newington 458 5.0%
Middletown 341 3.7%
Meriden 332 3.6%
East Hartford 295 3.2%
West Hartford 293 3.2%
Rocky Hill 287 3.1%
All other locations 3,820 41.7%
9,154 100.0%
Most Berlin residents have short
commutes to their primary job.
• Over half of working residents
commute less than 10 miles
to work (56%), with the
highest concentration of
resident jobs to the north in
Hartford and the towns in
between.10 Industries were growing in Berlin prior to
Berlin’s Employment Change the pandemic. 2 have grown since 2019.
Source: EMSI, 2011-2021
2011 Jobs Annual % Growth • Manufacturing remains the town’s leading industry
2019 Jobs Pre-Pandemic 2019- by a wide margin
2021 Jobs 2011-2019 2021 • Growth in the Transportation & Warehousing
11 - Agriculture, Forestry, Fishing & Hunting -5.0% -0.6% industry has intensified since the start of the
pandemic, which comes as no surprise with the
53 - Real Estate & Rental & Leasing +1.3% -9.0% continued national rise in ecommerce activity.
61 - Educational Svcs -0.8% -2.9% • The Retail industry appears to have recovered from
the economic effects of the pandemic much faster
52 - Finance & Insurance +2.2% -0.4% than the Accommodation & Food Services industry
(down 3.6% and 21.7% per year respectively).
51 - Information -5.8% -17.2%
• Finance & Insurance and Professional, Scientific &
71 - Arts, Entertainment, & Recreation +1.3% -15.2% Technical Services jobs were increasing at a
healthy rate prior to the pandemic (2.2% and 3.6%
56 - Administrative & Support & Waste… -1.2% -3.9% annually).
22 - Utilities -4.2% +5.2% • These are typically higher paying white
collar jobs
48 - Transportation & Warehousing +6.8% +9.4%
• Professional, Scientific & Technical Services
54 - Professional, Scientific, & Technical Svcs +3.6% -1.0% was the second fastest growing industry in
Berlin from 2011 to 2019, behind only
72 - Accommodation & Food Svcs +0.7% -21.7% Transportation & Warehousing. It is now the
81 - Other Services (except Public Admin)
7th largest industry in Berlin.
+2.6% -14.4%
42 - Wholesale Trade -0.7% -6.9% Total Employment Change
11,500 11,332
23 - Construction +1.4% -3.3%
10,929
11,000
90 - Government -0.3% -1.3%
10,500 10,371
44 - Retail Trade +0.7% -3.6%
10,000
62 - Health Care & Social Assistance -0.4% -4.5%
9,500
31 - Manufacturing +0.1% -4.4% 2011 2019 2021
0 1,000 2,000 3,000Location Quotient (Berlin in relation to Hartford County)
Source: RKG Associates, EMSI, 2011-2021
A location quotient is a metric used to highlight a local economy’s strengths and
A number of Berlin’s industries are clear leaders within Hartford
weaknesses in comparison to a larger economic region. County, including Arts & Entertainment, Manufacturing, Retail,
Construction, and Transportation & Warehousing. Berlin’s
< 0.8 indicates an under-represented within an industry.
Professional, Scientific & Technical Services and Finance &
0.8 -1.2 indicates employment is in line with the larger region. Insurance industries are also emerging, with strong growth over
> 1.2 indicates specialization for the area within the region. the past decade and increasing location quotients. The town can
continue to foster these industries to bring more high paying jobs
Size of circle represents relative 2021 employment into town and create a specialization within the region.
Arts, Entertainment
& Rec
2.40 2.40
Strong and
Strong but
Declining 2.20
Construction Advancing
2.23 Manufacturing
Agriculture 2.00 2.03
1.80
1.74
Wholesale Trade Transportation
1.60 Retail Trade & Warehousing 1.58
1.49 1.48 LQ up from
1.41 1.40 1.20 in 2011
Other
1.20
Services
1.00
Health Care
0.80 0.80
0.77 Professional, Scientific &
Information Accommodation 0.68
Location Quotient
Technical Services
0.63 & Food Svcs 0.60
Admin & LQ up from 0.67 in 2011
0.52 Real Estate
Support 0.47
0.40
Weak and 0.38 Finance & Insurance
Weak but
Educational 0.20
Declining Services
0.17 LQ up from 0.12 in Emerging
0.00
2011
-8% -6% -4% -2% 0% 2% 4% 6% 8%
2010 – 2021 Annual GrowthTop Employment
Sectors Berlin’s Top 10 Industry Sectors (6-digit NAICS)
Source: EMSI, 2021
2021 2011 - 2021
NAICS Description
3 of the top 10 6-digit industry sectors Jobs % Change
in Berlin are Manufacturing related. 623110 Nursing Care Facilities (Skilled Nursing Facilities) 809 -24.5%
493110 General Warehousing and Storage 611 124.3%
• Skilled nursing care facilities rank as the
top industry sector in town, employing 902999 State Government, Excluding Education and Hospitals 527 -4.5%
over 800 people. 903611 Elementary and Secondary Schools (Local Government) 369 -3.7%
• This encompasses 58% of Berlin’s 333517 Machine Tool Manufacturing 307 -9.9%
healthcare jobs. 333613
Mechanical Power Transmission Equipment
292 24.4%
Manufacturing
• The top 3 Manufacturing sectors 903999 Local Government, Excluding Education and Hospitals 271 -9.1%
(machine tool, mechanical power 722511 Full-Service Restaurants 228 -28.9%
transmission equipment, and machine 332710 Machine Shops 221 29.8%
shops) combine to employ 820 people, Supermarkets and Other Grocery (except Convenience)
representing 41% of the industry 445110 187 -8.1%
Stores
employment.Employment Sector Growth
Berlin’s Top 10 Growth Sectors (6-digit NAICS)
Source: EMSI, 2011-2021
400
338
350
300
250
200
150
82 80 72
100 58 57 51 45 41
50
35
0
493110 - General 541512 - 452319 - All Other 621493 - 221122 - Electric 333613 - 332710 - Machine 221112 - Fossil 325412 - 333511 - Industrial
Warehousing and Computer Systems General Freestanding Power Distribution Mechanical Power Shops Fuel Electric Power Pharmaceutical Mold
Storage Design Services Merchandise Ambulatory Transmission Generation Preparation Manufacturing
Stores Surgical and Equipment Manufacturing
Emergency Manufacturing
Centers
• The general warehousing and storage sector has experienced significant growth in Berlin, adding 338 jobs since 2011, more than
4 times the amount seen in the next leading growth sector.
• This sector is the reason for the Transportation & Warehousing industry’s strong continued growth over the past decade,
accounting for 89% of the industry’s 381 net new jobs since 2011.
• It has helped the industry rise from employing 372 people in Berlin in 2011, to 753 today. It is now the town’s 5th leading
industry.
• The computer systems design services sector is the second fastest growing industry sector, adding 82 jobs since 2011. This is
boosting the Professional, Scientific & Technical Services industry growth within Berlin.
• 4 of the top 10 growth sectors are in Manufacturing, including the highly specialized and high-paying pharmaceutical preparation
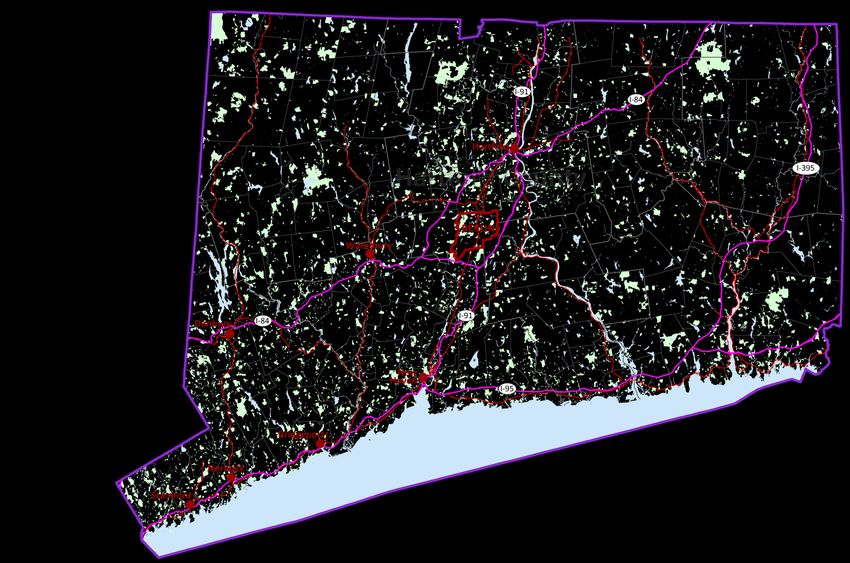
manufacturing sector, which serves New England’s growing Life Sciences industry cluster .Local Context – Development Patterns
Commercial &
Industrial Zoning
• Berlin’s Commercial districts are focused
  around the Farmington Ave. corridor and the
  Berlin Turnpike.
• The industrial zones are primarily in the
  northeastern section of town, with a few
  running along the rail line and surrounding
  the commercial districts along the southern
  portion of the Berlin Turnpike.

New Development Opportunities
3 categories:
              - Targeted Economic Development areas
               (supporting development where existing
               infrastructure and systems are already in
               place.)
              - Vacant Land (limited supply and existing
                constraints)
              - Redevelopment of existing older Commercial
                & Industrial properties

Gaps with what the market demands and what zoning currently
allows will be examined at a later stage of the POCD.
Commercial &
Industrial Inventory
Details by Land Use
Source: Town of Berlin Parcel Database, RKG Associates
COMMERCIAL
Total Assessed Property Taxes/
Parcels Acres AV/Parcel AV/acre
Value Taxes parcel
Office 86 168 $133,463,290 $1,551,899 $796,685 $4,528,409 $52,656
Retail 81 141 $98,379,736 $1,214,565 $698,564 $3,338,024 $41,210
Restaurant/bar 45 24 $23,091,042 $513,134 $980,522 $783,479 $17,411
Hotel/Motel 13 23 $9,233,700 $710,285 $398,275 $313,299 $24,100
Other 175 614 $110,203,945 $629,737 $179,504 $3,739,220 $21,367
400 969 $374,371,713 $935,929 $386,339 $12,702,432 $31,756
INDUSTRIAL
Industrial 268 1,204 $228,807,790 $853,760 $190,022 $7,763,448 $28,968
*These totals represent the current land uses within Berlin, as designated by the
town’s assessor. They do not represent the zoning.
*Actual built space (square footage) not availableTop 10 Taxpayers
Principal Taxpayers Rocky River Realty Co. Land
Source: Town of Berlin Assessors Office, Based on 2019 Grand List Source: Town of Berlin Assessors Office
Taxable Percent of Town’s
Taxpayer Assessed Taxable Assessed
Valuation Valuation
1 Rocky River Realty Co. $217,066,038 9.15%
2 Corbin Russwin Inc. $27,297,870 1.15%
3 Tomz Corporation $20,976,520 0.88%
4 Cedar Brickyard $17,076,850 0.72%
5 B & F Machine Inc. $14,214,980 0.60%
6 Stonebridge Berlin Assoc. $9,363,400 0.39%
7 Budney Industries Inc. $8,917,435 0.38%
Connecticut Natural Gas
8 $8,650,160 0.36%
Corp.
9 Budney Overhaul $8,494,970 0.36%
224 Berlin Turnpike LLC (incl.
10 $7,711,490 0.33%
Acura of Berlin)
$339,769,713 14.33%
• The top 10 taxpayers contribute to 14% of Berlin’s overall taxable property, according to the town’s assessors office.
• Rocky River Realty Company, Berlin’s top taxpayer, accounts for 9% alone.
• They own 6 parcels and 144.5 acres of land in town, with 5 of them clustered in the northeastern corner of Berlin.
• Their largest land holding is a 114-acre parcel valued at $90,000,000. It is the home of Eversource’s regional headquarters and
several other large commercial/industrial buildings.Commercial & Industrial
Building Stock
Units by Year Built
Source: Town of Berlin Parcel Database, RKG Associates
Commercial Industrial
Parcel Parcel
Year Built % of Total % of Total
Count Count
Pre 1930 51 13% 5 2%
1931 – 1959 82 21% 41 15%
1960 – 1979 68 17% 54 20%
1980 – 1999 71 18% 53 20%
Since 2000 38 10% 26 10%
N/A 90 23% 89 33%
28% and 30% of Berlin’s built commercial and
industrial stock respectively were built since 1980.Industrial Market
Connecticut/Western Massachusetts
Connecticut’s industrial market has remained strong throughout the pandemic, in
large part because of the continued strength of e-commerce and its reliance on Industrial Market
Source: Newmark Q4 2020 Industrial Market Report
large industrial distribution and warehousing facilities.
• Prices of available industrial spaces within Berlin range from $2 to $8 on Loopnet, an online
commercial listings website. $6/sf appears to be achievable within the Berlin industrial
market, with several current listings at this price.
• Over the next 12 months, Newmark projects statewide inventory to increase, vacancy to
decrease, absorption to increase, and construction activity to increase.
Hartford-West Hartford-East Hartford Industrial Market
Source: National Association of Realtors, Q1 2021 Commercial Real Estate Metro Market Report
Total Inventory New Leasing Volume Under Construction Vacancy Asking Rent Net Absorption
(SF) (SF) (SF) Rate ($/SF) (SF)
94,500,000 1,620,000 800,000 4.7% $5.50 (260,000)
Regional Market Activity
Source: Newmark Q4 2020 Industrial Market Report
Build-to-Suite Leases
Enfield: Agri-Mark; 266K SF food-grade building; 2021 Windsor: Amazon; 170K SF
Plainville: Ahold Delhaize; 250K SF multi-story freezer building; mid 2022 Orange: Amazon; 138K SF
Amazon; 129K SF
Windsor: Amazon; 1M+ SF multi-story distribution center; 2021
Bloomfield: Home Depot; 449K SF
South Windsor: Amazon; 182K SF building; 2021
Waterbury: Drew Marine; 105K SF
East Windsor: Parksite; 150K SF building; 2021
Putnam: Turning Point Energy; 65K SFCommercial Market REIS Hartford Submarket: Office
Office
Source: REIS 2000 – 2020, Hartford Submarket
$30 30%
$24.5
$25 25%
$19.7
$20 18.2% 20%
$15 17.9% 15%
$10 10%
$5 5%
$0 0%
2000 2002 2004 2006 2008 2010 2012 2014 2016 2018 2020
Class A Class B&C
REIS Hartford Submarket: Retail
Retail
Source: REIS 2000 – 2020, Hartford Submarket
$20 $18.8 12%
11.1%
10%
$15
8%
$10 6%
4%
$5
2%
$0 0%
2000 2002 2004 2006 2008 2010 2012 2014 2016 2018 2020
Asking Rent Vacancy RateLocal Considerations & Questions • What industries and jobs should Berlin focus on growing? • Should the town focus on attracting more businesses to reduce the tax burden on residents? • What does Berlin’s future economy look like? Understanding the important role manufacturing and other industrial industries have played in Berlin’s economy, do we want to preserve industrial properties? • Is the aging of the workforce a concern for the local economy if most Berlin employees by place of residence are coming from elsewhere and most Berlin residents work elsewhere?
Recent Successes
Economic Development Organizations
• Berlin Economic Development Commission
    • 7 town-elected members

• Greater New Britain Chamber of Commerce
• MetroHartford Alliance
         • The MetroHartford Alliance is an investor-based economic development partnership focused on business development
           and growth, retaining and attracting jobs and talent in targeted sectors, ensuring a strong urban core, and promoting the
           Hartford Region.
    • Hartford Chamber of Commerce
         • A MetroHartford Alliance initiative: A membership organization committed to enhancing Hartford’s business and civic
           communities .
    • HYPE
         • A MetroHartford Alliance initiative: HYPE was created in 2006 as a young professionals networking group to attract and
           retain talented individuals and successful businesses in the Hartford Region.
    • Innovation Destination Hartford
         • A MetroHartford Alliance initiative: An information hub for Connecticut-based entrepreneurs, startups, small business
           owners, and professionals. The initiative is dedicated to facilitating connections within our entrepreneurial community
           and supporting startups and second-stage companies throughout the Hartford Region.
Business Development Activity
2018 & 2019: 2020 & 2021:
• 306 new jobs added • 294 new jobs added
• 12 new businesses • 27 new businesses
• 7 business relocations into Berlin • 1 business relocation into Berlin
• 2 mixed-use developments started • 1 redevelopment
Source: Town of Berlin,
as of November 2021 • 9 business expansions • 15 business expansionsBusiness Development Activity
• Berlin’s business development Business Starts and Stops
activity (as measured by starts
and stops) tracks closely with
Wethersfield and Rocky Hill.
• Activity is higher in Southington,
which also has nearly twice as
many businesses.
Town Total Businesses
Berlin 2,979
Wethersfield 3,011
Newington 3,510
Southington 5,548 Source: CT Business / CT Data Center
Rocky Hill 2,952Targeted Economic Development Sites (TEDS) • The 2003 POCD created a Targeted Economic Development Site (TEDS)-based plan for specific parcels • The intention was to encourage development in places that best serve public interest, while protecting health and safety. • Supporting development where infrastructure and systems are already in place, rather than greenfields development, especially in Berlin’s many areas with environmental constraints such as wetlands, floodplain and excessive slope, the Town seeks to support “Responsible Growth” and “Sustainable Communities.” • The town currently has 13 TED sites, although many of these sites in limited in their development feasibility due to environmental constraints such as wetlands and steep slopes.
Targeted Economic
Development Sites (Progress)
1:   Significant wetland and floodplain area. One of the 2 areas with potential for
     development is under contract for sale to Clean Earth with plans for an
     industrial park. The other area has seen building improvements over the years
     with approvals in place for a limited amount of additional development.

2:   Major successes here. There has been significant development in this area,
     including the start of the Steele Center project by Newport Realty (discussed
     later). Many new businesses have located here, streetscape projects have
     been completed, and Deming Park was redeveloped

3:   TOMZ Corporation acquired additional land and has expanded its buildings.
     Solar arrays were constructed.

4:   Land has been assembled. Redevelopment underway at intersection of Berlin
     Turnpike and Deming Road. Mixed use Turnpike Ridge project is under
     development.

5:   Two projects in regulatory review process at same intersection (404 Berlin
     Turnpike and 550-554 Berlin Turnpike). Will include a total of 306 mixed
     income apartments, a hotel, and convenience store.
Targeted Economic
Development Sites (Progress)
6: Deming Ridge project (Metro Realty) approved here (88 mixed income units,
expected to start Spring 2022).
7: Biopellet, a manufacturing company, located and expanded a facility in this
area.
8: No change
9: A small buildings sales company located here.
10: Southernmost parcel has (2) new contractor shop buildings for several
tenants being constructed. (Priority Electric)
11: No change
12: No change
13: Stick Village development almost complete (4 of 5 buildings complete). The
majority of commercial spaces have been successfully leased. Tasca Ford
has renovated its dealership and received approval to construct a new
dealership building. OSJ (Ocean State) has renovated old plaza, relocated
their own store within plaza and tenant spaces are filling - new
amusement/restaurant use.Vacant Land and Applications Pending
• The Town has multiple vacant
parcels, many of which
comprise TED sites.
• Applications are pending at
several of those parcels.
• As with the TED sites,
development feasibility is
limited by environmental
constraints at many of these
parcels.Local Efforts
• Kensington Village
• Large TOD plan surrounding downtown Berlin’s train
station, with development efforts lead by Newport Realty
Group (headquartered in Southington).
• Made possible by a partnership with the State of
Connecticut.
• Promises new business and revitalization at 861, 889, 903
and 913 Farmington Ave.
• First project (the “Steele Center”) has a development
program including:
• $15 million mixed-use project
• 76 market rate apartments
• 19,000 SF of commercial space
• 10,000+ SF medical office space
• 8,000+ SF retail space
• All organized into 5 buildings
• Unanimously approved in September 2019
• Public voted on the name of the project in October
2019
• Construction broke ground in late 2020
• Proposed development of a boulevard connecting the
development to the Berlin Train Station.
Kensington Village TOD.
Source: CivicMoxie.comLocal Efforts
Other development projects:
• Turnpike Ridge
• 220 Berlin Turnpike, near Deming Road
• $13 million mixed-use project
• Development program includes:
• 72 market rate apartments
• 18,000 SF restaurant and retail space
• 4 new buildings planned; 1 commercial
building and 3 apartment buildings
• Construction broke ground in August 2020
• Newport Center
• A development by Newport Realty Group at
848 Farmington Ave.
• A 3-story 24,000 SF mixed-use building with
lower level commercial and upper story
residential.
• Now fully leased (commercial space was
listed at $15/SF NNN)
• This is a success story because the space
had been long vacant before being Turnpike Ridge construction
acquired. Source: Hartfordbusiness.comLocal Efforts
Tax Abatement Program:
• The town adopted a tax abatement program based upon improvements which will increase the
value of a property. This is intended to attract developers to build larger projects in Berlin. The
program has been revised over the years as market conditions have changed.
• Under the current program:
• Projects must involve either:
• Manufacturing
• Office
• Warehouse/distribution
• Information technology
• New retail developments
• Restaurants
• Recreation.
• Tax abatements are offered from 3 to 10 years, dependent upon the level of investment
within a project.Local Efforts
Building Façade Improvement Matching Grant Program:
• An economic development incentive program
offered to applicants who own or lease eligible
property located within strategic development areas.
• Up to a 50% match
• up to $50,000 for façade improvements
• Up to $1,500 for signage.
• Program ended 12/31/21
47 façade improvement projects have been completed
or were in process as of March 2021. They are all
located along the Farmington Ave. commercial
corridor, with the largest concentration in Kensington
Village near the train station.
Façade improvement projects under the current program
Source: Town of Berlin, as of March 20212021 Ribbon Cuttings and Groundbreakings
DATE Firm Location Description Notes Investement New Jobs
Ja n-21 The Pho Bar 224 Berl in Turnpike New Business Res taurant 5
146 Webster Square
Feb-21 Ba rbology New Business
Roa d Ba rber Shop 1
Ma r-21 Cuts of Wood 201 Chri s tian Lane Expa nsion Showroom - Wood Products
33 Webster Square
Ma r-21 Bra s s City Ti le New Business
Roa d Showroom - Ti le 2
Ma r-21 Sa m's Food Stores 301 Berl in Turnpike Expa nsion/Remodel Conv. Store/gas station 3
Ma r-21 Steele Center - Building 1 9 Steele Boulevard TOD PROJECT $4,750,000
Apr-21 Cl utch Ca rds & Collectibles 848 Fa rmington Avenue New Business Col l ectibles 1
Apr-21 Na ti onal Sign 780 Four Rod Road Expa nsion 23,000 s quare foot addition $1,600,000 12
Apr-21 Avenue Restaurant 958 Fa rmington Avenue Expa nsion Addi tion and handicapped entrance $400,000 3
Apr-21 Budney Industries 40 New Pa rk Drive Expa nsion 10,000 s quare foot expansion $750,000 15
Apr-21 TOMZ 47 Epi scopal Road Expa nsion 57,000 s quare foot expansion
Apr-21 Douglas Mech - Sheet Metal Div 816 Four Rod Road Expa nsion Expa nded into adjacent industrial condo 5
Apr-21 Murphy Roa d Recycling 655 Chri s tian Lane Expa nson 30,000 s quare foot expansion $25,000,000 15
1244 Fa rmington
Apr-21
Pri s tus Avenue New Business Opened children's clothing & a ccessory s tore 2
Ma y-21 Wel lness Collective 314 New Bri tain Road New Business Opened 8
Ma y-21 LAVA 892 Fa rmington Avenue New Business Opened salon 5
1204 Fa rmington
Ma y-21
Home & Ha rmony Avenue New Business Opened home décor a nd gi ft s hop 1
Jun-21 Pi cture Show 19 Fronta ge Road Reopening Reopened movi e theatre
119 Webster Square
Jun-21
P & P Na i l Roa d New Business Opened nail salon 3
1244 Fa rmington
Jul -21
Pa ra dise Nutrition Avenue New Business Opened healthy s hake shop 1
Sep-21 Northeast Peformance Institute 1400 Berl in Turnpike New Business Opened headquarters i n Berlin 3
Sep-21 Bungalow on the Ave 945 Fa rmington Avenue New Business Opened Home Décor s tore 2
Oct-21 Corners tone Restaurant 797 Fa rmington Avenue New Business New res taurant 8
Col es Road Brewing 817 Fa rmington Avenue New Business Brewery
Oct-21 Ka der Insurance Mi l l Street New Business Ins urance a gency
Oct-21 Fi tness By Design 848 Fa rmington Avenue Expa nsion Rel ocated and grow into 2,200 s quare feet 1
Nov-21 Lou & Mos Sa ndwich Shoppe 196 Berl in Turnpike New Business Sa ndwich Shoppe 4
Nov-21 The Fresh Monkee 196 Berl in Turnpike Expa nsion Grew wi thin same complex 2
120 Webster Squsare
Dec-21
Somewhere Over the Spectrum Roa d New Business Opened on Web. Square Road 7Future Considerations & Questions • Are there any other economic development tools available to position Berlin for future economic success? • In what locations should these efforts be focused? • What uses should be targeted in future development? • Does zoning match with goals/vision of future development areas? • Is more flexibility need in uses in existing commercial and industrial zones either through zoning map changes or amendments that allow added uses? • Is the BTD zone effective? Are there changes to the zone that are needed? • Are there other areas to consider for mixed-use? • Should an increase in residential density be allowed in the Kensington Village Core area 2?
Online Survey
• We will launch the POCD
  survey this month,
  following closure of the
  Housing Plan survey.
Draft Vision Statement
Berlin is a community with a small-town feel founded in a rural and
historically agrarian landscape that benefits from its location at the center
of the state. The town has a rich history, strong community, and provides a
peaceful atmosphere for its residents. Berlin will continue to grow, but in a
sustainable manner and without compromising the town’s natural resources
or outgrowing its ability to provide high-quality services to its residents.
Strong connections to the region and within town are highly valued by the
community for all modes of travel. Berlin will balance growth against
preservation of its historic landscape and village centers. The town’s village
centers, and farmland are important to the history and identity of Berlin;
protecting and improving areas such as Kensington Center will remain a
priority for the town.
Next Steps
• Launch Community engagement efforts
   • Develop press release and social media content
   • Launch online survey mid-February
   • Develop list of key stakeholders for interviews/focus group
     meetings. Continue to coordinate mapping with NEGEO
• Continue economic development and housing research
• Prepare housing research for next meeting
Meeting Topics through April • February: Economic Development, Housing and Affordable Housing • March: Facilities and Infrastructure • April: Mobility • Discussion and updates on Community Engagement progress will be conducted at all meetings
Next Meeting
• Housing: Thursday
  February 24th at 6:00 pm.
You can also read