2Q FY 2021 - Investor Presentation - November 2020 - Apollo Tyres
←
→
Page content transcription
If your browser does not render page correctly, please read the page content below
2Q FY 2021 – Investor Presentation

                                     November 2020
Disclaimer
These materials have been prepared by Apollo Tyres Limited together with its subsidiaries (the “Company”), are for informational purposes only and do not constitute a prospectus or an offer document,
or form part of an offer, solicitation or invitation of any offer to purchase or subscribe for any securities of the Company in any jurisdiction, nor should these materials or any part thereof form the basis
of, or be relied upon in any connection with, any contract, commitment or investment decision whatsoever.

These materials have not been independently verified. No representation or warranty, expressed or implied, is made and no reliance should be placed on the accuracy, fairness or completeness of the
information presented or contained in these materials. None of the Company or any of its directors, officers, affiliates, advisers or representatives accepts any liability whatsoever for any loss howsoever
arising from any information presented or contained in these materials. The information presented or contained in these materials is subject to change without notice and its accuracy is not guaranteed.

These materials contain statements that constitute forward-looking or belief statements. These statements include descriptions regarding the intent, belief or current expectations of the Company or its
management and information currently available with them including with respect to the consolidated results of operations and financial condition of the Company. These statements can be recognized
by the use of words such as “expects,” “plans,” “will,” “estimates,” “projects,” “believes,” “intends,” or words of similar meaning. Such forward-looking statements are not guarantees of future
performance and involve risks and uncertainties, and actual results may differ from those in the forward-looking statements as a result of various factors and assumptions. Neither the Company nor any
of its advisors or representatives, on behalf of the Company assumes any responsibility or obligation to update or revise forward-looking statements to reflect future events or circumstances.

In no event shall the Company be responsible to any person or entity for any loss or damage, whether direct, indirect, incidental, consequential or otherwise, arising out of access or use or
dissemination of information contained in this presentation, including, but not limited to, loss of profits. You acknowledge that you will be solely responsible for your own assessment of the market and
the market position of the Company and that you will conduct your own analysis and be solely responsible for forming your own view of the potential future performance of the business of the Company.

No representation, warranty, guarantee or undertaking (express or implied) is made as to, and no reliance should be placed on, the accuracy, completeness or correctness of any information, including
any projections, estimates, targets and opinions, contained herein, and no liability whatsoever is accepted as to any errors, omissions or misstatements contained herein and, accordingly, none of the
Company, its advisors and representative and any of its or their affiliates, officers, directors, employees or agents, and anyone acting on behalf of such persons accepts any responsibility or liability
whatsoever, in negligence or otherwise, for any loss or damage, direct, indirect, consequential or otherwise arising directly or indirectly from use of this presentation or its contents or otherwise arising in
connection therewith.

This presentation includes certain industry data and projections that have been obtained from industry publications and surveys. Industry publications and surveys and forecasts generally state that the
information contained therein has been obtained from sources believed to be reliable, but there is no assurance that the information is accurate or complete. Neither the Company nor any of its advisors
or representatives have independently verified any of the data from third-party sources or ascertained the underlying economic assumptions relied upon therein. All industry data and projections
contained in this presentation are based on data obtained from the sources cited and involve significant elements of subjective judgment and analysis, which may or may not be correct. For the reasons
mentioned above, you should not rely in any way on any of the projections contained in this presentation for any purpose.

The distribution of these materials in certain jurisdictions may be restricted by law and persons into whose possession these materials comes should inform themselves about and observe any such
restrictions.

THIS PRESENTATION AND INFORMATION CONTAINED HERE IS NOT INTENDED FOR PUBLICATION OR DISTRIBUTION IN, AND DOES NOT CONSTITUTE AN OFFER OF SECURITIES IN,
THE UNITED STATES. NO SECURITIES OF THE COMPANY HAVE BEEN OR WILL BE REGISTERED UNDER THE U.S. SECURITIES ACT OF 1933, AS AMENDED, OR WITH ANY SECURITY
REGULATORY AUTHORITY OF ANY STATE OR OTHER JURISDICTION OF THE UNITED STATES AND, ACCORDINGLY, MAY NOT BE OFFERED, SOLD, PLEDGED OR OTHERWISE
TRANSFERRED WITHIN THE UNITED STATES EXCEPT PURSUANT TO AN EXEMPTION FROM REGISTRATION UNDER THE SECURITIES ACT OR PURSUANT TO AN EFFECTIVE
REGISTRATION UNDER THE SECURITIES ACT AND/OR ANY APPLICABLE U.S. STATE OR LOCAL SECURITIES LAWS.

By accessing this presentation, you accept that this disclaimer and any claims arising out of the use of the information from this presentation shall be governed by the laws of India and only the courts in
New Delhi, India, and no other courts, shall have jurisdiction over the same.

 apollotyres.com                                                                                                                                                                                    2
Table Of Contents
                                             Page #

 1       Company Overview & Highlights         4

 2       COVID-19 Update                      11

 3       Key Near-Term Areas of Focus         16

 4       Quarter Update (2Q FY 2021)          22

  5      Key Financials                        29

apollotyres.com                          3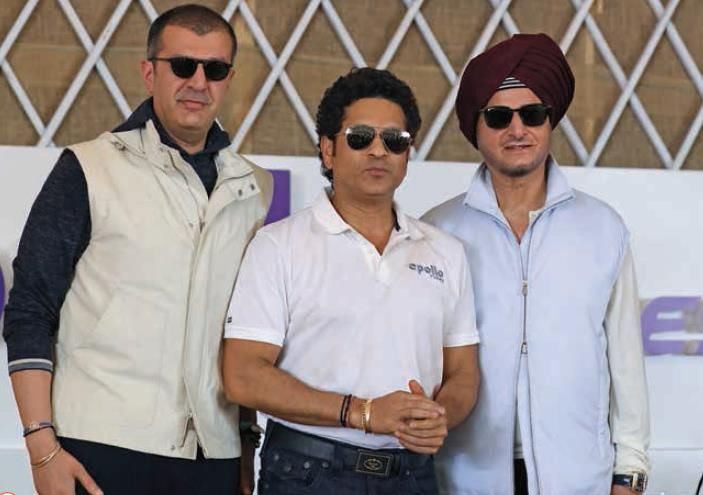
Apollo Tyres – The No 1 Radial Tyre Player in India
Revenue Mix – Consolidated 2Q FY 2021
Large scale & sustained profitability profile
Consolidated Revenue of ~₹161 Bn in FY 2020 By Product By Channel
Consolidated EBITDA of ~₹19 Bn (12%) in FY 2020
Light Others, 5%
Truck, 5%
Strong brands with leading market positions Farm / Off OEM, 16%
Highway,
Apollo Tyres: #1 in Truck & Bus & #2 in Passenger 11%
Truck &
vehicles in India Bus, 43%
Vredestein: Dominant position in fast growing all
Passenger Replacement, 84%
Vehicle, 36%
season PCLT segment
Robust manufacturing and R&D footprint Revenue Mix – India 2Q FY 2021
7 Manufacturing Plants (India: 5, Europe: 2)
2 R&D centres (Asia/Europe) and 1 Satellite centre By Product By Channel
Light Commercial Others, 8% Exports,
Deep distribution network built over time Vehicle, 7% 9%
~6,600 dealers in India; Added +350 dealers in 1HFY21
Agri, 7%
~6,500 dealers across Europe; Added +200 dealers in OEM, 16%
1HFY21 Truck &
Passenger Bus, 60%
Vehicle,
18%
Replacement, 74%
Strong supportive ecosystem of talent
~18,000 employees
apollotyres.com 4
Well Set to Leverage Attractive Market Opportunity

                                 Key milestones over past ~10 years
                                                                                                                Past Decade
                                                                                                       Significant investments made in
                                                                                 2020                        building brand, plant
                                                                 2018
                                                                                                       infrastructure, distribution, and
                                                                                                                R&D capability

                                                 2017
                                                                                                                    Today
                                                                                                        Enjoy leading market position
                                 2010                                         Commenced
                                                                                                        and industry-leading capacity
                                                                              production in
                                                                Completed        Andhra                having made timely investments
                                                                doubling of   Pradesh plant
                                                               TBR capacity                               Approaching end of current
                                               Commenced        in Chennai
                   2009                        production in                                           capex cycle and with continued
                                                                   plant      Raised equity
                                               Hungary plant                                             focus on key building blocks
                                                                               capital from
                               Commenced                                        Warburg                       (R&D, Distribution,
                               production in                                    Pincus to              Branding/Marketing, etc.), well
                               Chennai plant                                   strengthen               placed to capitalize on growth
                                                                              balance sheet                opportunity going forward
                   Acquired                                                     and fund
                  Vredestein                                                      growth
                   brand in
                    Europe

                          Focus on free cash flow generation, de-leveraging balance sheet and improving return ratios
                                                 along with market share gains across key segments

apollotyres.com                                                                                                                    5
Strong Management Team with Deep Experience

         Onkar S Kanwar              Neeraj Kanwar               Hizmy Hassen               Markus Korsten               Gaurav Kumar                Daniele Lorenzetti
           Chairman &               Vice Chairman &                IT & Digital                Advanced                  Finance & Legal                Research &
         Managing Director          Managing Director                                       Manufacturing &                                             Technology
                                                                                               European
                                                                                             Manufacturing
                                                                                               Operations
                                                               Years with Apollo: -        Years with Apollo: 7       Years with Apollo: 16          Years with Apollo: 4

    Pedro Matos             PK Mohamed                  K Prabhakar           Benoit Rivallant         Sunam Sarkar               Yoichi Sato               Satish Sharma
  Global Programme       (Advisor) Technology             Projects          European Operations         CSR, Human           Quality, Health, Safety      Asia Pacific, Middle
   Management &                                                                                        Resources, IT,           & Environment                    East &
European OE Business                                                                                Procurement & Supply                                   Africa Operations
                                                                                                           Chain

 Years with Apollo: 6    Years with Apollo: 44   Years with Apollo: 31      Years with Apollo: 6     Years with Apollo: 21    Years with Apollo: 2       Years with Apollo: 23

   apollotyres.com                                                                                                                                               6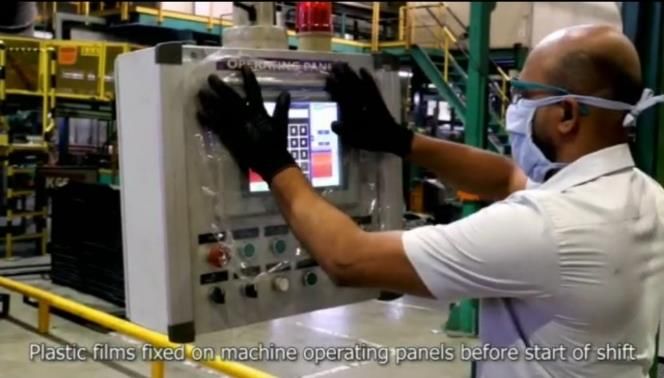
Experienced Board of Directors with Wide Expertise

 Onkar S Kanwar            Neeraj Kanwar           Anjali Bansal             Akshay            Francesco Crispino          Francesco Gori          Vishal Mahadevia
                                                                           Chudasama
   Chairman &             Vice Chairman &       Former Partner and       Managing Partner          Co-Founder               Former-CEO               MD, Head of
 Managing Director        Managing Director         India MD            Shardul Amarchand      Greater Pacific Capital         Pirelli            Warburg Pincus India
   Apollo Tyres             Apollo Tyres        TPG Private Equity       Mangaladas & Co

                                                Independent Director    Independent Director   Independent Director       Non Independent           Non Independent
                                                                                                                              Director                  Director

 Vikram S Mehta             Vinod Rai             Sunam Sarkar             Satish Sharma            Pallavi Shroff        Gen. Bikram Singh         Robert Steinmetz
                                                 President & Chief                                                                                    Former Head of
 Former Chairman        Former Comptroller            Business           President – APMEA         Managing Partner      Former Chief of Indian   International Business
 Shell Group India     and Auditor General of   Officer, Apollo Tyres       Apollo Tyres          Shardul Amarchand             Army                  Continental AG
                               India                  Holdings                                     Mangaladas & Co
                                                (Singapore) Pte Ltd
Independent Director   Independent Director      Non Independent          Non Independent        Independent Director    Independent Director       Non Independent
                                                      Director                Director                                                                  Director

   apollotyres.com                                                                                                                                          7
Investment Highlights
Positive industry dynamics
Robust demand momentum in replacement segment
India in rapid phase of radialization trend – strong underlying growth profile
Attractive market structure consolidating around strong, established domestic brands
Restriction on imports have further added to market attractiveness for domestic producers
Clear roadmap to healthy profit levels in Europe
Specialisation of Dutch plant would lead to significant improvement in cost competitiveness
Improvement in product mix in PCLT segment
European business gaining market share in focused categories (UHP PCLT / UUHP PCLT / TBR / Agri)
A strong portfolio of brands with leadership positions
Volume and price leadership in Truck & Bus (India)
Gaining market share in other segments (e.g. Passenger vehicles, 2W) & Geographies (e.g. Vredestein in
Europe)
apollotyres.com 8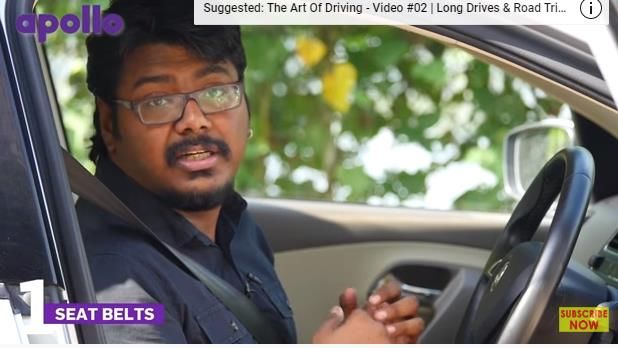
Investment Highlights
Strong execution in challenging market environment
Both revenues and profits higher than prior year for last quarter, despite COVID-19
Continue to gain share in replacement and OE markets in India
Efficient working capital management also contributed to free cash flow generation
Digital launches helped reduce fixed costs and also leverage new age marketing tools
Despite headwinds because of Covid-19, ensured timely commercialization of Andhra Pradesh plant
State of art production facilities and continued focus on R&D
State of art facilities with focus on automation have helped achieve manufacturing excellence
Podium position in European PCLT test results
Backed by long-term private equity investor
apollotyres.com 9
Table Of Contents
                                              Page #

 1       Company Overview & Highlights          4

 2       COVID-19 Update                       11

 3       Key Near-Term Areas of Focus          16

 4       Quarter Update (2Q FY 2021)           22

  5      Key Financials                         29

apollotyres.com                          10
Performance During COVID-19
India
Strong demand momentum across key segments
Recorded best ever volumes in Truck & Bus replacement and Passenger vehicle replacement in September 2020
Recorded best ever volumes in Agri (tractor rear) replacement in June 2020
Enthusiastic response to recent launches in 2W segment
In first five months of FY21 gained ~500bps market share in Passenger vehicle / Agri and ~350bps market share in
Truck & Bus segment (as per internal estimates)
OEM demand started recovering towards the end of 2QFY21.
Expanded distribution footprint (+350 dealers in 1HFY21). Touch points in Rural India more than tripled in 1HFY21
Maintained strong operating performance, reporting EBITDA margin of 19% in 2QFY21 and 16% in 1HFY21
Europe
Witnessed market recovery and expanded customer base (added +200 customers in 1HFY21)
Maintained revenues at same level as last year despite tough environment
Market share gains - 12 bps in UHP / UUHP PCLT segment, 23bps in TBR segment & 25bps in Agri segment
1HFY21
Introduced 2 new product ranges in winter and all season segments with podium positions
In advanced stages of plant specialisation, which would lead to significant improvement in cost competitiveness
apollotyres.com 11Performance During COVID-19
Cash flows
Generated free cash flow (consolidated) of ₹ ~9.1bn during 1HFY21, driven by
Recovery in top line performance and control over costs
Reduced finished goods inventory (consolidated) by 30% (compared to Mar’20) and RM inventory by 7%
(compared to Mar’20) leading to efficiency in working capital
Reduction in capex
Fund mobilization
Raised ₹ 10.8bn from a top private equity Investor
Raised debt in early part of 1QFY21 at competitive rates to adequately strengthen the liquidity position at the onset of
Covid-19 crisis
Balance sheet deleveraging
Reduced net debt from ₹ 60bn (Mar ’20) to ₹ 46bn (Sept ‘20), helped by
Positive free cash flow generation
Well timed fund raise
Net Debt / EBITDA (TTM) stands at 2.4x as on 30 Sep’20 (3.2x – Mar ‘20)
apollotyres.com 12Dealing with COVID-19 – Employee Initiatives
Employee Engagement, Recognition and Welfare
apollotyres.com 13Dealing with COVID-19 – Resuming production apollotyres.com 14
Table Of Contents
                                              Page #

 1       Company Overview & Highlights          4

 2       COVID-19 Update                       11

 3       Key Near-Term Areas of Focus          16

 4       Quarter Update (2Q FY 2021)           22

  5      Key Financials                         29

apollotyres.com                          15
Key Near-Term Areas of Focus
Strong focus on business fundamentals
Consolidating position in India with 3R strategy
Range – A formidable portfolio that allows leadership position in India and a wider footprint in export markets
Rural – New distribution formats facilitating access to untapped markets
Retail – Focus on Branded Retail Format
Focus on premium (UHP / UUHP PCLT) segments in Europe
Continued investments in brand building and R&D
Ramp up of Andhra Pradesh Plant
Cost control & rationalisation
Focus on fixed cost reduction
Supply chain initiatives like network re-design etc, to help reduce costs while optimizing working capital
Cost competitiveness from planned specialisation of Dutch plant
Focus on improving return on capital profile, reducing leverage ratios and generation of positive free cash flow
apollotyres.com 16Key Near-Term Areas of Focus
Thrust on Digitalisation
Focus areas - Process digitalization, Business Model Innovation and Social media use in media mix
Multiple digital product launches across regions
Focus on raw materials
R&D focus on new recipes to a) boost performance and b) reduce input costs
De-risking business model from a) single source suppliers and b) dependence on specific countries for certain inputs
Focus on strategic tie ups for RM sourcing
Focus on capex and balance sheet
Control over capex and capital allocation
Focus on sweating assets, generating positive free cash flows and improving RoCE
Balance sheet deleveraging to be a key focus area
Focus on improving return on capital profile, reducing leverage ratios and generation of positive free cash flow
apollotyres.com 17Focus on Brand Building
Global brands with a legacy of performance, quality, trust and reliability
Most Valuable Indian Brands (2019) –
Brand Finance
Rank 53
Rank 69
Rank 93
Apollo MRF JK
Onboarded “God of Cricket” as
Apollo Tyres’ Brand Ambassador
apollotyres.com 18Focus on Brand Building
Customer engagement activities
Bad road buddies Track day in Hungary
Devil’s circuit Art of driving videos
apollotyres.com 19Expanding Footprint in Rural India
Total rural outlets (including sub dealers)
5,000
4,150
4,000
3,000
2,000
1,230 1,350
1,000
0
FY19 FY20 Sept '20
apollotyres.com 20Table Of Contents
Page #
1 Company Overview & Highlights 4
2 COVID-19 Update 11
3 Key Near-Term Areas of Focus 16
4 Quarter Update (2Q FY 2021) 22
5 Key Financials 29
apollotyres.com 21Key Marketing Initiatives and Customer Wins
India
Continued focus on gaining new customers and deepening ties with existing customers in the OEM segment
Started deliveries to Kia India
Secured fitment on almost all recently launched SUVs - Hyundai Creta , Tata Gravitas & Toyota Urban Cruiser
Secured fitment of TBR on Tata Signa 5528
Tata’s new generation LCV launched on Apollo Endurace tyre
Continued focus on strengthening market position in replacement segment
Continue to make strong gains in the Passenger vehicle and tractor rear segment
Strong response to high end 2W radial tyre (Alpha) launch
Europe
Growing OE penetration has helped grow share of car dealer business (revenue share of car dealer business grew
by 40bps in 1HFY21)
Gained market share in UHP / UUHP PCLT segments resulting in improvement in sales mix (~360 bps increase in
UHP/UUHP revenue share in total PCLT)
Podium positions in test results
apollotyres.com 22Podium Positions in Europe
Date Test Agency Recommendation Position Tyre Model
Apr-20 ADAC Recommendable 4th Vredestein Vorti
Apr-20 AutoBild Top 50 Exemplary 4th+5th Vorti and Aspire XP
Apr-20 AutoBild Allrad Exemplary 3rd Vredestein Ultrac Satin
Apr-20 AutoBild Sportscars Good 4th Vredestein Vorti
Apr-20 AutoMotorSport Good 4th Vredestein Vorti
Sep-20 Consumer Reports Recommendable 2nd Vredestein Hitrac
Sep-20 Consumer Reports Recommendable 3rd Vredestein Pinza AT
Sep-20 ADAC Recommendable 3rd Vredestein Wintrac Pro
Sep-20 AutoMotorSport Exemplary 3rd Vredestein Wintrac Pro
Sep-20 AutoBild Top 32 Exemplary 2nd Vredestein Quatrac
Oct-20 AutoBild Allrad Exemplary 3rd Vredestein Wintrac Pro
Podium positions are key driver of improvement in market share, price positioning and profitability
apollotyres.com 23Operating Highlights – Consolidated
Sales (₹ Mn) EBITDA Margin (%)
43,000 20%
42,338
16.2%
16%
41,000
39,261 12% 10.8%
39,000
8%
37,000
4%
35,000 0%
2QFY20 2QFY21 2QFY20 2QFY21
Topline performance driven by demand recovery both in India and Europe
Margin performance helped by a) recovery in topline, b) subdued RM cost and c) control over costs
Among the key subsidiaries, Reifencom GmbH reported16% YoY growth in topline
apollotyres.com 24Operating Highlights – India
Sales (₹ Mn) EBITDA Margin (%)
29,000 20.0% 18.8%
28,614 18.0%
28,500
16.0%
14.0%
28,000 11.7%
12.0%
27,500 10.0%
27,150
8.0%
27,000
6.0%
4.0%
26,500
2.0%
26,000 0.0%
2QFY20 2QFY21 Q2FY20 Q2FY21
Volume
Almost all product segments posted double digit volume growth (YoY) in replacement segment
Even in OEM we saw volume growth in key product segments in September 2020
EBITDA margins were supported by a) recovery in topline, b) improvement in sales mix, c) lower RM cost and d)
control over fixed costs
Have undertaken an employee optimization exercise across geographies resulting in a one off expense in 2QFY21
apollotyres.com 25Operating Highlights – Europe1
Sales (€ Mn) EBITDA Margin (%)
130 129 129 12.0%
125
9.0%
9.0%
120
6.7%
115 6.0%
110
3.0%
105
100 0.0%
2QFY20 2QFY21 2QFY20 2QFY21
Maintained YoY revenue despite subdued demand environment
Gained market share in UHP and UUHP PCLT segments
Margin supported by mix improvement, lower RM cost and cost containment measures
apollotyres.com Notes: 26
1. Includes only sales and manufacturing operations , excl. Reifencom GmbH (Distribution business)Consolidated Cash Flow & Balance Sheet Highlights
Control over capex Free cash flow generation
Capex (₹ Bn) Free Cash flow (₹ Bn)
20 15
16
9.1
16 10
12 5
-
8 6 1HFY20 1HFY21
(5)
4
(10)
- -9.5
1HFY20 1HFY21 (15)
Notes:
1. Free Cash Flow: Cash from operating activities less capex, interest and lease payments
Further strengthened balance sheet
70.0 4.0
60.3
60.0
52.3 3.5
50.0 45.7
40.0 3.2 3.1 3.0
30.0
2.5
20.0
2.4
10.0 2.0
FY20 1QFY21 2QFY21
Net Debt (₹ Bn) Net Debt to EBITDA (x)
apollotyres.com 27Table Of Contents
Page #
1 Company Overview & Highlights 4
2 COVID-19 Update 11
3 Key Near-Term Areas of Focus 16
4 Quarter Update (2Q FY 2021) 22
5 Key Financials 29
apollotyres.com 28Profit & Loss – Consolidated
Particulars (₹ Mn) 2QFY21 2QFY20 1QFY21 % Change - YoY % Change - QoQ
Net Sales 42,338 39,261 28,282 8% 50%
Other operating Income 489 597 452 -18% 8%
Raw Material 1 23,014 22,442 16,308 3% 41%
Staff Cost 6,233 5,943 5,370 5% 16%
Other Costs 6,632 7,154 4,684 -7% 42%
EBITDA 6,948 4,320 2,373 61% 193%
EBITDA Margin 16.2% 10.8% 8.3%
Depreciation 3,312 2,742 3,091 21% 7%
Other Income 385 40 268
EBIT 4,020 1,618 -450 148% -993%
EBIT Margin 9.4% 4.1% -1.6%
Interest 1,167 640 1,172 82% 0%
Tax 793 148 -276
PAT 2,000 831 -1,346
PAT Margin 4.7% 2.1% -4.7%
apollotyres.com Notes: 29
1. Raw material includes cost of material consumed, purchase of stock in trade and change in inventoriesProfit & Loss – Standalone
Particulars (₹ Mn) 2QFY21 2QFY20 1QFY21 % Change - YoY % Change - QoQ
Net Sales 28,614 27,150 17,273 5% 66%
Other operating Income 489 597 452 -18% 8%
Raw Material 1 16,808 17,464 10,901 -4% 54%
Staff Cost 2,165 2,004 1,957 8% 11%
Other Costs 4,646 5,027 2,961 -8% 57%
EBITDA 5,483 3,252 1,905 69% 188%
EBITDA Margin 18.8% 11.7% 10.8%
Depreciation 1,743 1,486 1,715 17% 2%
Other Income 303 15 153
EBIT 4,043 1,780 344 127% 1077%
EBIT Margin 13.9% 6.4% 1.9%
Interest 1,018 513 1,028 98% -1%
Tax 815 270 -148
PAT 2,162 998 -536
PAT Margin 7.4% 3.6% -3.0%
apollotyres.com Notes: 30
1. Raw material includes cost of material consumed, purchase of stock in trade and change in inventoriesTHANK YOU For further details please feel free to get in touch with the IR team Ravi Shingari Group Head - Accounts and Taxation ravi.shingari@apollotyres.com +91 9810300390 Himanshu Sharma Divisional Head - Investor Relations himanshu.sharma1@apollotyres.com +91 9167661692 apollotyres.com 31
You can also read