A Comparison of Incremental Running Field and Treadmill Tests in Young Soccer Players
←
→
Page content transcription
If your browser does not render page correctly, please read the page content below
Journal of Human Kinetics volume 73/2020, 193-201 DOI: 10.2478/hukin-2019-0143                       193
                     Section III – Sports Training

                       A Comparison of Incremental Running Field
                       and Treadmill Tests in Young Soccer Players

                                            by
            Yusuf Köklü1, Utku Alemdaroğlu1, Ramazan Demirhan1, Yunus Arslan1

          The purpose of this study was to compare the incremental running tests performed by young soccer players on
a treadmill (Tr) and in the field (FTcod: 100 m change of direction and FTcir: 100 m circle). Nineteen players (average age
17.4 ± 1.1 years; body height 172.0 ± 5.7 cm; body mass 68.9 ± 6.7 kg) volunteered to perform incremental Tr , FTcod
and FTcir running tests. In all three tests, players ran for 3 min at 8, 10, 12 and 14 km∙h-1 and were given a 1 min rest
interval between subsequent stages. Blood lactate concentrations (La-) were measured at 1 min rest intervals and the
heart rate (HR) responses of players were recorded during the tests. After a 5 min recovery period, the second part of the
test started; players ran at 15 km∙h-1 with velocity increments of 1 km∙h-1 every 1 min until exhaustion. This part was
performed to determine maximum HR, maximum La- and the players’ final velocities. The results showed that players
had significantly lower La- (F = 6.93, p = 0.07, η2 = 0.46, 95%CI(TR-FTcir) = -1.91/-0.34, 95%CI(TR-FTcod) = -1.59/-0.05) and
HR (F = 9.08, p = 0.02, η2 = 0.53, 95%CI(TR-FTcir) = -6.98/-1.68, 95%CI(TR-FTcod) = -7.19/1.08) responses in the Tr test than
in the FTcir and FTcod tests at 14 km∙h-1. It was also found that players completed the Tr test (F = 58.22, p = 0.00, η2 =
0.87) at higher final running velocities than the FTcir (95%CI(TR-FTcir) = 1.67/2.78) and FTcod (95%CI(TR-FTcod) = 1.69/2.85)
tests. In conclusion, when coaches or sports scientists plan to train at higher running velocities or according to the final
velocity in the test, it is advisable to carry out testing in the circumstances under which training will be carried out (in
the field or on a treadmill).
Key words: heart rate, running velocity, blood lactate, running tests.

Introduction                                                              endurance capacity of players is frequently tested
        Soccer coaching has a particular focus not                        by coaches and training programs are being
only on the technical characteristics of soccer                           developed to improve it.
players, but also on the development of physical                                   Field and laboratory test protocols are
capacities such as muscular strength, speed and                           used to determine the endurance capacity of
endurance (Metaxas et al., 2005). During a match,                         players (Jemni et al., 2018). Most of these tests are
soccer players cover a total distance of 9.2–12.3                         continuous types, while some of them are interval
km including 542-1168 m of high speed running                             in nature with short recovery phases (Jemni et al.,
and they also perform 11.2 – 23.2 sprints and 553-                        2018; Metaxas et al., 2005). A common feature of
629 accelerations (Castagna e al., 2017;                                  these tests is that players start at low running
Ingebrigtsen et al., 2015; Mallo et al., 2015).                           velocities which gradually increase. The stages of
Therefore, soccer players need a well-developed                           tests consist of 3-5 min running (Castagna et al.,
endurance capacity considering that such short                            2010; Kunduracioglu et al., 2007) with 1-2 min
high-intensity movements need to be repeated                              recovery intervals in between (Aslan et al., 2012;
with comparative quality for the duration of the                          Castagna et al., 2010; Krustrup et al., 2003).
match, no matter how long distance a player has                           Endurance capacity tests in the laboratory are
covered (Stolen et al., 2005). For this reason,                           usually performed on a treadmill as a gold

1   - Pamukkale University, Faculty of Sport Sciences, Denizli, Turkey.

Authors submitted their contribution to the article to the editorial board.
Accepted for printing in the Journal of Human Kinetics vol. 73/2020 in July 2020.
194                                                 A Comparison of Incremental Running Field and Treadmill Tests

standard (Aziz et al., 2005), while field tests are          compared laboratory test results with those of
performed using test areas of different shapes,              change of direction and circular field tests.
such as a circle (Aslan et al., 2012), shuttle               Therefore, the aim of this study was to compare
(Castagna et al., 2010b; Ingebrigtsen et al., 2014;          the results of laboratory (treadmill) and two
Thomas et al., 2016), hexagon (Kunduracioglu et              different field tests (100 m change of direction and
al., 2007) and a 400-m tartan track (Hoppe et al.,           100 m in a circle) in young soccer players. It was
2013). During these tests, internal loads (such as           hypothesized that the laboratory test would result
maximal oxygen uptake (VO2max), blood lactate                in different results for internal and external loads
concentration (La-), heart rate response and rating          compared to the field tests.
of perceived exertion level values for the running
velocity) and external loads (such as final running
                                                             Methods
velocities) are recorded.                                    Participants
         Although both field and laboratory tests                 Nineteen male young soccer players (average
are used to determine the endurance capacity of              age: 17.6 ± 1.1 years; body mass: 68.9 ± 6.7 kg;
players, comparative studies show that there are             body height: 172.0 ± 5.7 cm; training experience:
some differences between field and laboratory test           6.8 ± 1.7 years) voluntarily participated in this
results (Di Michele et al., 2009; Higino et al., 2017;       study. All players were members of the same
Hoppe et al., 2013; Kunduracioglu et al., 2007).             youth team competing in a second division team
For example, Higino et al. (2017) compared values            in an elite academy league. Players trained for
for VO2max and peak velocity of young soccer                 five days a week, each session lasting for 1.5 h as
players in the field (Shuttle Run Test and                   well as an official match at the weekend.
Carminatti’s Test) and laboratory (Incremental                        Written informed consent was obtained
Treadmill Test). They revealed that there were               from all the participants and their parents. All
differences in the values of VO2max as determined            players and parents were notified regarding the
by the Incremental Treadmill Test and the Shuttle            research procedures, requirements, benefits, and
Run Test, as well as lower peak velocities in the            risks before giving informed consent. The study
Shuttle Run Test compared to peak velocities in              was approved by the Pamukkale University
the treadmill test and the Carminatti’s Test. In             Ethics Committee, and was conducted in a
another study, Kunduracioglu et al. (2007)                   manner consistent with the institutional ethical
compared HR and La- responses of young soccer                requirements for human experimentation in
players in treadmill and (hexagonal) field tests at          accordance with the Declaration of Helsinki.
fixed running velocity. They reported that HR and            Procedures
La- responses were higher in the field than in the                    All soccer players who participated in the
treadmill test at the same running velocity.                 study were firstly measured for body height and
Moreover, Metaxas et al. (2005) compared VO2max              mass. Then players were randomly divided into
values of young soccer players in the Yo-Yo field            three groups: on the first day one group was
(Yo-Yo Intermittent Endurance test and Yo-Yo                 chosen to perform the treadmill test while the
Endurance test) and laboratory treadmill tests.              second group completed the change of direction
They found that the determination of VO2max in               field test and the third group the circular field
soccer players using treadmill exercise tests was            test. The groups subsequently performed the
more accurate than in the Yo-Yo field tests.                 other tests with 48-h intervals. Players wore the
     Although laboratory tests to determine                  same shoes for each test. Before each test a 10-min
endurance capacity provide more accurate results,            standardized warm up was performed, that
it seems that field tests are more useful as they            consisted of low intensity running, striding, and
include activities similar to training and match             stretching. All measurements for each player were
conditions (Jemni et al., 2018). However, the                completed within two weeks during the
number of studies comparing the endurance                    competitive period. The test protocol used for
capacity of players with field and laboratory tests          laboratory and field tests in this study was
is limited and controversial (Aziz et al., 2005;             modified from Castagna et al. (2010a). Validity
Higino et al., 2017; Hoppe et al., 2013; Metaxas et          and feasibility of the test protocol was tested and
al., 2005). To our knowledge, no study has                   verified by Castagna et al. (2010a) and Krustrup et

Journal of Human Kinetics - volume 73/2020                                                   http://www.johk.pl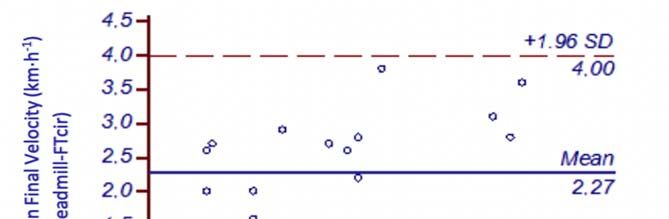
by Yusuf Köklü et al.                                                                                    195

al. (2003). The relative humidity was no more than        (Prosport TMR ESC 1100, Tumer Engineering,
50% in the laboratory and the field and the               Ankara, Turkey) were used to control the running
temperature remained between 22.1 and 24.2ºC              velocity.
during the tests. The field tests were performed          Heart Rate Measurement
on an artificial grass pitch. The laboratory and                   Each player’s heart rate (HR) was
field tests were carried out at a similar time of the     recorded at five-second intervals during the
day in order to have similar chronobiological             laboratory and field tests using short-range radio
characteristics (Drust et al., 2005). During the          telemetry (Polar Team Sport System, Polar Electro
tests, HR responses were recorded. Blood samples          Oy, Finland). The average HR during the last
(5 μL) were taken from the earlobes of players            minute of each stage was taken as the
before tests, after each stage (at velocities of 8, 10,   representative HR for that stage. In addition, after
12, 14 km∙h-1) and at the end of the tests. Also, the     the outliers were excluded, the highest HR
players’ final running velocities were recorded.          measurement during the tests was recorded as the
Anthropometric Measurements                               maximum HR.
          Players reported to the laboratory at 9 am.     Blood Sampling
On entering the laboratory, body height (cm), and                  Blood samples were taken from the
body mass (kg) measurements were taken for                players’ ear lobes during the 1 min rest intervals
each player. Body height was measured using a             between the running stages. Additionally, blood
stadiometer with accuracy to 1 cm (SECA,                  samples were also taken before players started
Germany), while electronic scales (SECA,                  each test and 3 min after the end of the test. Blood
Germany) accurate to 0.1 kg were used for body            samples were immediately analyzed using
mass measurements.                                        portable     analyzers      (Lactate   Plus,   Nova
The Laboratory Test                                       Biomedical, Massachusetts, USA) which had been
          Players completed the laboratory test on a      previously calibrated and validated (Tanner et al.,
motorized treadmill (Cosmed, Gambettola, Italy).          2010).
All players were familiar with test protocols and         Statistical Analysis
treadmill running technique. The test consisted of                  All results are reported as means (M) and
two parts. The first part consisted of 3 min stages       standard deviation (SD). To assess accuracy and
at 8, 10, 12, and 14 km∙h-1 interspersed with 1 min       reliability between the laboratory and the 2 field
intervals of passive rest. After a 5 min recovery,        tests, 95% limits of agreement (95% LOA), (Bland
the second part of the test commenced, in which           and Altman, 1986, 1999) and the coefficient of
the players ran at 15 km∙h-1 with velocity                variation (CV) (Atkinson and Nevill, 1998) were
increments of 1 km∙h-1 every 1 min until volitional       calculated, respectively. The Bland–Altman
exhaustion.                                               method was used to calculate bias and the 95%
Field Tests                                               limits of agreement (Bias ± 1.96 x Sd). The 95%
          The field tests were performed on an            limits include 95% of the difference between the
artificial grass pitch in two formats: a 100 m run        two measurement methods used (Myles and Cui,
with 180º change of direction (FTcod) and a 100 m         2007). The CV value ( 0.05). Effect–Size Correlations (ES) were
during which players ran at 15 km∙h-1 with                calculated to determine practical differences (η2,
velocity increments of 1 km∙h-1 every 1 min until         where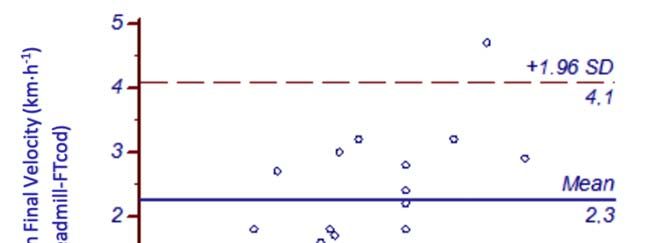
196                                                     A Comparison of Incremental Running Field and Treadmill Tests

was applied to make pairwise comparisons                          between the Tr and FTcod tests (0.8 ± 2.4; 95%CI(TR-
between the laboratory and the 2 field tests. The                 FTcod) = -1.59/-0.05). The post hoc analyses confirmed

level of statistical significance was set at p < 0.05.            that the blood lactate responses tested by FTcir and
                                                                  FTcod were higher than the responses during the
Results                                                           Tr test at 14 km∙h-1 running velocity.
         The means (±SD), CV (%) and 95% LOA                                 Table 2 displays mean (±SD), CV (%) and
values for blood lactate responses (mmol) for the                 95% LOA values for HR and HRmax responses
first parts of the Tr, FTcir and FTcod tests are                  (bpm) for all participants to the first part of the Tr,
presented in Table 1. For the blood lactate                       FTcir and FTcod tests. HR values obtained during
responses at 12 km∙h-1 and 14 km∙h-1, the 95% LOA                 the Tr (135.5 ± 10.5), FTcir (135.8 ± 12.6) and FTcod
values suggest an underestimation of the Tr test                  (134.9 ± 11.6) tests were very similar at the slowest
compared to both FTcir (by 0.3 ± 1.7 and 1.2 ± 2.6,               velocity (8 km∙h-1), whereas at 10, 12, and 14 km∙h-
                                                                  1, the 95% LOA showed an underestimation of the
respectively) and FTcod (by 0.3 ± 2.0 and 0.8 ± 2.4,
respectively); the same results were recorded for                 Tr test compared to both FTcir (by 1.0 ± 14.5, 2.8 ±
the maximum blood lactate responses, which                        11.2, and 4.4 ± 8.0, respectively) and FTcod (by 0.5 ±
differed by 0.7 ± 4.0 for Tr versus FTcir and by 0.7 ±            21.1, 1.8 ± 19.0, and 3.0 ± 12.9, respectively).
4.3 for Tr versus FTcod. The intermeasurement CV                  Furthermore, the maximum HR responses tended
values for Tr and FTcir test blood lactate responses              to be lower in the FTcir (193.7 ± 8.6) and FTcod
ranged from 18.3 to 44.6%, while those for the Tr                 (194.57 ± 7.8) tests compared to the Tr test (197.2 ±
and FTcod tests ranged between 19.6 and 51.8%.                    7.1). For this finding, ES presented large
The only statistically significant differences for                magnitude of change (η2 = 0.52) according to
blood lactate responses were found for tests at 14                Cohen’s thresholds, and CV values for HR
km∙h-1 (F = 6.93, p = 0.07, η2 = 0.46, η2 represents              responses between Tr and FTcir tests (CV = 1.9 -
medium magnitude of change) between the Tr                        3.5%) and between Tr and FTcod tests (CV = 1.4 -
and FTcir tests (1.2 ± 2.6; 95%CI(TR-FTcir) = -1.91/-0.34)        5.3%) were low.
and

                Figure 1
         Schematic designs of the tracks marked out for the field tests. A: field test with 180º change
                                      of direction; B: circular field test

Journal of Human Kinetics - volume 73/2020                                                           http://www.johk.pl
by Yusuf Köklü et al. 197
Figure 2
Bland-Altman plots for Treadmill and FTcir (circular field test)
mean differences in final velocity (km∙h-1)
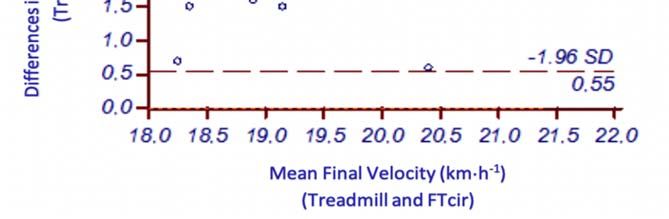
Figure 3
Bland-Altman plots for Treadmill and FTcod (field test with change of direction)
mean differences in final velocity (km∙h-1)
© Editorial Committee of Journal of Human Kinetics198 A Comparison of Incremental Running Field and Treadmill Tests
Table 1
Comparison of blood lactate responses (mmol) at different
running velocities between laboratory and field tests
Tr / FTcir Tr/ FTcod
95%LOA 95%LOA
CV (Bias±1.96xSd CV (Bias±1.96xSd
Tr FTcir FTcod ES MoC (%) ) (%) )
Resting 1.4 ± 0.3 1.3 ± 0.9 1.3 ± 0.7 0.01 Trivial 44.6 0.07 ± 1.7 36.4 0.08 ± 1.3
8 km∙h-1 1.5 ± 0.5 1.6 ± 0.6 1.5 ± 0.5 0.04 Trivial 34.8 0.1 ± 1.4 35.5 0.01 ± 1.4
10 km∙h-1 1.6 ± 0.4 1.6 ± 0.5 1.7 ± 0.9 0.02 Trivial 21.6 0.01 ± 0.9 34.0 0.1 ± 1.5
12 km∙h-1 2.2 ± 0.7 2.5 ± 0.9 2.5 ± 1.2 0.14 Small 27.6 0.3 ± 1.7 31.6 0.3 ± 2.0
0.46 Mediu 32.9 1.2 ± 2.6 51.8 0.8 ± 2.4
14 km∙h-1 3.4 ± 1.0 4.5 ± 1.6* 4.2 ± 1.4* m
Maximum 7.9 ± 1.8 8.5 ± 1.8 8.6 ± 2.5 0.14 Small 18.3 0.7 ± 4.0 19.6 0.7 ± 4.3
ES = Effect Size; MoC: Magnitude of Change; CV = Coefficient of Variation; 95% LOA = 95%
Limits of Agreement; *significant difference from treadmill test (p < 0.05); Tr =Treadmill;
FTcir = Circular field test; FTcod = Field test with change of direction.
Table 2
Comparison of heart rate responses (bpm) at different running
velocities between laboratory and field tests
Tr / FTcir Tr / FTcod
95%LOA 95%LOA
CV (Bias ± CV (Bias ±
Tr FTcir FTcod ES MoC (%) 1.96xSd) (%) 1.96xSd)
8 km∙h-1 135.5 ± 10.5 135.8 ± 12.6 134.9 ± 11.6 0.01 Trivial 3.5 0.3 ± 13.7 5.3 0.6 ± 20.3
151.6 ± 10.8 152.3 ± 11.8 152.2 ± 13.2 0.05 Trivial
3.3 1.0 ± 14.5 4.9 0.5 ± 21.1
10 km∙h-1
166.9 ± 10.1 168.7 ± 10.7 168.7 ± 12.5 0.21 Small
2.6 2.8 ± 11.2 4.0 1.8 ± 19.0
12 km∙h-1
178.6 ± 8.7 182.9 ± 10.1* 181.7 ± 10.9* 0.53 Large
2.34 4.4 ± 8.0 2.7 3.0 ± 12.9
14 km∙h-1
197.2 ± 7.1 193.7 ± 8.6 194.57 ± 7.8 0.52 Large
Maximum 1.90 3.5 ± 7.8 1.4 2.6 ± 5.7
ES = Effect Size; MoC: Magnitude of Change; CV = Coefficient of Variation; 95% LOA = 95%
Limits of Agreement; *significant difference from treadmill test (p < 0.05); Tr =Treadmill;
FTcir = Circular field test; FTcod = Field test with change of direction.
Table 3
Comparison of the final velocities (km∙h-1) between laboratory and field tests
Tr / FTcir Tr / FTcod
95%LOA 95%LOA
CV (Bias ± CV (Bias±1.96xSd
Tr FTcir FTcod ES MoC (%) 1.96xSd) (%) )
Final 20.5 ± 1.2 18.2 ± 0.8* 18.2 ± 0.6* 0.87 Large 8.8 2.2 ± 1.7 8.9 2.2 ± 1.8
Velocity
ES = Effect Size; MoC: Magnitude of Change; CV = Coefficient of Variation; 95% LOA = 95%
Limits of Agreement; *significantly difference from treadmill test (p < 0.05); Tr =Treadmill;
FTcir = Circular field test; FTcod = Field test with change of direction.
Journal of Human Kinetics - volume 73/2020 http://www.johk.plby Yusuf Köklü et al. 199
As the prominent results, HR responses the optimal planning of players' endurance
were significantly lower (F = 9.08, p = 0.02, η2 = training. This study found no significant
0.53, η2 represents large magnitude of change) in differences in the heart rate and blood lactate
the Tr test (178.6 ± 8.7) compared with both FTcir responses of young soccer players running at 8,
(4.4 ± 8.0; 95%CI(TR-FTcir) = -6.98/-1.68) and FTcod (3.0 10, and 12 km∙h-1 across the Tr, FTcir and FTcod
± 12.9; 95%CI(TR-FTcod) = -7.19/1.08) tests at 14 km∙h-1 tests. These results show that players register
running velocity. similar physiological responses to treadmill and
Table 3 shows that mean differences in final field tests that can be thus used interchangeably at
velocity between Tr and FTcir tests (2.2 ± 1.7, low running speeds. These results are in line with
95%CI(TR-FTcir)= 1.67/2.78) and between Tr and FTcod those of Kunduracıoglu at al. (2007) who reported
tests (2.2 ± 1.8, 95%CI(TR-FTcod) = 1.69/2.85) were no significant differences in HR and La- responses
significant (F = 58.22, p = 0.00, η2 = 0.87, η2 between (hexagonal) field tests and Tr tests at 8,
represents large magnitude of change ). The 95% 10, and 12 km∙h-1 running velocities. The results
LOA revealed overestimation of the Tr test against of the current study also show no significant
both FTcir and FTcod (Figures 2 and 3). Low CV differences between the Tr, FTcir and FTcod tests
values were also found for final velocities when in terms of the HRmax and maximum La- values
comparing Tr and FTcir tests (CV = 8.8%) and Tr of the players, which indicated that players
and FTcod tests (CV = 8.9%). reached their maximum effort during Tr, FTcir
and FTcod tests. These findings are in-line with
Discussion previous studies (Bradley et al., 2011; Hoppe et
Players need a well-developed endurance al., 2013; Metaxas et al., 2005).
capacity to be able to perform effectively in soccer. On the other hand, while in the field and
For this reason, coaches often test the endurance treadmill tests players showed similar HR and La-
capacity of players either in the laboratory or in responses at low running velocities, when
the field. While it is possible to standardize running at the velocity of 14 km∙h-1 they showed
humidity, temperature, wind and other lower HR and La- responses in the Tr test
environmental conditions in laboratory tests, field compared to the two field tests. In addition,
tests allow coaches to test players under players in the Tr tests achieved higher final
competition and training conditions. During the velocities than in the field tests. Bland-Altman
tests, players' aerobic power, anaerobic threshold plots of final velocities also indicated higher
running velocity and heart rate are determined values for the Tr test compared to the FTcr and
and training programs are prepared on the basis FTcod tests. One reason for why players showed
of the results. In order to achieve the targeted similar HR and La- responses at low running
development following training, players must velocities yet lower responses in the Tr test at
train with appropriate loads. If there are higher running velocities could be the lack of air
differences between the laboratory and field tests resistance in the Tr test results and lower energy
in terms of physiological responses and final consumption (Jones and Doust, 1996). This higher
velocities, this may cause players to train with energy consumption may then cause fatigue at
inappropriate loads. Therefore, the aim of the higher running velocities in the field tests.
current study was to compare physiological Findings of Higino et al. (2017) were partially
responses to, and final velocities achieved in, an similar to those of our study as they reported that
incremental running test performed with an players in the treadmill test showed higher peak
identical protocol under Tr, FTcir and FTcod velocities than the shuttle run field test, however,
conditions. The most important finding of the showed similar peak velocities in the Carminatti’s
study is that there were differences among the Tr, field test.
FTcir and FTcod tests in terms of the heart rate, The Bland-Altman approach was used to
blood lactate responses and final velocities in quantify both Tr vs. FTcir and Tr vs. FTcod
young soccer players. agreement in estimating HR and La- responses
It is very important to determine the heart and final velocity. As shown in Tables 1, 2 and 3,
rate and blood lactate responses at fixed running there are strong agreements between laboratory
velocities during the field and laboratory tests for and field measurements, and this may be
© Editorial Committee of Journal of Human Kinetics200 A Comparison of Incremental Running Field and Treadmill Tests
interpreted as evidence supporting the higher running velocities or according to the final
interchangeability of these tests. velocity in the test, it is advisable to carry out
A limitation of this study is that HR and testing under the same conditions where training
La- measurements were not made for velocities is to be carried out (in the field or on a treadmill).
over 14 km∙h-1. The reason for this is that in the This study also indicates that variations in the
second part of the test protocol there was a field test protocol (change of direction vs. circle)
continuous velocity increase of 1 km∙h-1 per min do not cause significant differences in terms of
from 15 km∙h-1 in order to determine the final internal and external loads. This suggests that
running velocity. Thus, in future studies, coaches and sports scientists can use 100 m
researchers should examine HR and La- responses circular or 100 m change of direction running
to field and laboratory tests at velocities of up to protocols in field tests. On the other hand, FTcod
15 km∙h-1. test may be preferred to determine and monitor
In conclusion, coaches and sports the endurance capacity of players during the
scientists may choose either treadmill or field tests whole season due to the fact that FTcod includes
if they aim to determine the maximum HR and soccer-specific movements (i.e., direction change,
maximum La- of players. However, especially acceleration and deceleration).
when coaches or sports scientists plan to train at
Acknowledgements
This study was supported by the Pamukkale University Scientific Research Projects Coordination Unit
through Project number 2016HZD033 and presented orally at the European Conference on Science, Art &
Culture (ECSAC), Prague, Czechia (Czech Republic), October 19 to 22, 2017.
References
Aslan A, Açikada C, Güvenç A, Gören H, Hazir T, Özkara A. Metabolic demands of match performance in
young soccer players. J Sport Sci Med, 2012; 11(1): 170–179
Atkinson G, Nevill AM. Statistical methods for assessing measurement error (reliability) in variables
relevant to sports medicine. Sport Med, 1998; 26(4): 217–38
Aziz AR, Tan FHY, Kong CT. A pilot study comparing two field tests with the treadmill run test in soccer
players. J Sport Sci Med, 2005; 4: 105-112
Bland JM, Altman DG. Measuring agreement in method comparison studies. Statistical Methods in Medical
Research, 1999; 8(2): 135-160
Bradley PS, Mohr M, Bendiksen M, Randers MB, Flindt M, Barnes C, Hood P, Gomez A, Andersen JL, Di
Mascio M, Bangsbo J, Krustrup P. Sub-maximal and maximal Yo-Yo intermittent endurance test level
2: Heart rate response, reproducibility and application to elite soccer. Eur J Appl Physiol, 2011; 111(6):
969-978
Castagna C, Manzi V, Impellizzeri F, Chaouachi A, Abdelkrim N Ben, Ditroilo M. Validity of an on-court
lactate threshold test in young basketball players. J Strength Cond Res, 2010a; 24(9): 2434–9
Castagna C, Manzi V, Impellizzeri F, Weston M, Alvarez JCB. Relationship between endurance field tests
and match performance in young soccer players. J Strength Cond Res, 2010b; 24(9): 2434–2439
Castagna C, Varley M, Póvoas SCA, D’Ottavio S. Evaluation of the match external load in soccer: Methods
comparison. Int J Sports Physiol Perform, 2017; 12(4): 490-495
Cohen J. Statistical power analysis for the behavioral sciences. Vol. 2nd, Statistical Power Analysis for the
Behavioral Sciences, 567; 1988
Di Michele R, Di Renzo AM, Ammazzalorso S, Merni F. Comparison of physiological responses to an
incremental running test on treadmill, natural grass, and synthetic turf in young soccer players. J
Strength Cond Res, 2009; 23(3): 939–945
Drust B, Waterhouse J, Atkinson G, Edwards B, Reilly T. Circadian rhythms in sports performance--an
update. Chronobiol Int, 2005; 22(1): 21–44
Journal of Human Kinetics - volume 73/2020 http://www.johk.plby Yusuf Köklü et al. 201
Higino WP, Sorroche ADS, De Mattos Falqueiro PG, Suzuki Lima YC, Higa CL. Determination of aerobic
performance in youth soccer players: Effect of direct and indirect methods. J Hum Kinet, 2017; 56: 109-
118
Hoppe MW, Baumgart C, Sperlich B, Ibrahim H, Jansen C, Willis SJ, Freiwald J. Comparison between three
different endurance tests in professional soccer players. J Strength Cond Res, 2013; 27(1): 31–37
Ingebrigtsen J, Brochmann M, Castagna C, Bradley PS, Ade J, Krustrup P, Holtermann A. Relationships
between field performance tests in high-level soccer players. J Strength Cond Res, 2014; 28(4): 942-949
Ingebrigtsen J, Dalen T, Hjelde GH, Drust B, Wisløff U. Acceleration and sprint profiles of a professional elite
football team in match play. Eur J Sport Sci, 2015; 15(2): 101-110
Jemni M, Prince MS, Baker JS. Assessing cardiorespiratory fitness of soccer players: Is test specificity the
issue?–A review. Sport Med – Open, 2018; 19; 4(1): 28
Jones AM, Doust JH. A 1% treadmill grade most accurately reflects the energetic cost of outdoor running. J
Sports Sci, 1996; 14(4): 321–327
Krustrup P, Mohr M, Amstrup T, Rysgaard T, Johansen J, Steensberg A, Pedersen PK, Bangsbo J. The yo-yo
intermittent recovery test: physiological response, reliability, and validity. Med Sci Sports Exerc, 2003;
35(4): 697–705
Kunduracioglu B, Guner R, Ulkar B, Erdogan A. Can heart rate values obtained from laboratory and field
lactate tests be used interchangeably to prescribe exercise intensity for soccer players? Adv Ther, 2007;
24(4): 890–902
Mallo J, Mena E, Nevado F, Paredes V. Physical demands of top-class soccer friendly matches in relation to a
playing position using global positioning system technology. J Hum Kinet, 2015; 47: 179-188
Martin Bland J, Altman D. Statistical methods for assessing agreement between two methods of clinical
measurement. Lancet, 1986; 327(8476): 307–310
Metaxas TI, Koutlianos NA, Kouidi EJ, Deligiannis AP. Comparative study of field and laboratory tests for
the evaluation of aerobic capacity in soccer players. J Strength Cond Res, 2005; 19(1): 79–84
Myles PS, Cui JI. Using the Bland-Altman method to measure agreement with repeated measures. British
Journal of Anaesthesia, 2007; 99(3): 309–311
Stølen T, Chamari K, Castagna C, Wisløff U. Physiology of soccer: An update. Sport Med, 2005; 35: 501–536
Tanner RK, Fuller KL, Ross MLR. Evaluation of three portable blood lactate analysers: Lactate Pro, Lactate
Scout and Lactate Plus. Eur J Appl Physiol, 2010; 109(3): 551–559
Thomas C, Dos’Santos T, Jones PA, Comfort P. Reliability of the 30-15 intermittent fitness test in
semiprofessional soccer players. Int J Sports Physiol Perform, 2016; 11(2): 172-175
Corresponding author:
Yusuf Köklü
Pamukkale University Faculty of Sport Sciences,
KINIKLI Kampusu, Denizli/ Turkey
Tel: +90 258 296 14 03
Fax: +90 258 296 19 20
E-mail: ykoklu@pau.edu.tr; yusufkoklu@hotmail.com
© Editorial Committee of Journal of Human KineticsYou can also read