A detailed characterization of the Saharan dust collected during the Fennec campaign in 2011: in situ ground-based and laboratory measurements
←
→
Page content transcription
If your browser does not render page correctly, please read the page content below
Atmos. Chem. Phys., 18, 1023–1043, 2018
https://doi.org/10.5194/acp-18-1023-2018
© Author(s) 2018. This work is distributed under
the Creative Commons Attribution 3.0 License.

A detailed characterization of the Saharan dust collected
during the Fennec campaign in 2011: in situ ground-based
and laboratory measurements
Adriana Rocha-Lima1,2 , J. Vanderlei Martins1,3 , Lorraine A. Remer1 , Martin Todd4 , John H. Marsham5,6 ,
Sebastian Engelstaedter7 , Claire L. Ryder8 , Carolina Cavazos-Guerra9 , Paulo Artaxo10 , Peter Colarco2 , and
Richard Washington7
1 University  of Maryland, Baltimore County, Baltimore, MD, USA
2 Atmospheric    Chemistry and Dynamic Laboratory, NASA Goddard Space Flight Center, Greenbelt, MD, USA
3 Climate and Radiation Laboratory, NASA Goddard Space Flight Center, Greenbelt, MD, USA
4 Department of Geography, University of Sussex, Sussex, UK
5 School of Earth and Environment, University of Leeds, Leeds, UK
6 National Center for Atmospheric Science, Leeds, UK
7 Climate Research Lab, Oxford University Center for the Environment, Oxford, UK
8 Department of Meteorology, University of Reading, Reading, UK
9 Institute for Advanced Sustainability Studies, Potsdam, Germany
10 Instituto de Física, Universidade de São Paulo, São Paulo, Brazil

Correspondence: Adriana Rocha-Lima (limadri1@umbc.edu)

Received: 25 March 2017 – Discussion started: 20 June 2017
Revised: 14 November 2017 – Accepted: 7 December 2017 – Published: 26 January 2018

Abstract. Millions of tons of mineral dust are lifted by the     atively high mean SSA of 0.995 at 670 nm was observed at
wind from arid surfaces and transported around the globe ev-     this site. The laboratory results show for the fine particle size
ery year. The physical and chemical properties of the min-       distributions (particles diameter < 5µm and mode diameter at
eral dust are needed to better constrain remote sensing ob-      2–3 µm) in both sites a spectral dependence of the imaginary
servations and are of fundamental importance for the under-      part of the refractive index I m(m) with a bow-like shape,
standing of dust atmospheric processes. Ground-based in situ     with increased absorption in UV as well as in the short-
measurements and in situ filter collection of Saharan dust       wave infrared. The same signature was not observed, how-
were obtained during the Fennec campaign in the central          ever, in the mixed particle size distribution (particle diame-
Sahara in 2011. This paper presents results of the absorp-       ter < 10 µm and mode diameter at 4 µm) in Algeria. I m(m)
tion and scattering coefficients, and hence single scattering    was found to range from 0.011 to 0.001i for dust collected in
albedo (SSA), of the Saharan dust measured in real time dur-     Algeria and 0.008 to 0.002i for dust collected in Mauritania
ing the last period of the campaign and subsequent labora-       over the wavelength range of 350–2500 nm. Differences in
tory analysis of the dust samples collected in two supersites,   the mean elemental composition of the dust collected in the
SS1 and SS2, in Algeria and in Mauritania, respectively. The     supersites in Algeria and in Mauritania and between fine and
samples were taken to the laboratory, where their size and as-   mixed particle size distributions were observed from EDXRF
pect ratio distributions, mean chemical composition, spectral    measurements, although those differences cannot be used to
mass absorption efficiency, and spectral imaginary refractive    explain the optical properties variability between the sam-
index were obtained from the ultraviolet (UV) to the near-       ples. Finally, particles with low-density typically larger than
infrared (NIR) wavelengths. At SS1 in Algeria, the time se-      10 µm in diameter were found in some of the samples col-
ries of the scattering coefficients during the period of the     lected at the supersite in Mauritania, but these low-density
campaign show dust events exceeding 3500 Mm−1 , and a rel-       particles were not observed in Algeria.

Published by Copernicus Publications on behalf of the European Geosciences Union.
1024       A. Rocha-Lima et al.: A detailed characterization of the Saharan dust collected during the Fennec campaign

1   Introduction                                                    aerosol is considered. For instance, for dust aerosols, models
                                                                    show a range in simulated atmospheric loading by a factor
Mineral dust originating from deserts and other arid surfaces       of 4 and a range of simulated emissions of nearly a factor
is one of the most abundant aerosols in the atmosphere. Ac-         of 10 (Huneeus et al., 2011). A large part of this variabil-
cording to Boucher et al. (2013), dust corresponds to 35 %          ity among various models predictions is associated with dif-
of the total continental aerosol mass of particles with diam-       ferences in the parameters used to describe emission, trans-
eter smaller than 10 µm. Roughly half of all aerosols above         port, and optical and microphysical properties of the aerosols
North America are dust particles that have been transported         (Textor et al., 2006). Observational constraints on Saharan
from other continents (Yu et al., 2012). Dust has a signif-         dust are still too poor to bound estimates of the parame-
icant direct radiative effect on the Earth’s energy balance,        ters necessary for quantitative determination of dust climate
which likely acts globally to cool the planet. Regionally, be-      forcing and potential for fertilization of ecosystems. These
cause aerosol forcing depends on the brightness of the un-          parameters include dust emissions, lofting, transport, depo-
derlying surface, over the Sahara itself dust imposes a pos-        sition, composition, microphysical, and optical properties.
itive radiative forcing primarily through longwave warm-            Specifically, while models have been constrained over the
ing (Miller et al., 2014). Depending on the fraction of the         past 15 years by global measures of aerosol optical thickness
dust contributed by anthropogenic sources, the direct ra-           (AOT) made by a constellation of satellite sensors (Leno-
diative forcing exerted on the climate system is estimated          ble et al., 2013), translating from the observed optical loading
at −0.1 (−0.3 to +0.1) W m−2 (Boucher et al., 2013). To put         to a mass loading requires knowledge of the microphysical
that in perspective, the total radiative forcing exerted by all     and optical properties of each individual aerosol type, and
aerosols is estimated to be −0.45 (−0.95 to +0.05) W m−2            satellite sensors are incapable of providing this information.
(Boucher et al., 2013). Recently, Kok et al. (2017) noted that         The project “Fennec – The Saharan Climate System”
the global dust cooling effect would likely be smaller if the       was conducted by a consortium of universities in France,
coarse mode of dust particles were better represented in cli-       UK, and USA in 2011 (Washington et al., 2012). This
mate models. Dust also plays a role in cloud microphysics,          project joined efforts to address open questions on atmo-
acting as ice nuclei and thereby influencing cloud develop-         spheric processes in central Sahara. Combining aircraft (Ry-
ment and subsequently ice cloud radiative effects and pre-          der et al., 2013a, 2015), ground-based (Marsham et al., 2013;
cipitation characteristics (Atkinson et al., 2013; Prenni et al.,   Todd et al., 2013; Hobby et al., 2013; Allen et al., 2013),
2009). In addition to their effects on Earth’s energy balance       modeling, and/or satellite observations (Banks et al., 2013;
and water cycle, the transport of mineral dust particles is         Chaboureau et al., 2016), the Fennec project successfully ob-
known to be important for biological productivity in ocean          tained a broad data set of meteorological conditions, atmo-
regions (Mahowald et al., 2009). Dust particles contain iron        spheric dynamics and structure, as well as dust emission and
and phosphorous, and when these nutrients are bioavailable          transport mechanisms for the central Saharan region (Wash-
and dust is deposited into the ocean, phytoplankton use these       ington et al., 2012).
nutrients in photosynthetic activity (Jickells et al., 2005; Ma-       The present study focuses on the ground-based measure-
howald et al., 2008, 2009; Johnson and Meskhidze, 2013).            ments of the dust optical properties obtained using a custom-
Likewise, dust is known to bring important nutrients to the         made inverse integrated nephelometer and optical reflec-
Amazon (Swap et al., 1992; Bristow et al., 2010; Rizzo et al.,      tometer developed by the Laboratory of Aerosol, Clouds
2013; Yu et al., 2015). Long distance transport of dust con-        and Optics (LACO) at University of Maryland, Baltimore
tributes to air quality degradation (Yu et al., 2013; Pros-         County (UMBC) and subsequent detailed laboratory anal-
pero et al., 2014) and may be a means for intercontinen-            yses of the samples collected by the LACO aerosol sam-
tal transport of biological and disease agents (Smith et al.,       pling stations during the Fennec campaign. The in situ mea-
2012; Molesworth et al., 2002). The Sahara desert is the main       surements were taken during the intensive observation pe-
source of dust globally, contributing more than half of all         riod, from the end of May through June 2011. The LACO–
global emissions, with an estimated amount of 182 million t         UMBC instruments were deployed in two locations: Super-
of dust carried across the western edge of the Sahara each          site 1 (SS1) in Bordj Badji Mokhtar (BBM), southern Alge-
year (Chin et al., 2009; Yu et al., 2015).                          ria, and a small village called Bir Moghrein near the Fennec
   While we expect Saharan dust to affect Earth’s climate           Supersite 2 (SS2) in Zouérat, Mauritania. The instruments
system and biogeochemical cycles, quantifying the effect is         in both locations were operated by the Office National de la
still highly uncertain. Uncertainties are large because, lack-      Meteorologie (ONM) of Algeria and Mauritania with remote
ing strong observational constraints, diversity between model       assistance from the Fennec team.
estimates of key aerosol properties and processes is large.            In situ measurements of Saharan dust were complemented
For example, comparisons between different models show              with laboratory analyses for the characterization of their op-
high variability in the prediction of the most straightforward      tical properties using the methods presented in Martins et al.
aerosol property, total aerosol mass (Textor et al., 2006).         (2009), Rocha-Lima et al. (2014), and Rocha-Lima (2015).
This variability grows even higher when a specific type of          Size and aspect ratio distributions of the dust particles were

Atmos. Chem. Phys., 18, 1023–1043, 2018                                              www.atmos-chem-phys.net/18/1023/2018/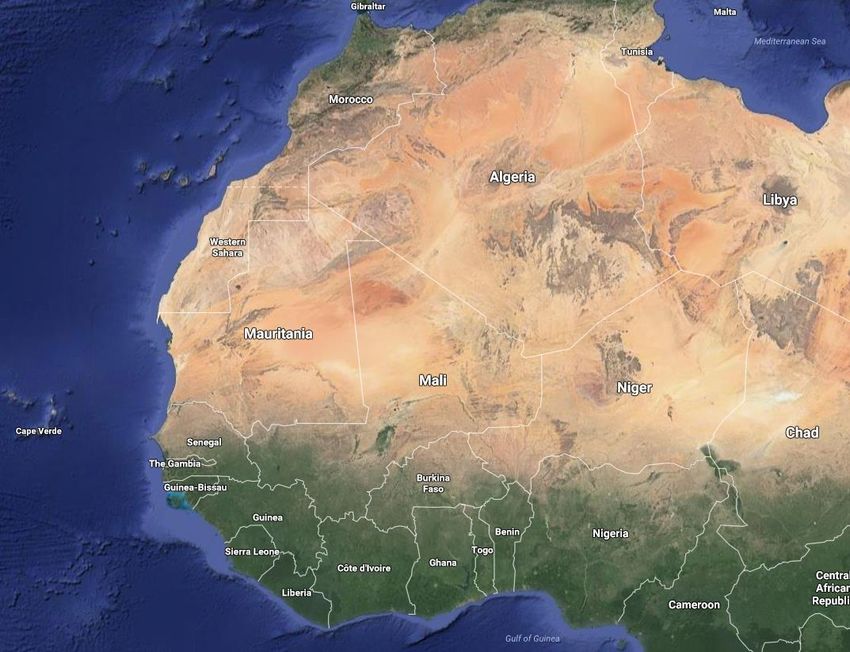
A. Rocha-Lima et al.: A detailed characterization of the Saharan dust collected during the Fennec campaign                    1025

obtained by scanning electron microscopy (SEM). Spectral
optical reflectance measurements from the ultraviolet (UV)
to the near-infrared (NIR) wavelengths were obtained for
each sample and the mean mass absorption efficiency and the
                                                                                              SAMUM-1
imaginary part of the refractive index were derived for dust
collected on filters at both supersites. The elemental compo-
                                                                                      Fennec
                                                                                                    Fennec
sition of the dust samples was obtained by energy dispersive                            SS2
                                                                                                            SS1
X-ray fluorescence analysis (EDXRF). Finally, our optical
measurements were compared with a collocated AERONET               SAMUM-2
                                                                             DODO
sun photometer in the main Supersite-1 in Algeria, when data                                                                 BoDEx
                                                                                          GERBILS
were available.                                                               DABEX
   The next section places Fennec and the measurements pre-                                             DABEX
sented here in context by providing a general background
of previous campaigns and measurements of dust in and
                                                                                              AMMA
near the western Sahara. Section 3 describes the sites where
Fennec measurements were taken and the LACO–UMBC
ground-based instruments deployed during the Fennec cam-          Figure 1. Northwestern Africa showing areas of operation of
paign. Section 4 presents the time series of the ground-based     three major families of dust field campaigns. AMMA, DABEX,
measurements and Sect. 5 describes the laboratory measure-        DODO, and BoDEx are indicated by blue boxes. SAMUM exper-
ments of the samples collected during the campaign that al-       iments are shown by green triangles. Fennec shown by red arrows
lowed the derivation of the dust spectral mass absorption effi-   point to the location of Fennec Supersite 1 (SS1) in Bordj Badji
ciency and imaginary refractive index. We intercompare our        Mokhtar in Algeria and Fennec Supersite 2 (SS2) in Mauritania, in
                                                                  the city of Zouérat (main location). The red dot marks the city of
results with other measurements obtained during the Fennec
                                                                  Bir Moghrein, Mauritania, where the second LACO aerosol sam-
and previous campaigns in Sect. 6. Finally, in Sect. 7, we        pling station was deployed during the Fennec campaign.
present a discussion and the conclusions.

2   Background                                                    provided important information on both mineral dust and
                                                                  biomass burning. These measurements clarified the chemi-
Project Fennec is one of a series of field campaigns de-          cal composition and some information on microphysical and
ployed in and surrounding the Sahara desert engaged in            optical properties of these two aerosol types (Haywood et al.,
characterizing Saharan dust. Focusing on the campaigns of         2008; Chou et al., 2008; Osborne et al., 2008; Formenti et al.,
the past dozen years, we group these into three families:         2008; McConnell et al., 2010; Paris et al., 2010). Measure-
(1) the Sahel and southern Sahara experiments of 2005–            ments in the southern Sahara were made during the dry sea-
2007 (the Bodélé Dust Experiment, BoDEx; Dust and                 son (northern winter) when both dust and biomass burn-
Biomass Experiment, DABEX; Dust Outflow and Deposi-               ing aerosols are prevalent. The presence of biomass burning
tion to the Ocean, DODO; African Monsoon Multidisci-              aerosols limited some characterization of pure dust, but suf-
plinary Analysis, AMMA; NASA AMMA, NAMMA; and                     ficient pure dust cases were observed to determine dust as-
Geostationary Earth Radiation Budget Intercomparison of           pect ratio, size distribution, extinction coefficient, and single
Longwave and Shortwave radiation, GERBILS) (Washing-              scattering albedo (SSA; at 550 nm) and compare these par-
ton and Todd, 2005; Haywood et al., 2008; McConnell et al.,       ticle properties between locations in the southern Sahara to
2008; Redelsperger et al., 2006; Zipser et al., 2009; Hay-        those near the Atlantic coast. The accumulation-mode (nom-
wood et al., 2011); (2) the Moroccan and Cape Verde ex-           inally 0.1 to 2.5 µm) dust was found to be non-absorbing at
periments of 2006 and 2008 (Saharan Mineral Dust Exper-           550 nm (Osborne et al., 2008) and the aspect ratio was 1.7
iments – SAMUM-1 and SAMUM-2) (Heintzenberg et al.,               (Chou et al., 2008). Optical properties were estimated based
2009; Ansmann et al., 2011); and (3) the Fennec climate pro-      on filter samples from DODO (McConnell et al., 2010) for
gramme of the central and western Sahara of 2011 and 2012         short wavelengths only. Spectral optical properties were not
(Marsham et al., 2013; Banks et al., 2013; Todd et al., 2013;     measured.
Ryder et al., 2015). All three families included both ground-        The SAMUM campaigns targeted dust aerosol on the
based and airborne components. Figure 1 shows the general         northwestern edges of the Sahara. SAMUM-1 in Morocco
areas of operation of these three families of campaigns.          was chosen to be close to dust sources and relatively free
   The AMMA–DABEX–DODO campaign was a broad in-                   from influence of biomass burning aerosols, and SAMUM-
vestigation of the meteorology, aerosols, and trace gases of      2 on the Cape Verde Islands was chosen to represent
the Sahel and southern Sahara (Haywood et al., 2008; Mc-          the dust and biomass burning outflow over the Atlantic
Connell et al., 2008). Ground sites, aircraft, and modeling       (Ansmann et al., 2011). SAMUM produced measurements

www.atmos-chem-phys.net/18/1023/2018/                                                 Atmos. Chem. Phys., 18, 1023–1043, 2018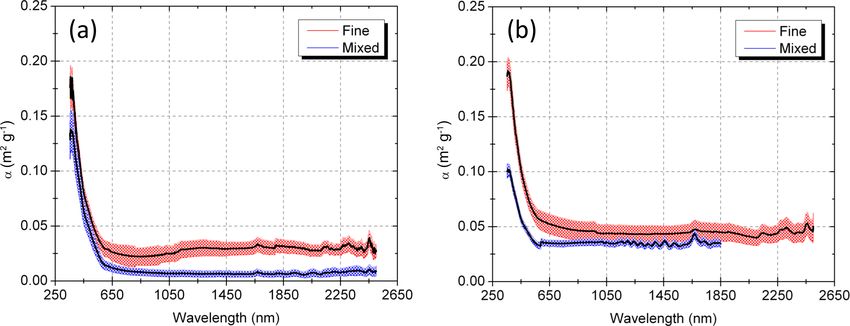
1026        A. Rocha-Lima et al.: A detailed characterization of the Saharan dust collected during the Fennec campaign

for size-dependent composition and aspect ratio. Unlike            1 g cm−3 (Hopke et al., 1997). For particles of density around
AMMA–DABEX, in SAMUM spectral optical properties                   2.6 g cm−3 , such as dust, this is approximately equivalent a
were reported. Optical properties included spectral absorp-        cut size of 50 % at particle’s diameter of 6.1 µm, assuming a
tion coefficient, imaginary part of the refractive index, and      spherical shape of the particles.
SSA (Ansmann et al., 2011; Kandler et al., 2009, 2011;                The first-stage filters adequately prevent coarse particles
Müller et al., 2009; Wagner et al., 2012). In some studies,        from passing through the pores to adhere to the second-
the complex refractive index was derived using mixing rules        stage filter. Thus the second-stage filter represents a fine-
after mineral composition of the particles was determined          mode aerosol and the size distributions analyzed from the
(Kandler et al., 2009, 2011; Otto et al., 2009). In other stud-    second-stage filters include only particles with diameter less
ies, aerosol optical properties including the imaginary part       than 5 µm. The coarse particles in the sample adhere to the
of the refractive index and SSA were determined across a           first-stage filters, but so do many fine particles. There is over-
wavelength spectrum from 250 to 800 nm based on measure-           lap of size distributions of the first- and second-stage filters,
ments of particles collected on filters (Müller et al., 2009;      causing us to identify the first-stage filter as representing a
Wagner et al., 2012).                                              “mixed” size mode aerosol rather than a coarse mode.
   In all of these campaigns differences in aerosol microphys-        Each sampling position in the cartridge is connected in-
ical and optical properties were noted, dependent on mixtures      dividually through vacuum tubes to the control system unit
of dust with other aerosol types and even pure mineral dust.       containing automatic valves, flow meters, pump controller,
Differences were linked to locations: inland versus coastal        and the data acquisition system. The filters were pre-weighed
(Osborne et al., 2008), Morocco versus Cape Verde (Ans-            and the cartridges were prepared, individually labeled, and
mann et al., 2011), and northern versus southern fringes of        packed at the LACO filter laboratory at UMBC to avoid in
the desert (Ansmann et al., 2011). These differences were          field contamination. The filter in the eighth position of each
apparent even when using the same instruments and apply-           cartridge was not sampled and was used as reference blank.
ing the same analysis techniques (Kandler et al., 2011), mak-      The airflow pumped by the sampling station through the fil-
ing clear that inherent differences exist in dust chemical, mi-    ters was set at 4 L min−1 . At the end of the campaign, car-
crophysical, and optical properties. Fennec was designed to        tridges containing the sampled filters were sent back to the
add new locations of dust sampling in the heart of the desert,     laboratory at UMBC for detailed analysis of mass, size, and
including one site deep in the central Sahara (Fig. 1), and        aspect ratio distribution, chemical composition, and spectral
like previous campaigns approach dust characterization with        optical reflectance measurements. See Table 1 for deploy-
a full array of ground-based, airborne and satellite obser-        ment durations and sampling periods.
vations, and modeling (Marsham et al., 2013; Todd et al.,
2013; Ryder et al., 2013a; Banks et al., 2013). Fennec also        3.2   Inverse integrating nephelometer and optical
built upon previous field campaigns with new technology and              reflectometer
techniques that would aid in the overall characterization of
the dust and its meteorological underpinnings and, in light of     The inverse integrating nephelometer and optical reflectome-
the present study, specifically in advances in the characteri-     ter (N–OR system) were designed to make real-time mea-
zation of dust optical properties.                                 surements of the scattering and absorption coefficients of am-
                                                                   bient aerosol particles. This instrument connects an inverse
                                                                   integrated nephelometer (N system) with an optical reflec-
3     Instruments and sites                                        tometer (OR system) into a single unit that was designed,
                                                                   built, and tested at the LACO at UMBC.
3.1    LACO aerosol sampling station                                  The N system component measures the total scattering co-
                                                                   efficient integrated over an angular range of 5–178◦ . An aero-
UMBC–LACO deployed two automated LACO aerosol sam-                 dynamic impactor in the inlet of the equipment cuts off par-
pling stations, one at each Fennec supersite. The aerosol sam-     ticles larger than 10 µm in diameter. The internal laser beam
pling station is a system for collection of aerosol particles on   with wavelength of 670 nm illuminates particles entering the
filters designed and built at UMBC. This instrument has a          inlet of the instrument. A photomultiplier tube detector and
cartridge with space for 16 filters, separated into two stages     a cosine diffuser are positioned perpendicular to the laser
for eight fine filters and eight coarse filters. Nuclepore fil-    beam, aiming to maximize the scattering angle coverage of
ters with 25 mm diameter and 5.0 and 0.4 µm pore diame-            the instrument.
ters were used as coarse (first-stage) and fine (second-stage)        At the end of the N system, the OR system component
filters, respectively, to collect the aerosol particles. Parti-    measures the change of reflectance of a Nuclepore filter in
cles with aerodynamic diameters larger than 10 µm were re-         real time as the particles collect on the filter and darken the
moved by the aerodynamic impactor of the instrument inlet.         surface. The OR system uses three LEDs at wavelengths 450,
This impactor has a cut efficiency of 50 % for particles with      530, and 640 nm to illuminate the filter consecutively and al-
aerodynamic sizes of 10 µm in diameter and density equal           low for derivation of absorption at these three wavelengths.

Atmos. Chem. Phys., 18, 1023–1043, 2018                                              www.atmos-chem-phys.net/18/1023/2018/
A. Rocha-Lima et al.: A detailed characterization of the Saharan dust collected during the Fennec campaign                            1027

Table 1. Characteristics and sampling period of the LACO–UMBC instruments deployed during the Fennec campaign.

                 Location      Instrument                           Technique                 Sampling   Deployment
                                                                                              period     duration
                 Algeria       LACO aerosol sampling station        Filter samples            1.5–12 h   6–30 June
                               Real-time optical reflectometer      Optical reflectance       45 s       22–30 June
                               Inverse integrating nephelometer     Scattering coefficient    4s         6–30 June
                 Mauritania    LACO aerosol sampling station        Filter samples            6h         23 May–26 June

Table 2. Quantities derived from real-time ground-based in situ measurements and laboratory analysis of in situ filter collection of Saharan
dust samples during the Fennec campaign.

                 Instruments                              Physical quantity
                 Real-time optical reflectometer          Scattering coefficient,
                 and inverse integrating nephelometer     absorption coefficient, SSA
                                                          Mass concentration, elemental composition,
                 LACO aerosol sampling station
                                                          spectral optical measurements (reflectance and refractive index)

This allows the simultaneous measurement of the scattering              able in Marsham et al. (2013). Figure 2 shows an image of
and absorption coefficients of the aerosol particles, the cal-          the tower where the instruments were installed. The inlets
culation of SSA for the 670 nm in real time (by scaling the             of both aerosol sampling stations and the nephelometer were
absorption coefficient from 640 to 670 nm using our spectral            positioned at a distance of 3 m from the ground. The instal-
measurements discussed on Sect. 4.4), and the creation of               lation of this tower close to the ONM and to the airport facil-
time series of these optical parameters with a temporal reso-           itated access to the tower for replacement of filter cartridges.
lution of 45 s.                                                         Also, it allowed the operation of the aerosol sampling station
   Table 1 summarizes the characteristics and sampling pe-              in manual mode, in which the operator collected more filters
riods of the ground-based measurements obtained by the                  during intense episodes of dust.
LACO–UMBC instruments during Fennec 2011. The sam-                         The location of the second automated LACO aerosol
pling period corresponds to the temporal resolution of each             sampling station was in the remote town of Bir Moghrein
instrument. For the LACO aerosol sampling station, the sam-             (25.23◦ N, 11.62◦ W; ≈ 360 m a.s.l.). The aerosol sampling
pling period of each filter, i.e., the interval on which fil-           station was operational from 23 May to 26 June 2011 col-
ters were being replaced, was on the order of hours. There-             lecting three to four filters per day with its inlet also lo-
fore, the properties obtained later on from filter-based mea-           cated 3 m above ground. Given the difficulty in accessing
surements are time-averaged over the sampling period. A                 the Bir Moghrein site, the station was preset to automati-
summary of the physical quantities retrieved by each of the             cally sample filters at the following periods of time: 07:00 to
LACO–UMBC instruments is presented in Table 2.                          13:00, 13:00 to 19:00 UTC, 19:00 to 21:00, and 21:00 to
                                                                        07:00 UTC. No N–OR was deployed at Bir Moghrein, and
3.3   Fennec supersites                                                 therefore no high temporal resolution data were collected
                                                                        with the LACO–UMBC instruments at this site.
The LACO–UMBC instruments were deployed at SS1, BBM
in the heart of the central Sahara, and in a small village called       4     Time series of dust characterization
Bir Moghrein approximately 290 km north of SS2, which
was located in the city of Zouérat, Mauritania. The reason for          4.1     Time series of mass concentration and aerosol
the deployment at a distance from SS2 was to avoid contam-                      scattering coefficients
ination from aerosols produced from local mining operations
in Zouérat. See Fig. 1.                                                 LACO aerosol sampling stations were deployed at both sites,
   SS1 is located in BBM, Algeria (21.38◦ N, 0.92◦ E;                   allowing for measurements of aerosol mass concentration
≈ 420 m a.s.l. – above sea level). In addition to the LACO–             as function of time, with a resolution of 6 h except dur-
UMBC instruments, the Fennec team deployed other instru-                ing intense dust episodes at SS1, when samples were col-
ments at this location, including an AERONET Cimel sun                  lected at a higher frequency. The sampling station automati-
photometer. A detailed description of the other instruments             cally advanced measurements from filter to filter during mea-
and measurements of the Fennec campaign at SS1 is avail-                surement periods defined in Sect. 3.2, accumulating aerosol

www.atmos-chem-phys.net/18/1023/2018/                                                        Atmos. Chem. Phys., 18, 1023–1043, 2018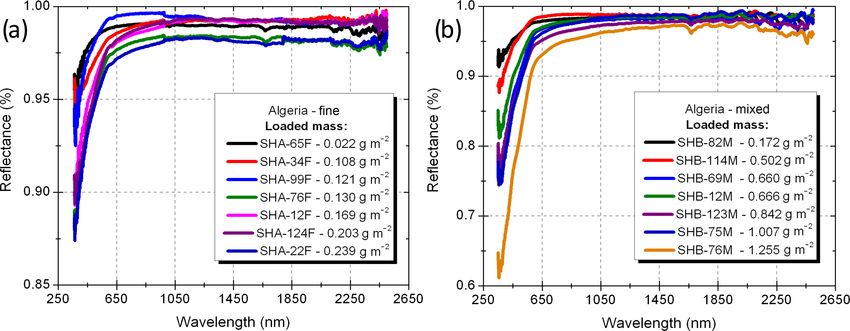
1028        A. Rocha-Lima et al.: A detailed characterization of the Saharan dust collected during the Fennec campaign

                        (a)                                            (b)

Figure 2. Tower at SS1 in Bordj Badji Mokhtar in Algeria with the LACO–UMBC instruments during an episode of low (a) and high (b)
concentration of dust aerosol taken on 8 and 17 June, respectively. The inverse integrating nephelometer, optical reflectometer, and the LACO
aerosol sampling station were installed with inlets 3 m above the ground level. Image credit: Mohammed Salah and Bouzine Ouchene, ONM,
Algeria.

mass on four different filters each day. After the end of
the campaign, cartridges containing the sampled filters were
sent back to UMBC. At the laboratory, each filter was post-
weighed and the mass collected in each filter was obtained.
The mean mass aerosol concentration for the period that each
filter was sampled was obtained by dividing the sampled
mass by the integrated flow of the sampling period of each
filter. The temporal resolution of the mass concentration time
series is nominally 6 h, based on the 6 h sampling period of
each filter, and the mass concentration time series is not a
real-time measurement. The sampling station filter cartridge
supports two size stages for each sampling period, as de-
fined in Sect. 2.2, and thus the mass concentration time series
is available for both the aerosol loading on the coarse-pore
(first-stage) and the fine-pore (second-stage) filters. The time
series of integrated scattering coefficient (βsca ) was measured
in real time every 4 s using the N system located only at SS1.
    Figure 3 shows the concentration (in µg m−3 ) from the
first- (mixed) and second- (fine) stage filters for both sta-
tions in (a) Algeria and (b) Mauritania. Note that while                 Figure 3. Mass concentration in µg m−3 and scattering coefficient
the first-stage filter successfully prevents coarse particles            in Mm−1 of dust in (a) Algeria and (b) Mauritania. For the mass
(d > 5 µm) from passing through to the second stage, al-                 concentration, each data point represents the average for the given
                                                                         sampling period. Fine-mode mass concentration is calculated from
lowing the second-stage filter to represent a true fine-mode
                                                                         the second-stage filters. Mixed mass concentration is calculated
aerosol, both fine and coarse particles adhere to this first
                                                                         from the first-stage filters, where both fine and coarse particles ad-
stage, creating a mode of mixed sized particles. This size               here to the surface. Note the different scales on the y axis in panels
separation of the two filters will be shown in Sect. 5. In               (a) and (b). Uncertainties were estimated to vary between 3.0 and
Fig. 3, we see that the mass concentration at SS1 in Algeria             7.0 µg m−3 for days with low and high mass concentrations, respec-
reached levels approximately 10 times larger than in Mau-                tively. The integrated scattering coefficient was measured at 670 nm
ritania. In Algeria, the highest peaks of mass concentration             at SS1 in Algeria only in the period of 6–30 June 2011. Before
were observed on 13 and 18 June, with lesser events noted                22 June events of dust that had its scattering coefficient exceeding
on 16, 21–22, and 29–30 June. These peaks are associated                 3500 Mm−1 saturated the equipment, as marked in the plot. Un-
with the sudden moistening convective events described by                certainties of the scattering coefficient were estimated to be within
Marsham et al. (2013). Allen et al. (2013) also associated               5 %.
part of the dust loading in some of these events to a break-
down of a low-level jet. On 25 June there is also a moisten-
ing event, but it does not have a corresponding peak in mass             SS1. In Mauritania, we see the distinction between the “mar-
concentration as measured by the aerosol sampling station at             itime phase” with low aerosol loading that occurs from 1 to
                                                                         13 June and the onset of the “heat low phase” after that pe-

Atmos. Chem. Phys., 18, 1023–1043, 2018                                                     www.atmos-chem-phys.net/18/1023/2018/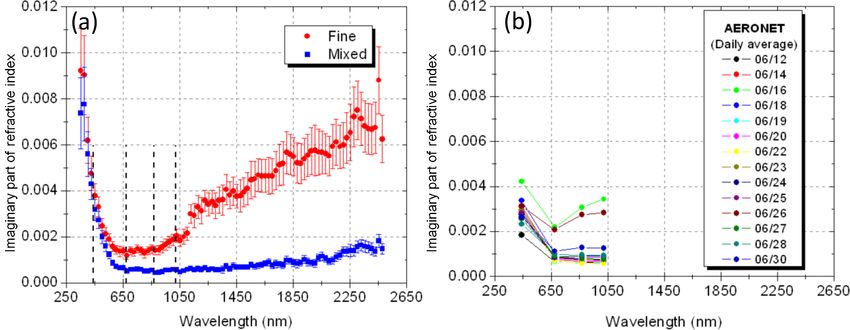
A. Rocha-Lima et al.: A detailed characterization of the Saharan dust collected during the Fennec campaign 1029
riod with higher aerosol loading and greater influence from was compared and showed good agreement against other ab-
the interior desert, as described by Todd et al. (2013). sorption techniques by Reid et al. (1998) and applied to vol-
Figure 3a also shows the integrated scattering coefficient canic ash samples (Rocha-Lima et al., 2014). This technique
(in Mm−1 ) for the whole period of the campaign. In the first is based on the assumptions that the reflectance of the filter
week, there was a long period with relatively low dust load- decreases as particles are loaded on it and that the reduction
ing followed by a sequence of intense episodes of high dust of the light reflected by the filter is due to absorption only
concentration. On 13 June, the high concentrations of aerosol by the aerosol particles. The reflectance of the filters for the
exceed the saturation limits of the nephelometer, and all the red wavelength slightly increases when the first particles are
data above 3500 Mm−1 were not measured. On 22 June, the collected on their surface. We estimate that this effect is the
detection scale of the nephelometer was reconfigured in or- on order of 1–2 %, and it is included in the uncertainties of
der to allow for higher dynamic range and prevent saturation. the reflectance. A detailed description of this method can be
The period from 22 to 30 June has the optimum configuration found in Martins et al. (2009) and Rocha-Lima et al. (2014).
conditions for the N–OR system. Note that the days of peak This technique is based on the assumptions that the re-
scattering coefficient at SS1 correspond to some of the same flectance of the filter decreases as particles are loaded on it
days of independently measured high mass concentration, and that the reduction of the light reflected by the filter is due
i.e., 13, 18, 21–22, and 29–30 June. The 25 June also shows to absorption only by the aerosol particles. The reflectance of
a high scattering coefficient, but that day is missing from the the filters for the red wavelength slightly increases when the
mass concentration time series, although 25 June, like the first particles are collected on their surface. We estimate that
other observed high mass and high scattering events, follows this effect is on the order of 1–2 %, and it is included in the
a moistening event identified in Marsham et al. (2013). uncertainties of the reflectance.
It is important to note that dust events of short duration The absorption coefficient (βabs ) in Mm−1 is αabs /ρ,
observed in the scattering coefficient are not captured by the where ρ is the aerosol concentration (g m−3 ). For real-time
measurements of mass concentration. This happens due to calculations of βabs using the reflectometer we measure the
different time resolution of the instruments used for these two darkening of the filter as a ratio of reflectance at two points in
measurements. The mass concentration is averaged over 6 h, time, t1 and t2 , with I (t1 ) substituting for I0 of Eq. (1). The
while the nephelometer had a time resolution of 45 s. darkening of the filter is thus relative to the previous mea-
surement and is no longer referenced to the pristine filter.
4.2 Time series of aerosol absorption coefficient and Then, the power law equation given by Eq. (1) was rewritten
single scattering albedo in terms of the linear absorption coefficient βabs = αabs /ρ,
where the concentration ρ = M/V (g m−3 ) depends on the
Simultaneous to the scattering coefficient measurements, the aerosol mass M collected and the volume V of air that passed
same dust particles that passed through the nephelometer are through the filter in the time interval 1t = t2 − t1 . We used
collected on filters and measured in real time by the reflec- 1t = 7.5 min to have higher sensitivity to the change of filter
tometer. Due to a technical problem, the reflectometer did reflectance. The total volume is obtained by integrating the
not work properly at the beginning of the campaign. The re- measured flow F in time, i.e., V = F · 1t. Using the aerosol
flectometer data presented in the next sections were obtained mass concentration σ as the ratio of the aerosol mass M and
after 22 June, after the problem had been identified and fixed. the sampled area of the filter Afilter , in Eq. (1), the depen-
The mass absorption efficiency (αabs ), in m2 g−1 , is the pa- dence with the aerosol mass M cancels out.
rameter derived from the measured quantities of attenuated
I (t2 ) 1.218 Afilter
reflectance of the filter (I /I0 ) and aerosol mass concentra- 1
βabs = − ln · × 106 (2)
tion (σ ), in g m−2 . The relationship between the measured 2 I (t1 ) F · 1t
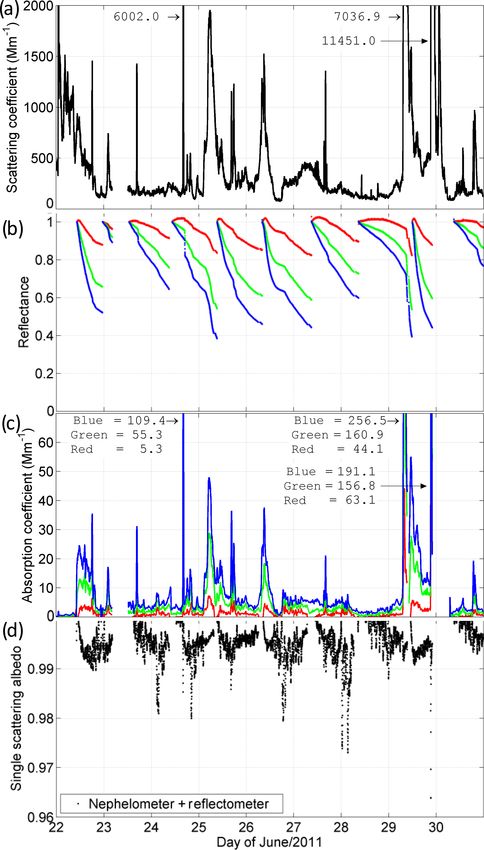
quantities and αabs is given by Eq. (1): Figure 4 shows the results of the simultaneous measure-
G
b
I ments of scattering and absorption coefficients (βsca and
σ= − ln , (1) βabs ) at SS1 for the period of 22–30 June. Figure 4a shows
2αabs I0
the scattering coefficient in Mm−1 for 640 nm. This is a tem-
where I is the measured reflectance and I0 is the reflectance poral subset of the plot in Fig. 3a. During this period sev-
of the clean pristine filter. The functional relationship be- eral episodes of high concentration of dust were detected.
tween σ and the reflectance ratio is a power law of the log- The largest episodes of dust were seen on 24, 29, and 30
arithm, where b is an empirical power law coefficient deter- June. Scattering measurements were taken every 4 s and are
mined to be 1.218 and G is a geometrical factor determined shown in the plot averaged every 45 s in order to correspond
to be equal 1 for a large range of geometries of the setup (an- to the time scale of the reflectometer. Figure 4b shows the
gle between light incidence and detection), including the one reflectance of Nuclepore filters at three wavelengths normal-
used in this work. This method was previously derived and ized by the reflectance of the clean filter measured at the be-
calibrated by Martins et al. (2009) using Monarch 71 black ginning of the sampling. Filters in the reflectometer were re-
carbon particles manufactured by the Cabot Corporation, it placed approximately once per day. The sampling start time
www.atmos-chem-phys.net/18/1023/2018/ Atmos. Chem. Phys., 18, 1023–1043, 2018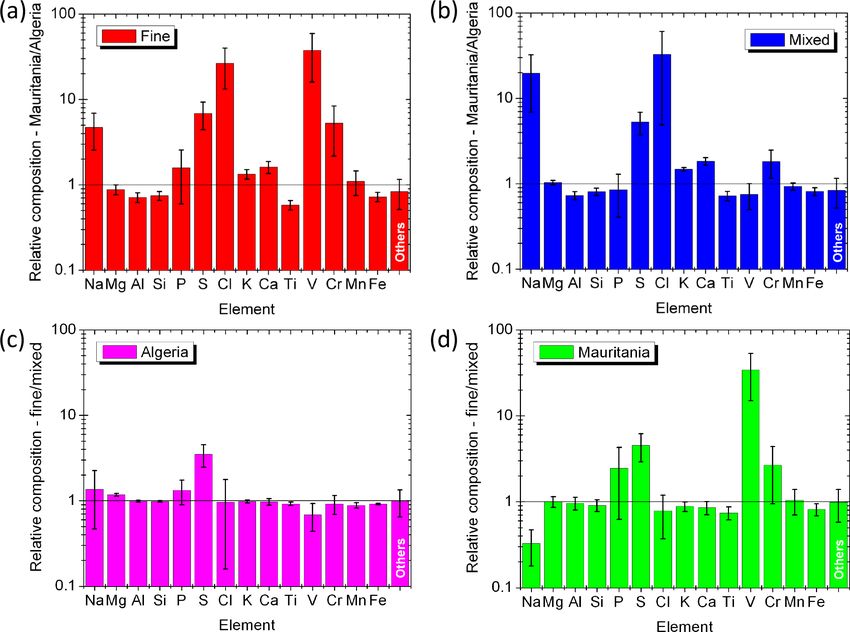
1030           A. Rocha-Lima et al.: A detailed characterization of the Saharan dust collected during the Fennec campaign

of each filter can be identified as the moment where the re-
flectance is close to 1. The slope of the curve of the re-
flectance is proportional to the amount of aerosol in the filter
at that moment and therefore to the concentration of the par-
ticles collected on the filter at that given instant.
   Figure 4a and c show similar trend between scattering and
absorption coefficients, obtained by the nephelometer and the
reflectometer, respectively. The uncertainties in the scatter-
ing measurements were estimated to be smaller than 5 % for
highly scattering particles such as dust particles. The uncer-
tainties in the absorption coefficient were estimated from the
error in the reflectance, integrated flow, and size of the fil-
ter where particles were collected in the filter. These errors
combined represent an uncertainty on the order of 3 % (or
2 Mm−1 , whichever is higher) in the absorption coefficient.
   The SSA is defined as βsca /(βsca + βabs ). By obtaining
simultaneous scattering and absorption coefficients at SS1,
the calculation of a time series of SSA was possible at
670 nm, the wavelength measured by the nephelometer. Be-
cause βabs is obtained at 640 nm, this value of was extrapo-
lated to 670 nm based on spectral laboratory measurements
showed in Fig. 7a. The SSA time series are shown in Fig. 4d.
These results show variation along this period from 0.96
to close to 1, with a mean value around 0.995, which is
around 0.01 to 0.02 systematically higher than the values
for Saharan dust found in the literature at this wavelength,
as we discuss in Sect. 7. It is important to note that SSA is
a size-dependent quantity, and comparisons with other mea-
surements should take into account size differences, as dis-
cussed in Sect. 7.

5   Spectral imaginary part of the refractive index of
    dust
                                                                   Figure 4. In situ measurements from SS1 in Algeria: (a) scatter-
In addition to the time-resolved measurements of aerosol           ing coefficient in Mm−1 ; (b) reflectance measurements normalized
mass and optical properties, further analysis of the dust-laden    with respect to a clean filter at three wavelengths, 450 nm (in blue),
filters obtained during Fennec can reveal time-integrated          530 nm (in green), and 670 nm (in red); (c) derived absorption coef-
properties of the dust particles, namely the spectral imagi-       ficient for the period of 22 to 30 June 2011; and (d) single scatter-
nary part of the refractive index. Using the same methodol-        ing albedo of the Saharan dust at 640 nm calculated by combining
ogy applied in Rocha-Lima et al. (2014), the derivation of the     the measurements of scattering and absorption coefficients from the
                                                                   nephelometer and the reflectometer, respectively. Uncertainties are
imaginary refractive index was obtained by minimizing the
                                                                   discussed in Sect. 4.2.
difference between the mean mass absorption efficiency de-
rived from direct measurements of the attenuated reflectance
on the filters (Eq. 2) and that calculated from Mie or T-matrix
theory using size and shape parameters obtained from other         where nA (r)dr is the number of particles per unit of area with
analysis of the particles on the filters. The independent cal-     radii in the range [r, r + dr] in a given microscopic area,
culation of mass absorption efficiency is governed by              dp is the grain density of the particles, and v(r) is the vol-
                                                                   ume of each particle. The absorption efficiency Qabs (m, x)
         R∞                                                        is a function of the complex refractive index (m) and size
              nA (r)Qabs (m, x)A(r)dr                              parameter (x) and was obtained by applying either Mie or T-
αabs =
         0
                                        ,                   (3)    matrix theory following the same method applied in Rocha-
                R∞                                                 Lima et al. (2014). For all calculations the real part of the re-
                     nA (r)dp v(r)dr
                0
                                                                   fractive index was held constant spectrally at a value of 1.56

Atmos. Chem. Phys., 18, 1023–1043, 2018                                               www.atmos-chem-phys.net/18/1023/2018/
A. Rocha-Lima et al.: A detailed characterization of the Saharan dust collected during the Fennec campaign 1031
Figure 5. Examples of typical spectral reflectances of the Sahara dust sampled at different days at SS1 in Algeria for (a) fine mode (second-
stage filter) and (b) mixed (fine + course) mode (first-stage filter), according to the loaded mass per unit area σ of each filter in g m−2 . Each
curve represents the average over 25 measurements of reflectance over the same filter. Uncertainties on the reflectance were estimated to be
a maximum of 2.0 % for the full wavelength range.
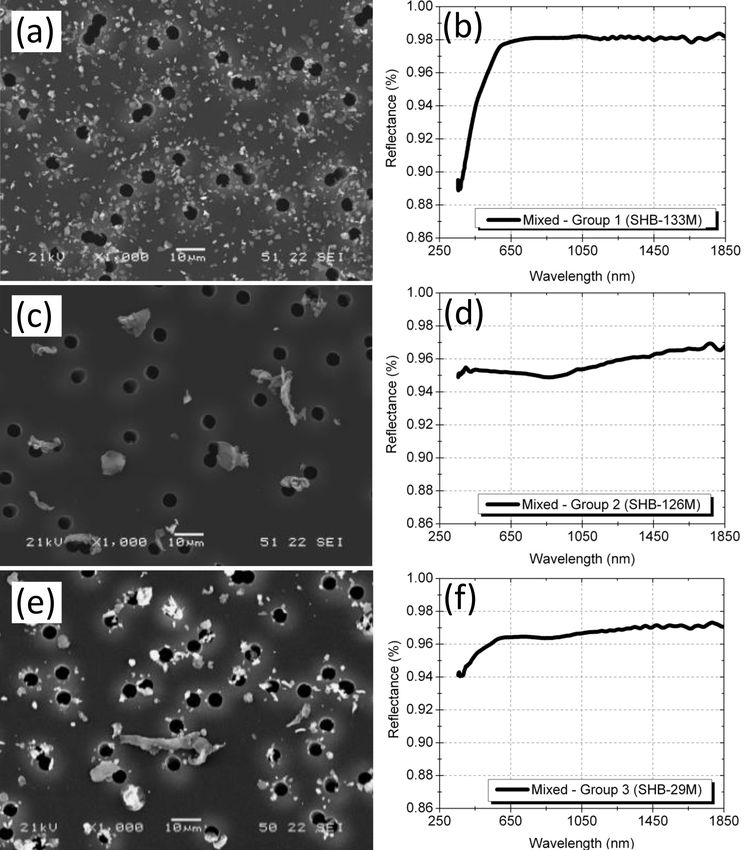
(Balkanski et al., 2007; Petzold et al., 2009). In a similar The reflectance of the filters collected in Mauritania pre-
method, Wagner et al. (2012) fixed the real part of the re- sented significant spectral variations and three groups of
fractive index to be 1.53 to derive the imaginary part of the samples were identified based on the qualitative inspection of
refractive index. The imaginary part of the refractive index the shape of the reflectance curve in the visible and NIR, as
that yields the Qabs (m, x) producing the closest calculated shown in Fig. 6. Group 1 shows spectral reflectance similar to
αabs to the measured value of αabs from Eq. (2) is identified the reflectance of the samples collected in Algeria as shown
as the retrieved value. The retrieval is performed for the en- in Fig. 5, with strongly decreased reflectance below 600 nm.
tire range of wavelengths from 350 to 2500 nm. This deriva- Filters from the group 2 have reflectance spectra with a flat
tion requires laboratory measurements of the spectral optical signal spanning the UV to visible wavelengths, a minimum
reflectance of the filters using a spectrometer to obtain αabs of reflectance around 860 nm, and then a slightly increasing
from Eq. (2), measurements using an SEM to obtain particle reflectance as a function of wavelength through the short-
size distribution and aspect ratio of the particles, a calcula- wave infrared. Finally, group 3 has a reflectance spectrum
tion of particle density, and radiative modeling of the parti- that seems to be a combination of groups 1 and 2.
cles using either a Mie or T-matrix code, as described in the SEM images of these three groups show that groups 2
following subsections. and 3 contain extra-large particles comparatively to the sizes
from group 1. While the SEM images show irregularly
5.1 Spectral optical reflectance measurements and shaped particles, reminiscent of dust, our laboratory obser-
derivation of mass absorption efficiency vations indicated that these extra-large particles have lower
density compared with typical dust. Firstly, the mass of the
The spectral reflectance from 350 to 2500 nm was obtained filters from group 2 is relatively low, even though SEM im-
for all sampled filters relative to blank filters using a Field- ages show a considerable number of particles on them. Sec-
Spec Pro from Analytical Spectral Device in the wavelength ondly, these large particles are easily damaged by the elec-
range of 350 to 2500 nm and a reflectance lamp from ASD tron beam of the microscope. Finally, the presence of the
Inc. The method applied in this analysis followed the same aerodynamic impactor with nominal cutoff size of 10 µm (or
experimental procedure used in Rocha-Lima et al. (2014). approximately 6.1 µm for a spherical dust particle of density
The reflectance of the filters collected at both stations was 2.6 g cm−3 ) in the inlet should have removed most of these
measured relative to a white reference. Figure 5 shows ex- particles, unless they have lower inertia and lower aerody-
amples of reflectance spectra for fine and mixed modes for namic sizes, i.e., lower mass density.
filters of different mass loading collected on different days in Thus, while the spectral reflectance, size, and density of
Algeria (SS1). The typical reflectance spectrum obtained for the particles of Mauritania group 1 resemble the dust proper-
the filters in Algeria shows a sharp decrease in reflectance ties and the measurements from SS1, the measured particle
for wavelengths less than 650 nm. This strong spectral de- properties of Mauritania groups 2 and 3 do not. The anoma-
pendence is what causes the dust to appear brown to our eye. lous spectral reflectance and particle sizes of groups 2 and 3
Some of the samples also presented a slight decrease in re- are always linked together, meaning we do not find filters
flectance above 1000 nm. The ripples on the reflectance curve with groups 2 or 3 spectral reflectance without also finding
above 2000 nm are measurement artifacts also observed in groups 2 and 3 particle size and density properties. These par-
clean filters. ticles are sparse on the surface of the filters and the complete
www.atmos-chem-phys.net/18/1023/2018/ Atmos. Chem. Phys., 18, 1023–1043, 2018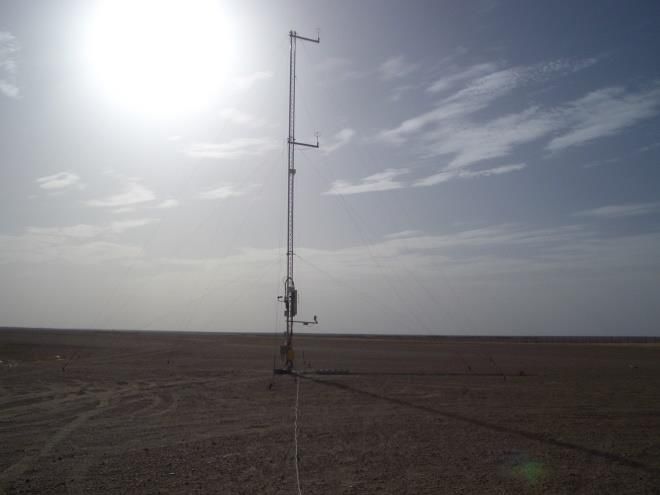
1032       A. Rocha-Lima et al.: A detailed characterization of the Saharan dust collected during the Fennec campaign

Figure 6. Examples of spectral reflectance and SEM images of Saharan dust from SS2 in Mauritania for (a, b) group 1, (c, d) group 2, and
(e, f) group 3. Each curve represents the average over 25 measurements of reflectance over the same filter. Uncertainties on the reflectance
were estimated to be of a maximum of 2.0 % for the full wavelength range. The scale bar in the SEM images shows a 10 µm scale for size
reference. The samples were collected on 21 June, 19 June, and 26 May 2011.

characterization of their properties and origin would require           5.2    Size distribution measurements
dedicated microscopy and trajectory analysis, which are be-
yond the scope of this work. Therefore, for the remainder of
the analysis we will focus on the properties measured and               The number, area, and volume size distributions were ob-
derived from Algeria and from Mauritania group 1 only.                  tained from SEM images of the dust particles. Analysis in-
   From the spectral reflectance measurements and mass con-             cluded both the first-stage filters with pore size 5 µm and
centration applied to Eq. (2), we derived the spectral mass             the second-stage filters with pore size 0.4 µm as shown in
absorption efficiency (in m2 g−1 ) for fine and mixed particle          Sect. 3.2.
size distributions for SS1 and SS2 (group 1 only), as shown                Figure 8a and b show the fine and mixed particle size dis-
in Fig. 7. The fine and mixed size distributions correspond             tributions for Algeria and Mauritania (group 1), respectively,
to the particles on the second- and first-stage filters, respec-        obtained by analyzing approximately 2000 particles. In this
tively, as discussed in Sect. 4.2. For SS1, the mass absorption         example, these distributions show considerably larger frac-
efficiency of both fine and mixed modes is in good agree-               tion of particles below 1 µm of diameter in Mauritania. Com-
ment up to wavelength of 600 nm. Above that, fine and mixed             pared to Mauritania, Algeria is more centered in the Saharan
modes deviate from each other, with the fine mode exhibiting            desert and closer to the major sources of dust and therefore
higher values. For SS2, the mass absorption efficiency for the          with higher fraction of fresh dust. Other studies also show
fine mode is slightly higher than the mixed mode for wave-              a decrease in coarse-mode fraction as sampling moves to-
lengths up to 600 nm, and both modes are compatible above               wards aged dust and away from fresh dust near the major
that. The uncertainties of these curves are represented by the          sources (Weinzierl et al., 2009, 2011; Ansmann et al., 2011;
bands plotted around the central value of the mass absorption           Ryder et al., 2013a, b).
efficiency corresponding to one standard deviation.                        The particle size distribution obtained by SEM images is
                                                                        the distribution sampled on the filter and for consistency this

Atmos. Chem. Phys., 18, 1023–1043, 2018                                                    www.atmos-chem-phys.net/18/1023/2018/
A. Rocha-Lima et al.: A detailed characterization of the Saharan dust collected during the Fennec campaign 1033
Figure 7. Spectral mass absorption efficiency (αabs ) for fine- and mixed-mode particles of the Saharan dust collected on filters during the
Fennec campaign in (a) Algeria and (b) Mauritania (group 1). Uncertainties shown as error bands in this figure were estimated by propagating
the error from the power law fitting, and they represent 1 standard deviation around the black lines.
Figure 8. Particle number and volume distribution versus particle diameter obtained by analysis of SEM images for a fine and a coarse filter
of Saharan dust sampled in (a) Algeria and (b) Mauritania (group 1). The size distribution obtained by SEM corresponds to the projected
area equivalent diameter of the particles. The lower panel in gray shows the AERONET size distribution for the period of the campaign
for (a) the BBM site, collocated with the LACO–UMBC aerosol sampling station, and (b) the Zouérat site, approximately 290 km from Bir
Moghrein. Note that AERONET volume density is per unit area, not volume, and is thus plotted with its own y-axis scale, shown in gray on
the right-hand side of the figures.
is the size distribution used to derive the optical properties of sieved using a 45 µm mesh grid. The resulting bulk sample
the dust collected on the filters using post-deployment mea- obtained had the required mass needed for the grain den-
surements in the laboratory. Note that SEM-derived size dis- sity measurements. The average grain density obtained for
tributions are not directly compared with size distributions the Saharan dust from Algeria was 2.69 ± 0.12 g cm−3 . Be-
from optical measurements or aerodynamic sizing without cause there was not enough material from SS2 in Mauritania
adjustments (Reid et al., 2003) that are not made in the work for a grain density analysis, we used the same grain density
presented here. for the samples of the group 1 collected at the supersite in
Mauritania.
5.3 Determination of grain density The grain density for dust particles reported in the lit-
erature range from 2.1 to 2.6 g cm−3 (Chen et al., 2011;
The technique used for the measurements of the grain density Reid and Maring, 2003; Reid et al., 2008; Wagner et al.,
is based on the determination of the volume of the sample us- 2012). Ryder et al. (2013a) used 2.65 g cm−3 to parameter-
ing the principle of gas displacement in a device under com- ize dust density during Fennec’s airborne measurements and
pressions and it requires a bulk sample of at least 1–2 g of the these values are compatible with our values measured in the
material, as was described in Rocha-Lima et al. (2014). The laboratory.
major dust storms in Algeria caused significant uplift and de-
position of dust on the surface of the instruments. Once the
instruments arrived back at UMBC, dust deposited on the
instrument surfaces was gently collected using a brush and
www.atmos-chem-phys.net/18/1023/2018/ Atmos. Chem. Phys., 18, 1023–1043, 20181034 A. Rocha-Lima et al.: A detailed characterization of the Saharan dust collected during the Fennec campaign
5.4 Determination of particle aspect ratio
Now that size distribution and particle grain density have
been determined, the final input needed to calculate αabs from
Eq. (3) is Qabs (m, x). If we assume that the particles are
spherical, we can use a Mie code to calculate Qabs (m, x).
However, the aspect ratio distribution of the particles shows
that they are typically non-spherical. Therefore, in addi-
tion to the Mie code, the extended-precision T-matrix code
(Mishchenko et al., 1996), assuming randomly oriented el-
lipsoidal particles, was used with a modified gamma distribu-
tion fitted to the measurements. The T-matrix code requires
aspect ratio of the particles as input. For the fine mode, the
value of the most probable aspect ratios used was obtained
as 1.3 for both supersites from the analysis of SEM images, Figure 9. Particle aspect ratio distribution obtained using scanning
electron microscopy (SEM) analysis for the fine-mode size distribu-
taken from the distribution shown in Fig. 9. This is for the
tion of Saharan dust from Algeria and from group 1 in Mauritania.
fine mode only, as the T-matrix code does not converge for
coarse particles in the wavelength range we are studying.
We note that the aspect ratio of mineral dust was measured of the refractive index of the mixed fraction remains nearly
to be 1.7 during AMMA–DABEX (Chou et al., 2008; Hay- constant relative to the values found for the fine fraction,
wood et al., 2008) and 1.7–1.9 from samples collected dur- which increases significantly as a function of the wavelength.
ing SAMUM (Wagner et al., 2012). In Morocco, for dust Similarly, the same behavior found for the Algeria fine mode
sizes with diameter > 0.5 µm the aspect ratio was 1.6 (Kan- is observed for both fine and mixed mode in Mauritania.
dler et al., 2009). In Cape Verde, similar aspect ratios were For the mixed mode in Mauritania, the mass absorption effi-
found (Kandler et al., 2011). ciency and refractive index were derived for wavelengths up
However, in a laboratory analysis of size-separated min- to 1850 nm. Above this wavelength the minimization method
eral dust the aspect ratio was 1.3 for small dust particles mea- did not converge within an acceptable error of 5 %. Also for
sured during SAMUM (Ansmann et al., 2011; Kandler et al., Mauritania, the retrieval of the imaginary part of the refrac-
2009), similar to the results of our SEM analysis of the fine- tive index using Mie theory introduced an uncertainty com-
mode filters. parable to the uncertainties from the measurements. This is
likely related to the presence of more fine particles in this su-
5.5 Derivation of spectral imaginary part of the persite. A possible explanation is the fact that the absorption
refractive index efficiency (Qabs ) has a sharper variation for smaller size pa-
rameters, which introduce more variability in the retrieval of
Finally, the imaginary part of the refractive index of the dust the mass absorption efficiency in Eq. (3).
particles was derived using a minimization method applied In a similar analysis Wagner et al. (2012) derive the spec-
for the mass absorption efficiency for each wavelength and tral imaginary part of the refractive index for a variety of min-
the results are shown in Fig. 10. This minimization consists eral dust samples, including samples collected during SA-
of finding the imaginary part of the refractive index in which MUM in Morocco. We compare our retrievals with their re-
the mass absorption efficiency derived from measurements of sults in Sect. 7.
optical reflectance (Fig. 7) matches the mass absorption ef-
ficiency calculated using Eq. (3). The real part of the refrac- 5.6 EDXRF analysis of Saharan dust
tive index is assumed to be a constant value of 1.56 for all
wavelengths. In the calculation of the absorption efficiency Selected dust samples collected in the Sahara were submitted
Qabs (m, x), the shape of the fine particles was considered to to EDXRF using an Epsilon 5 PanAnalytical spectrometer
be first spherical and then spheroidal using Mie theory and at the Atmospheric Physics Laboratory at University of Sao
T-matrix theory, respectively. For the mixed mode, only Mie Paulo. A total of 150 samples, including first- and second-
theory was used since the T-matrix algorithm did not con- stage filters from both supersites, were randomly selected for
verge for larger particles size. this analysis. Figure 11 shows the average concentration in
Figure 10a shows that the imaginary part of the complex percentage of the total mass of the main elements measured
refractive index for Saharan dust from Algeria has signifi- for samples from Algeria and Mauritania.
cant spectral differences between fine and mixed mode. Both Differences in the mean elemental composition can be
fine and mixed modes present a significant increase inversely seen between the supersites. Notably, SS2 in Mauritania has
proportional to wavelength below 600 nm. For longer wave- a higher concentration of sodium (Na) and chlorine (Cl),
lengths the values diverge considerably, as the imaginary part which suggest a “marine influence”. The Ca / Al ratio in
Atmos. Chem. Phys., 18, 1023–1043, 2018 www.atmos-chem-phys.net/18/1023/2018/A. Rocha-Lima et al.: A detailed characterization of the Saharan dust collected during the Fennec campaign 1035
Figure 10. Imaginary part of the complex refractive index derived for mixed and fine particles of Saharan dust from (a) Algeria and
(b) Mauritania (group 1). Mie theory and T-matrix were used assuming the real part of the refractive index Re(m) = 1.56 and grain den-
sity dp = 2.69 g cm−3 . The error bars of the imaginary part of the complex refractive index were estimated by studying the sensitivity of the
minimization method to the uncertainties of the real part of the refractive index, the mass absorption efficiency, the particles’ cross sections,
volume, and grain density.
Mauritania (0.57 and 0.64 for fine and mixed mode, respec-
tively) is larger than in Algeria (0.25 and 0.25 for fine and
mixed mode, respectively). That is in agreement with the
Ca / Al ratio decreases observed in the Sahara from west to
east described by Formenti et al. (2011). Source areas and
composition has also been linked in Scheuvens et al. (2013),
where they have found that (Ca + Mg) / Fe ratio is higher
for sources areas coincident with SS2 in Mauritania and usu-
ally lower for sources areas coincident with SS1 in Algeria.
The (Ca + Mg) / Fe ratio for Mauritania was found equal to
(1.74 and 1.58 for fine and mixed mode, respectively) and
(1.0 and 0.87 for fine and mixed mode, respectively) in Alge-
ria. In addition to Na and Cl, trace elements usually related to Figure 11. Mean mass concentration in percentage of the total mass
pollutants as vanadium (V), chromium (Cr), phosphorus (P), of the aerosol particles obtained for each element for fine and mixed
and sulfur (S) are observed in higher concentration in the mode (fine + coarse) of the Saharan dust from Algeria and Mauri-
fine mode at Mauritania. The concentrations of V in Algeria tania by energy dispersive X-ray fluorescence analysis (EDXRF).
and in the mixed mode in Mauritania were relatively low, on
the order of 100 ppm. These levels of V are compatible with
the natural abundance of this element in Earth’s crust (By- 6 Comparison between in situ and AERONET results
errum, 1991; ATSDR, 2012). However, the concentration in
the fine mode at Mauritania was on average 3000 ppm, in- 6.1 Comparison of scattering coefficient and total
dicating a significant contribution of anthropogenic sources column aerosol optical thickness
near this supersite. Differences in elemental composition are
made clear by plotting the ratio of Mauritania’s elemental Collocated measurements performed by an AERONET
composition relative to Algeria, as seen in Fig. 12a and b, Cimel sun photometer at SS1 in Algeria allowed us to com-
and the ratio of the fine and mixed modes in these supersites pare our local ground-based measurements and derivations
(Fig. 12c and d). with those obtained from total column measurements. For
The iron content is higher in the mixed mode, although example, the time series of the scattering coefficient pre-
the ratio of fine and mixed concentrations is still compatible sented in Sect. 3.2 was compared with AERONET (level 2.0)
with one from the estimated uncertainties. Despite that, if we AOT for the same period (Fig. 13). In Fig. 13a, based on
consider only the concentration of Fe in Fig. 11, the mean Marsham et al. (2013), Todd et al. (2013), and Garcia-
concentration in Algeria (6–7 %) is slightly higher than in Carreras et al. (2015), we assume a 5 km deep planetary
Mauritania (4.5–5.5 %). boundary layer (PBL) with a constant vertical profile of dust
in order to match the units with the scattering coefficient
measured by the nephelometer. We note that the clear condi-
tions observed during the first days of the experiment are also
apparent in the AERONET data. The AOT measurements are
www.atmos-chem-phys.net/18/1023/2018/ Atmos. Chem. Phys., 18, 1023–1043, 2018You can also read