A pre symptomatic incubation model for precision strategies of screening, quarantine, and isolation based on imported COVID 19 cases in Taiwan
←
→
Page content transcription
If your browser does not render page correctly, please read the page content below
www.nature.com/scientificreports
OPEN A pre‑symptomatic incubation
model for precision strategies
of screening, quarantine,
and isolation based on imported
COVID‑19 cases in Taiwan
Grace Hsiao‑Hsuan Jen1,4, Amy Ming‑Fang Yen1,4, Chen‑Yang Hsu2,3, Sam Li‑Sheng Chen1 &
Tony Hsiu‑Hsi Chen 2*
Facing the emerging COVID viral variants and the uneven distribution of vaccine worldwide, imported
pre-symptomatic COVID-19 cases play a pivotal role in border control strategies. A stochastic disease
process and computer simulation experiments with Bayesian underpinning was therefore developed
to model pre-symptomatic disease progression during incubation period on which we were based
to provide precision strategies for containing the resultant epidemic caused by imported COVID-
19 cases. We then applied the proposed model to data on 1051 imported COVID-19 cases among
inbound passengers to Taiwan between March 2020 and April 2021. The overall daily rate (per 100,000)
of pre-symptomatic COVID-19 cases was estimated as 106 (95% credible interval (CrI): 95–117) in
March–June 2020, fell to 37 (95% CrI: 28–47) in July–September 2020 (p < 0.0001), resurged to 141
(95% CrI: 118–164) in October–December 2020 (p < 0.0001), and declined to 90 (95% CrI: 73–108) in
January–April 2021 (p = 0.0004). Given the median dwelling time, over 82% cases would progress from
pre-symptomatic to symptomatic phase in 5-day quarantine. The time required for quarantine given
two real-time polymerase chain reaction (RT-PCR) tests depends on the risk of departing countries,
testing and quarantine strategies, and whether the passengers have vaccine jabs. Our proposed four-
compartment stochastic process and computer simulation experiments design underpinning Bayesian
MCMC algorithm facilitated the development of precision strategies for imported COVID-19 cases.
As of 31st May 2021, coronavirus disease 2019 (COVID-19) pandemic has resulted in over 170 million cases and
claimed 3.55 million lives after more than two large epidemic waves that had emerged between March and June
2020 and then resurged from October 2020 until May 2 0211. It is well understood that most of these re-surging
epidemics in the wake of the antecedent epidemic that has been already contained after the implementation of
non-pharmaceutical interventions (NPIs) were originated from the spread of those imported COVID-19 cases.
As imported COVID-19 cases play an important role in the global spread of COVID-19, all strategies of border
control (including screening, quarantine, and isolation) of inbound and outbound passengers are therefore
urgently needed before the full uptake of effective vaccine worldwide.
However, there is a trade-off between border control for containing COVID-19 and re-opening travel to
resume pre-pandemic social and economic activities. One of solutions is to provide precision strategies of border
control based on screening measures together with quarantine and isolation days as short as possible for travel-
ers at international travel points of entry to each country or region. It is even important to provide precision
strategies of border control for vaccinated and unvaccinated t ravelers2,3.
Of all transmission modes, the pre-symptomatic mode and the asymptomatic mode may play a more impor-
tant role in border control of imported COVID-19 cases compared with the symptomatic mode because those
who are symptomatic at the points of entry would be isolated but those asymptomatic and pre-symptomatic
1
School of Oral Hygiene, College of Oral Medicine, Taipei Medical University, Taipei,
Taiwan. 2Institute of Epidemiology and Preventive Medicine, College of Public Health, National Taiwan University,
Taipei, Taiwan. 3Department of Emergency, Dachung Hospital, Miaoli, Taiwan. 4These authors contributed equally:
Grace Hsiao-Hsuan Jen and Amy Ming-Fang Yen. *email: chenlin@ntu.edu.tw
Scientific Reports | (2022) 12:6053 | https://doi.org/10.1038/s41598-022-09863-w 1
Vol.:(0123456789)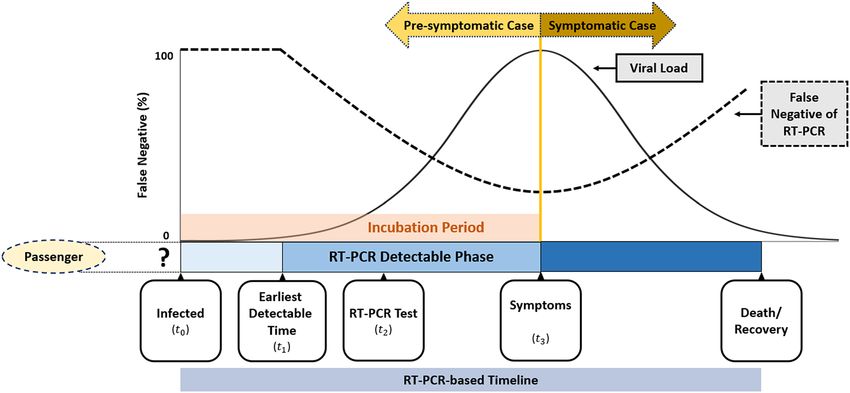
www.nature.com/scientificreports/
cases can only be detected through real-time polymerase chain reaction (RT-PCR) test or in quarantine until
the presence of symptom for those pre-symptomatic cases. Ferretti et al. estimated that the contribution to the
epidemic in China 2020 included 46% from pre-symptomatic cases, 38% from symptomatic cases, 10% from
asymptomatic cases, and 6% from environmentally medicated transmission via c ontamination4. However, a series
of meta-analyses have shown the heterogeneity of the proportion of asymptomatic cases ranging from 8.44% (95%
CI: 5.12–13.62%) to 48% (95% CI: 30–67%)5–10, which may be a reflection of geographic variation with respect
to test strategies, the dominance of severe acute respiratory syndrome coronavirus 2 (SARS-CoV-2) variants,
and coverage rate of vaccination. Estimation of the distribution of different transmission modes considering the
geospatial variation and the recent emerging variant of concern is needed when the global travelling is re-opened
and precision strategies are provided for those under the suspicion of asymptomatic and pre-symptomatic cases
during border c ontrol11.
The gold standard of evaluating these border control strategies is to conduct a series of randomized controlled
trials (RCTs) in the domain of public health. However, it is impracticable for the emergency use during COVID-
19 pandemic and also for delicate precision strategies designed by the conventional R CTs12,13. The alternative
resorts to modelling the natural history of COVID-19 in the absence of strategies and then making use of com-
puter simulation experiments on precision strategies, both of which are pertaining to two key parameters, the
chance of being pre-symptomatic after the exposure to infective abroad calibrated by the risk-stratified countries
or regions and the dwelling time from pre-symptomatic to the presence of symptoms, making allowance for
one ancillary parameter, the daily rate of being asymptomatic (detected with RT-PCR) given close contacts with
symptomatic cases. The chance of being pre-symptomatic and asymptomatic measures the risk level of conta-
giousness of each region/county. The dwelling time for pre-symptomatic cases determines the optimum time
required for quarantine. The attempt made to consider the heterogeneity across countries and regions, the period,
and the coverage and the efficacy of vaccination administered in each country or region can further facilitate
precision quarantine and isolation policy. In addition, given the fast evolution of variants of concern (VOC)
that have different behaviors, such as higher transmissibility like Omicron or higher virulence like D elta14,15, a
natural history model of COVID-19 using data from different epoch with varying dominant VOCs can further
facilitate the adjustment for the quarantine and isolation policy.
We propose a pre-symptomatic incubation model to estimate the natural history from the occurrence of
being pre-symptomatic and the subsequent progression from pre-symptomatic to symptomatic phase with the
parameters directly estimated with data on imported cases flown into Taiwan between March 2020 and April
2021, covering four phases, the first period (March–June 2020), the second period (July–September 2020),
the third period (October–December 2020), and the fourth period (January–April 2021). The country/region-
dependent incidence rate and dwelling time were directly estimated. Based on these two parameters by period
and country or region, computer simulation experiments were envisaged and conducted to provide precision
strategies for the frequencies of RT-PCR test and the optimal interval of quarantine and isolation for vaccinated
and unvaccinated travelers in the face of the imported viral variants.
Results
Descriptive results. There were a total of 757,453 arrivals between March 2020 and April 2021, of whom
we ascertained 290 symptomatic cases upon arrival, 283 pre-symptomatic cases during 14-day self-quarantine
and self-isolation and 478 asymptomatic cases. The frequencies of three types of imported cases among the pas-
sengers flown to Taiwan from different areas in March–June, July–September, October–December 2020, and
January–April 2021 around the world are detailed in Supplementary Table S1.
Disease progression for COVID‑19. The overall daily rate (per 100,000) of being pre-symptomatic dur-
ing RT-PCR detectable phase was 106 (95% CrI (credible interval): 95–117; interquartile range (IQR): 102–110)
in the first period, fell to 37 (95% CrI: 28–47; IQR: 34–40) in the second period (p < 0.0001), resurged to 141
(95% CrI: 118–164; IQR: 132–149) in the third period (p < 0.0001), and declined to 90 (95% CrI: 73–108; IQR:
84–96) in the fourth period (p = 0.0004) (Table 1). The corresponding median dwelling times were 3.44 (95%
CrI: 3.09–3.82; IQR: 3.64–3.85), 4.26 (95% CrI: 2.94–6.00; IQR: 3.71–4.73), 4.01 (95% CrI: 3.27–4.86; IQR: 3.73–
4.28), and 4.44 (95% CrI: 3.65–5.36; IQR: 4.14–4.73) days.
The lower bottom panel of Table 1 shows the corresponding figures of all estimates for the USA and the UK,
and the UK for the vaccinated travelers. Regarding the vaccinated travelers, the daily incidence rate (per 100,000)
of pre-symptomatic cases was reduced to 42 (95% CrI: 8–127; IQR: 21–53), which renders the proportion of
asymptomatic cases soar up to 65.5% (95% CrI: 24.5–93.2%; IQR: 52.6–80.3%) as the pre-symptomatic and
symptomatic cases were substantially reduced by vaccination. The corresponding proportions of asymptomatic
cases among those who showed no signs and symptoms increased from 16.7% (95% CrI: 13.3–20.5%; IQR:
15.4–17.9%) in the first period, 28.5% (95% CrI: 19.0–38.8%; IQR: 25.0–31.9%) in the second period (p = 0.0102),
30.4% (95% CrI: 22.1–39.4%; IQR: 27.5–33.5%) in the third period (p < 0.0001), and 47.8% (95% CrI: 40.2–55.9%;
IQR: 45.0–50.5%) in the fourth period (p < 0.0001).
Figure 1a shows the instantaneous potential of progression from pre-symptomatic to symptomatic phase with
time (in day), which increased with time until days 3–4 after being infected and decreased afterwards. It was
estimated that around 80.9% and 90.0% of pre-symptomatic cases in the first phase would develop symptoms
in 5 and 7 days, respectively (Fig. 1b). These findings suggest the scheduled time required for quarantine and
isolation. The corresponding figures were 71.7% and 84.3% for the second period, 74.2% and 85.9% for the third
period, and 68.8% and 82.4% for the fourth period. About 98% pre-symptomatic cases turning into symptomatic
phase would be expected during a 14-day quarantine irrespective of any period.
Scientific Reports | (2022) 12:6053 | https://doi.org/10.1038/s41598-022-09863-w 2
Vol:.(1234567890)www.nature.com/scientificreports/
Daily risk of being pre-symptomatic (per 105) Median time to develop symptoms (Days) Proportion of asymptomatic case (%) (95%
(95% CrI) (95% CrI) CrI)
March 2020–April 2021 101 (94–109) 3.64 (3.17–4.14) 26.5 (23.4–29.7)
By period
March–June 2020 106 (95–117) 3.44 (3.09–3.82) 16.7 (13.3–20.5)
July–September 2020 37 (28–47) 4.26 (2.94–6.00) 28.5 (19.0–38.8)
October–December 2020 141 (118–164) 4.01 (3.27–4.86) 30.4 (22.1–39.4)
January–April 2021 90 (73–108) 4.44 (3.65–5.36) 47.8 (40.2–55.9)
UK and USA in October–December 2020
UK 357 (164–617) 6.04 (3.32–9.86) 30.3 (10.4–55.7)
USA 283 (194–384) 3.24 (2.45–4.13) 22.0 (10.9–36.1)
UK and USA in January–April 2021
UK 123 (39–244) 5.02 (1.93–10.09) 55.1 (28.1–81.0)
USA 157 (101–227) 3.61 (2.53–4.91) 44.4 (30.0–59.5)
Vaccinated travelers from UK
42 (8–127) – 65.5 (24.5–93.2)
Table 1. The estimated daily rate of being pre-symptomatic and asymptomatic, and progression from pre-
symptomatic to symptomatic COVID-19 among Taiwanese imported cases. Vaccinated travelers from UK: The
vaccine efficacy was applied to the scenario in the UK in October–December 2020.
(a) (b)
0.5 1
Mar.-June 2020
0.9
July-Sep. 2020
Cumulative probability
0.4 0.8
Oct.-Dec. 2020
0.7
Hazard rate
Jan.-Apr., 2021
0.3 0.6
Mar.-June 2020
0.5
0.2 0.4 July-Sep. 2020
0.3 Oct.-Dec. 2020
0.1 0.2 Jan.-Apr., 2021
0.1
0
0 2 4 6 8 10 12 14 0
0 2 4 6 8 10 12 14
Time since entering into the RT-PCR deteable phase (days) Time since entering into the RT-PCR deteable phase (days)
(c) (d)
0.6
1
Area 1 Area 2
0.9
0.5 Area 3 Area 4
0.8
Cumulative probability
Area 5 Area 6
0.7
0.4 Area 7
0.6
Hazard rate
0.3 0.5
0.4 Area 1 Area 2
0.3 Area 3 Area 4
0.2
Area 5 Area 6
0.2
Area 7
0.1 0.1
0
0 2 4 6 8 10 12 14
0.0
0 2 4 6 8 10 12 14 Time since entering into the RT-PCR deteable phase (days)
Time since entering into the RT-PCR deteable phase (days)
Figure 1. Clinical characteristics of COVID-19 of developing symptoms for pre-symptomatic cases of COVID-
19. (a) Hazard rate (b) Cumulative probability of developing symptoms (c) Hazard rate by area during March
and June 2020 (d) Cumulative probability of developing symptoms by area during March and June 2020,
Taiwan; Area 1: Asia; Area 2: Oceania; Area 3: North and South America, excluding the U.S.; Area 4: U.S.; Area
5: Europe, excluding the U.K.; Area 6: U.K.; Area 7: Africa.
For the time to develop symptoms among pre-symptomatic cases, the higher the incidence rate, the shorter
the dwelling time. The hazard rate and cumulative probabilities of developing symptoms from pre-symptomatic
phase by areas are delineated in Fig. 1c,d. The estimated results by areas are provided in Supplementary Table S2.
Scientific Reports | (2022) 12:6053 | https://doi.org/10.1038/s41598-022-09863-w 3
Vol.:(0123456789)www.nature.com/scientificreports/
March–June 2020 by risk of the departing countries October–December 2020 January–April 2021
Missed cases
of imported Intermediate- UK,
Strategy COVID-19 Low-risk risk High-risk UK USA UK USA vaccinated
Arm1: Two RT-PCRs + 5-d Q (Sensitivity: 95% and 80%)
Pre-symptomatic 0.3 (0.1–0.6) 0.3 (0.2–0.5) 0.7 (0.3–1.4) 0.6 (0.1–1.5) 0.1 (0.0–0.2) 0.2 (0.0–0.6) 0.1 (0.0–0.2) 0.1 (0.0–0.3)
Asymptomatic 0.1 (0.0–0.3) 0.9 (0.6–1.2) 1.1 (0.3–2.6) 0.9 (0.3–1.8) 0.4 (0.2–0.6) 0.7 (0.3–1.3) 0.6 (0.3–0.9) 0.4 (0.1–1.2)
Arm1-1: Two RT-PCRs + 7-d Q (Sensitivity: 95% and 80%)
Pre-symptomatic 0.2 (0.0–0.4) 0.2 (0.1–0.3) 0.3 (0.1–0.7) 0.4 (0.1–1.1) 0.0 (0.0–0.1) 0.1 (0.0–0.4) 0.0 (0.0–0.1) 0.1 (0.0–0.4)
Asymptomatic 0.1 (0.0–0.3) 0.9 (0.6–1.2) 1.1 (0.3–2.6) 0.9 (0.3–1.8) 0.4 (0.2–0.6) 0.7 (0.3–1.3) 0.6 (0.3–0.9) 0.4 (0.1–1.2)
Arm1-2: Two RT-PCRs + 14-d Q (Sensitivity: 95% and 80%)
Pre-symptomatic 0.0 (0.0–0.2) 0.0 (0.0–0.1) 0.1 (0.0–0.2) 0.1 (0.0–0.4) 0.0 (0.0–0.0) 0.0 (0.0–0.2) 0.0 (0.0–0.0) 0.0 (0.0–0.1)
Asymptomatic 0.1 (0.0–0.3) 0.9 (0.6–1.2) 1.1 (0.3–2.6) 0.9 (0.3–1.8) 0.4 (0.2–0.6) 0.7 (0.3–1.3) 0.6 (0.3–0.9) 0.4 (0.1–1.2)
Arm2: One RT-PCR + 5-d Q (Sensitivity: 95%)
Pre-symptomatic 1.3 (0.3–3.2) 1.7 (1.1–2.6) 3.3 (1.3–6.8) 3.0 (0.7–7.4) 0.4 (0.1–0.8) 0.8 (0.0–2.7) 0.3 (0.1–0.8) 0.4 (0.0–1.3)
Asymptomatic 0.6 (0.2–1.5) 4.6 (3.2–6.1) 5.4 (1.6–13.2) 4.5 (1.6–8.8) 1.9 (0.8–3.2) 3.4 (1.4–6.6) 2.9 (1.7–4.4) 2.1 (0.5–5.9)
Arm2-1: One RT-PCR + 7-d Q (Sensitivity: 95%)
Pre-symptomatic 0.8 (0.2–2.2) 0.9 (0.5–1.5) 1.7 (0.6–3.7) 2.1 (0.4–5.6) 0.2 (0.1–0.4) 0.5 (0.0–2.2) 0.2 (0.0–0.4) 0.3 (0.0–1.0)
Asymptomatic 0.6 (0.2–1.5) 4.6 (3.2–6.1) 5.4 (1.6–13.2) 4.5 (1.6–8.8) 1.9 (0.8–3.2) 3.4 (1.4–6.6) 2.9 (1.7–4.4) 2.1 (0.5–5.9)
Arm2-2: One RT-PCR + 14-d Q (Sensitivity: 95%)
Pre-symptomatic 0.2 (0.0–0.8) 0.2 (0.1–0.3) 0.4 (0.1–0.8) 0.6 (0.1–2.1) 0.0 (0.0–0.1) 0.2 (0.0–1.0) 0.0 (0.0–0.1) 0.1 (0.0–0.3)
Asymptomatic 0.6 (0.2–1.5) 4.6 (3.2–6.1) 5.4 (1.6–13.2) 4.5 (1.6–8.8) 1.9 (0.8–3.2) 3.4 (1.4–6.6) 2.9 (1.7–4.4) 2.1 (0.5–5.9)
Arm3: 14-d Q
Pre-symptomatic 4.2 (0.6–15.0) 3.9 (1.9–6.9) 7.0 (2.2–16.2) 12.5 (1.5–41.2) 0.8 (0.2–1.9) 3.4 (0.1–19.9) 0.7 (0.1–2.0) 1.5 (0.1–6.6)
108.5 (32.4– 90.2 (32.9– 68.4 (27.8–
Asymptomatic 12.2 (3.5–30.9) 91.9 (64.7–123.0) 37.6 (16.8–64.3) 57.2 (34.9–87.2) 42.2 (10.2–118.5)
263.3) 176.6) 132.2)
Table 2. Simulated number of missed cases of imported passengers in the randomized controlled design
during March and June in Taiwan using Markov Chain Monte Carlo methods x-d Q: x-day quarantine; UK,
vaccinated: The vaccine efficacy was applied to the scenario in the UK in October–December 2020.
Results of three‑arm computer simulation experiments. By three risk groups defined by the daily
rate of being pre-symptomatic (low- [< 300 per 100,000], intermediate- [300–500 per 100,000], and high-risk
[> 500 per 100,000] group) during the first period (March–June), the simulated results based on the estimated
parameters are shown in Table 2. These yielded the numbers of unidentified pre-symptomatic and symptomatic
COVID-19 cases for three policies in the light of computer simulation experiments rolled shown in Supplemen-
tary Fig. S1, assuming 95% and 80% sensitivity of first and second of RT-PCR test. The Arm 1 following two RT-
PCR tests with 5-day quarantine and isolation would not find any COVID-19 case regardless of any risk group
and the periods, and the scenario for the vaccinated travelers from the UK. The corresponding figures for uni-
dentified pre-symptomatic and asymptomatic COVID-19 cases were 6.3 (including 1.3, 1.7, and 3.3 from low-,
intermediate-, and high-risk group, respectively) and 10.6 (including 0.6, 4.6, and 5.4 from low-, intermediate-,
and high-risk group, respectively) for the second policy following one RT-PCR test with 5-day quarantine and
isolation in the first period of March–June. The corresponding figures for the third period of October–December
2020 were 3.0 and 4.5 for the UK and 0.4 and 1.9 for the USA, respectively. With 50.6% and 43.3% population
receiving at least one dose of vaccine in the UK and USA in January–April 2021, the number was reduced to 0.8
and 3.4 for the UK and 0.3 and 2.9 for the USA. However, pre-symptomatic and asymptomatic cases would be
further reduced to 0.4 and 2.1 if only vaccinated travelers from the UK is considered. The third policy following
14-day self-quarantine and self-isolation without RT-PCR test exhibited 15.1 (including 4.2, 3.9, and 7.0 from
low-, intermediate-, and high-risk group, respectively) pre-symptomatic cases and 212.6 (including 12.2, 91.9,
and 108.5 from low-, intermediate-, and high-risk group, respectively) asymptomatic cases. The corresponding
figures for the third period of October–December 2020 were 12.5 and 90.2 for the UK and 0.8 and 37.6 for the
USA, respectively. In the fourth period of January–April 2021, the number was further reduced to 3.4 and 68.4
in the UK and 0.7 and 57.2 in the USA. Pre-symptomatic and asymptomatic cases were reduced to 1.5 and 41.7
for the vaccinated travelers from the UK. The similar findings were noted for the requirement of 7 and 14 days
of quarantine.
Figure 2 shows precision strategies of various lengths of quarantine and isolation according to the risk clas-
sification of country and region given two or one RTR-PCR test policy. The higher the risk group (Areas 6 and
7 were the highest risk group) was, the longer the day of the scheduled quarantine was. The third period of
October–December 2020 required a longer quarantine for the UK even two RT-PCR tests were applied. The
vaccination reduced the time required for quarantine in both partial vaccinated in the fourth period. Specifi-
cally, the vaccinated travelers in the UK required only two days given one test. It should be noted that screening,
quarantine, and isolation on border control can be lifted for the vaccinated travelers if the incidence of pre-
symptomatic COVID-19 can be lowered to less than 40 per 100,000 of the country or region where imported
cases come from those the vaccine uptake.
Scientific Reports | (2022) 12:6053 | https://doi.org/10.1038/s41598-022-09863-w 4
Vol:.(1234567890)www.nature.com/scientificreports/
Figure 2. Precision quarantine days for RT-PCR test negative passengers after arrival at airport by the risk
of the departing areas and the RT-PCR administrative strategy (a) Two RT-PCRs with varying duration of
quarantine (b) One RT-PCR with varying duration of quarantine; Area 1: Asia; Area 2: Oceania; Area 3: North
and South America, excluding the U.S.; Area 4: U.S.; Area 5: Europe, excluding the U.K.; Area 6: U.K.; Area 7:
Africa; UK, vaccinated: The vaccine efficacy was applied to the scenario in the UK in October–December 2020.
Discussion
We developed a four-compartment stochastic process with Bayesian MCMC algorithm to model a natural history
process from uninfected, pre-symptomatic, until symptomatic phase, making allowance for asymptomatic cases,
evolving with virus shedding and also the dynamics in the accuracy of RT-PCR test. Based on the two estimated
parameters of the daily rate of being pre-symptomatic and the subsequent dwelling time from pre-symptomatic
to symptomatic phase, a series of computer simulation experiments were conducted to provide precision border
control strategies for inbound passengers.
Scientific Reports | (2022) 12:6053 | https://doi.org/10.1038/s41598-022-09863-w 5
Vol.:(0123456789)www.nature.com/scientificreports/
Specifically, these two applications can be illuminated as follows. First, the daily rate of being pre-symptomatic
can be used to stratify the risk of the underlying country/region. Here, we classified seven areas from the lowest
to the highest risk in the first period. This estimate is very informative to monitor the epidemic trend of the evo-
lution of virus variants with time, the effectiveness of NPIs and vaccine. It can be clearly seen that this estimate
increased from 106, dropped to 37, rose again to 141 and 90 in the third and the fourth periods, corresponding
to the dominant virus variant of D614G in the first period and the new virus variant of B.1.1.7 (Alpha) and
B.1.351 (Beta) in the latter two periods, suggesting a 33% increase in the risk of infection. The comparisons of
this estimate between the first pandemic period and the second containment period revealed 65% effectiveness
of NPIs. The comparison between the vaccinated traveler and the overall risk in the third period suggest 70%
effectiveness of vaccine at the start of the phase 4 post-market surveillance. It can be further demonstrated with
a 36% effectiveness of vaccination covering around half of passengers from the UK in the fourth period. The
second contribution of this study is to provide an insight into the development of the optimal length (day) of
quarantine and isolation. The proportion of turning pre-symptomatic to symptomatic cases was up to 80% after
five days of self-quarantine and -isolation, and reached to almost 100% after 14 days. Based on these estimates,
the time required for quarantine after the administration of RT-PCR test can be reduced from 14 to 5 days as none
of COVID-19 cases would be found when two tests with 95% and 80% sensitivity of RT-PCR for the first and the
second are offered. The negligible COVID-19 cases would be missed even only one RT-PCR test is administered.
Information provided for the vaccinated traveler makes even important contribution to shortening the time
required for quarantine into two days while vaccine is distributed but has yet reached the full implementation.
More importantly, testing and quarantine measures on border control can be lifted if the risk of pre-symptomatic
case is lowered after vaccination. Our estimated results not only provided a refined risk classification by country/
region but also proposed a precise scheduled quarantine and isolation with and without considering RT-PCR
test as shown in Supplemental Fig. S1.
This is the first study, to the best of our knowledge, to fit the proposed four-compartment stochastic natural
history model of COVID-19 with Bayesian MCMC algorithm to empirical data on imported cases, yielding the
empirical estimates of the daily risk of being pre-symptomatic and the subsequent progression rate from pre-
symptomatic to symptomatic phase together with risk of being asymptomatic through RT-PCT test for close
contact with symptomatic imported cases. The median dwelling time from a pre-symptomatic to symptomatic
phase was estimated as 3.4 days in the first period, which is longer than the 2.3 days in an early outbreak in
Wuhan, China16. The disease progression rate might vary from country to country, which possibly depends on
virus shedding. Since Taiwan is a very low infection area with very few identified COVID-19 cases the govern-
ment policy for the identification of pre-symptomatic imported COVID-19 cases when they had passed through
airport resorts to 14-day self-quarantine and self-isolation until they turned to symptomatic cases. The empiri-
cal data on Taiwanese imported COVID-19 cases provide a natural opportunity to model the natural history of
COVID-19 from different countries and regions. We also estimated the proportion of asymptomatic cases based
on empirical data from Taiwan. The estimated 16.7% of asymptomatic cases was close to a recent meta-analysis
(17%) in the same first period of our s tudy6. However, it can be seen that the proportion of asymptomatic cases
increased in the latter periods, which may be attributed to the frequent application with RT-PCR test and emerg-
ing viral variants. As mentioned in the method section, the natural history model also provides the equivalent
control group as used in the randomized controlled trial without being affected by RT-PCR test, namely 14-d Q
as shown in Table 2, for the comparison of a series of intervention groups with RT-PCR test and precise intervals
for quarantine and isolation. It should be noted that the main advantage of using RT-PCR test as opposed to self-
quarantine and self-isolation with 14-day is to facilitate the early detection of pre-symptomatic and asymptomatic
COVID-19. The former may be re-captured until they turned to symptomatic cases during 14-day self-quarantine
and self-isolation but the latter has to be identified through RT-PCR test. Although the viral variants emerged in
the latter period and the sensitivity of antigen tests may be reduced, those pre-symptomatic and asymptomatic
COVID-19 cases with high viral load still can be detected by RT-PCR test17–19. In addition to our study, a recent
study conducted by Dicken et al.20 has used a mathematic formula to evaluate the impact of border control and
quarantine measures based on the imported and secondary cases from different epidemic regions. However, their
proposed method may not be specified for targeting pre-symptomatic COVID-19 cases as their method did not
separate pre-symptomatic cases from asymptomatic cases. Their study focused on the first pandemic period but
our study covers three periods. The proposed method and results here would not only monitor the epidemic
trend evolving with viral variants with time but also provide an opportunity to develop precision strategies for
vaccinated and unvaccinated travelers.
There are limitations in this study. Firstly, as indicated in Fig. 3, our simulation results would be affected by
the test sensitivity. In this study, the RT-PCR assays as used for screening with sensitivity varying with time but
assuming the quality of laboratory diagnosis is identical across countries. However, the results of identifying
COVID-19 cases relying on RT-PCR assays may vary with countries because of other factors related to laboratory
diagnosis, including sampling location, improper clinical sampling, the quality of RNA extraction, the sensitivity
of the detection kits and the variation of targeted viral RNA s equences21. This could be improved by changing the
criteria from laboratory diagnosis to clinical diagnosis with more competent computer tomography22. However,
whether the criteria of clinical diagnosis is appropriate for border control deserves a further research. Secondly,
the current results in this study can only be applied to the known variants of concern (VOC) encountered in this
study, such as D614G and VOC Alpha. With varying characteristics of each VOC, a substantial modification of
the solutions proposed in this study has to be considered.
In summary, we developed a pre-symptomatic incubation model governing the occurrence and the progres-
sion of pre-symptomatic COVID-19 cases on which we are based to design precision containment in border
control of imported cases with the optimal frequencies of RT-PCR test and the optimal interval of quarantine
Scientific Reports | (2022) 12:6053 | https://doi.org/10.1038/s41598-022-09863-w 6
Vol:.(1234567890)www.nature.com/scientificreports/
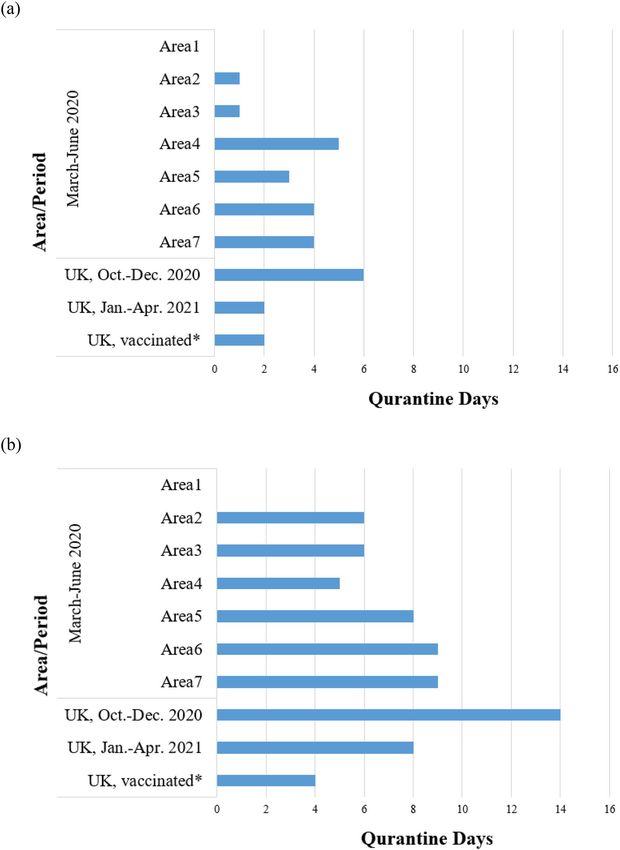
Figure 3. The conceptual diagram for the RT-PCR-based defined disease progression in association with the
detectability of the test.
and isolation. The findings for vaccinated and unvaccinated travelers have significant implications for resuming
pre-pandemic social and economic activity when facing the imported COVID viral variants and the uneven
distribution of vaccine globally.
Materials and methods
The pre‑symptomatic incubation COVID‑19 model. In order to estimate the occurrence and the
dwelling time of the imported pre-symptomatic COVID-19 through RT-PCR test or self-quarantine, we here
build up a novel natural history model for depicting the dynamic process of being pre-symptomatic first and
then surfacing to symptomatic phase as shown in Fig. 3 instead of following the conventional infectious process
of COVID-19 from infected time, time to become infectious, the disease onset of showing symptoms although
both are correlated through the evolution of viral load from pre-symptomatic to symptomatic phase. The reason
of introducing RT-PCR detectable phase from the earliest detectable time to the presence of symptoms is that
pre-symptomatic COVID-19 can only be detected by RT-PCR until the viral load rises to the detectable thresh-
old. Accordingly, there are two main clinical parameters of interest in such a dynamic natural course, the daily
rate of being pre-symptomatic and the mean dwelling time between pre-symptomatic and symptomatic phase
during incubation period. The sensitivity of RT-PCR may also vary with the evolution of disease progression
and the viral load. Note that asymptomatic cases would be defined when the dwelling time is infinite when no
RT-PCR test is administered.
Following the Fig. 3, all imported cases of COVID-19 are classified into three types, symptomatic, pre-
symptomatic, and asymptomatic cases (Supplementary Fig. S2). The symptomatic cases were defined for those
reporting symptoms upon arrival. Those who had no symptoms when arriving at the airport, but developed
symptoms during self-quarantine, were classified as pre-symptomatic cases. The asymptomatic cases included
those who have never developed symptoms but were confirmed with RT-PCR examinations in the period of
quarantine because of close contact with symptomatic COVID-19 cases.
Containment measures for COVID‑19 in Taiwan. Since 2004, all airports in Taiwan have been equipped
with infrared temperature measuring instruments to screen and identify passengers with fever in response to the
outbreak of SARS occurring in 200323,24. After the confirmed cases of COVID-19 surged up in Wuhan in early
January, Taiwan Centers of Disease Control listed SARS-CoV-2 as a category 5 among all communicable diseases
on 15th January, which also includes Middle East respiratory syndrome coronavirus (MERS-CoV), H7N9 influ-
enza, Ebola virus disease, and yellow fever. The Central Epidemic Command Center (CECC) was established
on 20th January to integrate the resource of the administration sectors and hold daily press for reporting the
epidemic profiles of COVID-19 cases.
There are several decisive time points for border control in an attempt to contain the community-acquired
outbreak of COVID-19 in Taiwan 25–27. On 7th February, Taiwanese government launched a border control to
stop foreign travelers, who had visited or resided in mainland China, Hong Kong and Macao within 14 days,
from entering Taiwan. Since then, all Taiwanese residents coming back from mainland China followed a 14-day
home quarantine. For those having shown symptoms upon arrival, they would receive an instant RT-PCR test
at airport and be sent to hospitals for isolation. Only those with two consecutive negative results (24 h apart)
can be released and go home, but they were still required to have another 14-day home quarantine. Those with a
Scientific Reports | (2022) 12:6053 | https://doi.org/10.1038/s41598-022-09863-w 7
Vol.:(0123456789)www.nature.com/scientificreports/
RT-PCT positive result should stay at hospitals and can only be discharged after three consecutive negative tests.
The close contacts of the confirmed cases were also requested to have a 14-day home quarantine.
Following the surge of confirmed cases in Europe and in the U.S. in early March, the CECC further announced
the border control, quarantine and isolation measures on 14th March to all passengers who travelled back from
areas with high epidemic risks in addition to China. An advanced travel ban, which rejected all foreign nationals
from entering Taiwan as of 19th March onward, was issued. All Taiwanese entering Taiwan had to also follow
the 14-day home quarantine measure. In addition, the CECC commended a retrospective health monitoring on
those with a travel history within 14 days in Europe and in the U.S. They were required to contact local health
authorities and those with symptoms must be tested. Note that such a travel ban would affect the estimation
of parameters in relation to the disease natural history of imported cases from different countries in different
periods.
Data sources. To elucidate the abovementioned natural history of COVID-19, we targeted the imported
cases of COVID-19 among inbound passengers around the world who flew into Taiwan between March 2020
and April 2021 and excluded domestic cases infected in Taiwan as the latter may also include the unknown
origin of contact history that may preclude us from estimating the relevant parameters of natural history. For
each confirmed case, data were retrieved from a repository that has summarized information on imported cases
reported by the CECC in Taiwan28. Information on the time stamped on the date of arrival and departure from
foreign countries, date of arrival at Taiwan, date of the occurrence of clinical symptoms, and date of RT-PCR test
were abstracted from the CECC press. Note that the starting date and time at point of entry to Taiwan consist of
two categories, departure from and arrival to Taiwan for Taiwanese citizenship and departure from the disem-
barked country and the arrival to Taiwan for foreigners. Following the guideline of Taiwan CECC, for a subject
with suspected symptoms of COVID-19 including fever, cough, short of breath, fatigue, myalgia, diarrhea, and
anomaly in smell and taste, they would be tested for SARS-CoV-2 infection with RT-PCR twice within 24 h. For
inbound passengers without symptoms, it is mandatory for these subjects to be under quarantine for 14 days.
The quarantined subjects were tested for SARS-CoV-2 upon the occurrence of suspected symptoms during
their 14-day quarantine28. Information on the origin of country/region for these inbound cases were also col-
lected. Supported by the empirical data of time to show symptoms of COVID-19 upon entry and during 14-day
quarantine period, we estimated the daily rates of being pre-symptomatic as well as the dwelling time from pre-
symptomatic to symptomatic phase. Date on the number of passengers arriving at Taiwan with information on
the departure countries were retrieved from the open data source of the Ministry of Transportation and Com-
munications, Taiwan29 and Ministry of the Interior National Immigration Agency, Taiwan30. All methods were
carried out in accordance with relevant guidelines and regulations.
Bayesian MCMC algorithm for estimating parameters. To estimate the daily rate of being pre-symp-
tomatic and asymptomatic and the dwelling time from pre-symptomatic to symptomatic phase, we applied a
four-state stochastic model to quantify the disease progression from uninfected (State 1), through pre-symp-
tomatic phase (State 2), and finally to symptomatic phase (State 3) or still remained asymptomatic phase (State
4) in the light of the previously established multi-state stochastic model31–33 (Supplementary Fig. S3). The daily
rate of being pre-symptomatic COVID-19 provides the risk stratification of the country/region where imported
COVID-19 cases travelled from. The dwelling time plays a crucial role in the determination of the optimal
length of self-quarantine and self-isolation and also the time required for the scheduled quarantine and isolation.
Given the evidence that viral shedding changed over time since e xposure34, we applied the log-logistic function
to estimating the transition rate from pre-symptomatic to symptomatic phase for the possible inverse U-shape
of the contagiousness of SARS-CoV-2. Bayesian MCMC algorithm was used to estimate the point estimate and
95% credible interval of the relevant parameters in the light of the posterior distribution that was formed by
non-informative prior and the likelihood function supported by the empirical data on different subtypes of
imported cases as shown in Supplementary Fig. S2. The mathematical likelihood function forms refer to the
previous study on the application of the stochastic model35–37. Note that the asymptomatic cases detected by
RT-PCR test would be analogous to over-detected cases if the screening is offered as asymptomatic COVID-19
like over-detected cases in screening would have not been found had the RT-PCR screening been not adminis-
tered. In order to make the asymptomatic proportion representative of the underlying imported cases instead of
being limited to the contacts, we incorporated the proportion of asymptomatic cases in some particular groups
(such as the member in a travelling group with more than 2 confirmed COVID-19 cases) for whom the RT-PCR
tests had been fully offered at the point of entry to re-weight the part of the likelihood function contributed
from asymptomatic cases. In order to consider the effects of the infected source of the country and the period
for each inbound passenger, we applied the exponential regression models with the following regression equa-
tions λi = λi0 × exp(βX); where λi and λi0 represent the three parameters of transition rates and the corresponding
baseline rates; X and β represent country/region and period and their corresponding regression coefficients. The
program was written by using the MCMC procedure of SAS version 9.4.
The algorithm for computer simulation experiments. In order to provide the precision border con-
trol strategies by integrating RT-PCR tests together with an optimal quarantine period for containing the trans-
mission of SARS-CoV-2 resulting from imported cases, a three-arm computer simulation experiments for the
eligible population of incoming passengers with different statuses of COVID-19 (uninfected, asymptomatic,
pre-symptomatic, and symptomatic phase) was designed. The details are delineated in Supplementary Fig. S1
with various scenarios.
Scientific Reports | (2022) 12:6053 | https://doi.org/10.1038/s41598-022-09863-w 8
Vol:.(1234567890)www.nature.com/scientificreports/
Three border control strategies.
(1) RT-PCR test on arrival and quarantine for five days for subjects with negative initial results followed by a
second RT-PCR test at the end of quarantine (Arm1: Two RT-PCRs + 5-d Q, Supplementary Fig. S1),
(2) RT-PCR test on arrival and quarantine for five days (Arm2: One RT-PCR + 5d Q, Supplementary Fig. S1),
and
(3) quarantine for 14 days without test (Arm3: 14-d Q, Supplementary Fig. S1).
A shortened quarantine period of 5 days was first applied according to the time required from pre-symp-
tomatic to symptomatic phase estimated from the four-state stochastic process in conjunction with empirical
data on imported cases. To explore the possible impact of a longer quarantine, a 7-day period for Arm 1 and
Arm 2 were also assessed. The rationale of comparing these three arms is that while RT-PCR test can detect
subjects with asymptomatic and pre-symptomatic COVID-19, passengers surfacing to symptomatic COVID-19
would also be identified during the quarantine period, which is the main rationale of using only quarantine as
a border control measure. In the meantime, the strategy of quarantine alone would miss passengers who would
not present symptoms and signs.
To take into account the impact of RT-PCR accuracy on these missed COVID-19 cases and the possibility of a
lower sensitivity for the second test, 95% and 80% sensitivity for the first and the second test were a pplied38,39. In
addition, the strategies with the quarantine period of 5, 7, and 14 days were also considered for Arm1 and Arm2.
Periods of COVID‑19 pandemic with vaccinated travelers. Moreover, since our study covers four
periods the computer simulation experiments were applied to the third and the fourth pandemic period but
only limited to the United States of America (USA) and the United Kingdom (UK) as the viral variants in both
regions were remarkably noted after October 2020. Most importantly, the simulated design was also applied
to the vaccinated traveler based on the UK scenario in the third period when the vaccine was not available, in
contrast to the fourth period when half of UK residents were vaccinated, which was used as an illustration for
the preparedness of border control during the period from the launch of vaccination until mass vaccination
worldwide. The efficacy of vaccine applied to travelers from the UK was based on the results of phase 2/3 trial
for chimpanzee adenovirus Oxford 1 (ChAdOx1) nCoV-19 in the U K40. The administration of low dose in the
first dose and a standard dose as the second dose of ChAdOx1 nCoV-19 can reduce symptomatic and asympto-
matic cases by 90% (67.4–97.0%) and 58.9% (1.0–82.9%), respectively, implying the corresponding relative risk
of 0.10 (0.03–0.33) and 0.41 (0.17–0.99). The logarithm transform led to the point and interval estimates of the
two regression coefficients. Assuming both follow normal distribution, we have two corresponding regression
coefficients followed N(mean = − 2.3076, sd = 0.6055) and N(mean = − 0.8882, sd = 0.4490) to the incidence rates
of pre-symptomatic and asymptomatic cases for the vaccinated passenger.
Country‑specific precision strategies. In addition to the presentation of three main strategies, the pre-
cision strategies on the days of quarantine and isolation for each country or region given only quarantine and
isolation, one test, two tests, and also the vaccinated were estimated on the basis of the criterion of no pre-
symptomatic case detected.
Bayesian MCMC algorithm for computer simulation experiments. A total of 15,000 passengers
were randomly assigned into the three arms with 5000 in each arm for any given geographic regions in each
period. For subjects assigned to each of the study arms, the area-specific risk of being infected and the daily
risk of clinical evolution of COVID-19 in terms of asymptomatic, pre-symptomatic, and further progression to
symptomatic COVID-19 were projected by the predictive distribution that was derived from the posterior dis-
tribution encoded with the estimated parameters as detailed above. We also used a Bayesian MCMC algorithm
with 200,000 repetitions and the thinning period of 20 was applied to deriving 5000 rounds of trials based on the
predictive distribution. The inferences on the number of missed COVID-19 cases for each study arm would be
drawn on the basis of these samples. The simulation algorithm was performed by using the MCMC procedure
in SAS version 9.4.
Data availability
eferences9–11.
All datasets used in this study are available from R
Received: 21 July 2021; Accepted: 21 March 2022
References
1. WHO. COVID-19 situation reports. 2020. https://www.who.int/emergencies/diseases/novel-coronavirus-2019/situation-reports
[accessed May 31, 2021]
2. Cauchemez, S. & Kiem, C. T. Managing COVID-19 importation risks in a heterogeneous world. Lancet Public Health 6, e626–e627
(2021).
3. Steyn, N., Lustig, A., Hendy, S. C., Binny, R. N. & Plank, M. J. Effect of vaccination, border testing, and quarantine requirements
on the risk of COVID-19 in New Zealand: A modelling study. Infect. Dis. Model. 7, 184–198 (2022).
4. Ferretti, L. et al. Quantifying SARS-CoV-2 transmission suggests epidemic control with digital contact tracing. Science 368, 6936
(2020).
5. Buitrago-Garcia, D. et al. Occurrence and transmission potential of asymptomatic and presymptomatic SARSCoV-2 infections:
a living systematic review and meta-analysis. PLoS Med. 17, e1003346 (2020).
Scientific Reports | (2022) 12:6053 | https://doi.org/10.1038/s41598-022-09863-w 9
Vol.:(0123456789)www.nature.com/scientificreports/
6. Oyungerel, B. et al. Estimating the extent of asymptomatic COVID-19 and its potential for community transmission: Systematic
review and meta-analysis. JAMMI 5, 223–234 (2020).
7. Gao, W., Lv, J., Pang, Y. & Li, L. M. Role of asymptomatic and pre-symptomatic infections in covid-19 pandemic. Br. Med. J. 375,
2342 (2021).
8. He, J., Guo, Y., Mao, R. & Zhang, J. Proportion of asymptomatic coronavirus disease 2019: A systematic review and meta-analysis.
J. Med. Virol. 93, 820–830 (2021).
9. Chen, C. et al. The epidemiological and radiographical characteristics of asymptomatic infections with the novel coronavirus
(COVID-19): A systematic review and meta-analysis. Int. J. Infect. Dis. 104, 458–464 (2021).
10. Syangtan, G. et al. Asymptomatic SARS-CoV-2 carriers: a systematic review and meta-analysis. Front. Public Health 8, 587374
(2021).
11. Rasmussen, A. L. & Saskia, V. P. SARS-CoV-2 transmission without symptoms. Science 371, 6535 (2021).
12. Ebert, M. A., Gebski, V. & Baldock, C. In the future simulations will replace clinical trials. Phys. Eng. Sci. Med. 44, 997–1001 (2021).
13. Schork, N. J. Randomized clinical trials and personalized medicine: A commentary on deaton and cartwright. Soc. Sci. Med. 210,
71–73 (2018).
14. European Centre for Disease Prevention and Control. Assessment of the further spread and potential impact of the SARS-CoV-2
Omicron variant of concern in the EU/EEA, 19th update - 27 January 2022. ECDC: Stockholm; 2022.
15. Nabel, K. G. et al. Structural basis for continued antibody evasion by the SARS-CoV-2 receptor binding domain. Science 375, l6251
(2022).
16. He, X. et al. Temporal dynamics in viral shedding and transmissibility of COVID-19. Nat. Med. 26, 672–675 (2020).
17. Frediani, J. K. et al. Multidisciplinary assessment of the Abbott BinaxNOW SARS-CoV-2 point-of-care antigen test in the context
of emerging viral variants and self-administration. Sci. Rep. 11, 14604 (2021).
18. Schrom, J. et al. Direct comparison of SARS Co-V-2 nasal RT-PCR and rapid antigen test (BinaxNOW (TM)) at a community
testing site during an Omicron Surge. Preprint at https://www.medrxiv.org/content/https://doi.org/10.1101/2022.01.08.22268
954v4 (2022)
19. U.S. Food & Drug Administration. https://www.fda.gov/medical-devices/coronavirus-covid-19-and-medical-devices/sars-cov-2-
viral-mutations-impact-covid-19-tests.
20. Dickens, B. L. et al. Strategies at points of entry to reduce importation risk of COVID-19 cases and reopen travel. J. Travel Med.
27, 141 (2020).
21. Loeffelholz, M. J. & Tang, Y. W. Laboratory diagnosis of emerging human coronavirus infections—the state of the art. Emerg.
Microbes. Infect. 9, 747–756 (2020).
22. Shahriarirad, R. & Sarkari, B. COVID-19: clinical or laboratory diagnosis? A matter of debate. Trop. Doct. 51, 131–132 (2021).
23. Kaydos-Daniels, S. C. et al. Body temperature monitoring and SARS fever hotline, Taiwan. Emerg. Infect. Dis. 10, 373–376 (2004).
24. Shu, P. Y. et al. Fever screening at airports and imported dengue. Emerg. Infect. Dis. 11, 460–462 (2005).
25. Cheng, H. Y., Li, S. Y. & Yang, C. H. Initial rapid and proactive response for the COVID-19 outbreak—Taiwan’s experience. J.
Formos. Med. Assoc. 119, 771–773 (2020).
26. Chen, C. L. et al. Review of epidemic, containment strategies, clinical management, and economic evaluation of COVID-19
pandemic. J. Formos. Med. Assoc. 120, S6–S18 (2021).
27. Ku, M. S. et al. Continental transmission of emerging COVID-19 on the 38° North latitude. J. Formos. Med. Assoc. 120, S19–S25
(2021).
28. Taiwan Centers for Disease Control. https://www.cdc.gov.tw/En [accessed March 31, 2021].
29. Ministry of Transportation and Communications, Taiwan. https://www.motc.gov.tw/en/index.jsp [accessed March 31, 2021].
30. National Immigration Agency, Ministry of the Interior, Taiwan. https://w ww.i mmigr ation.g ov.t w/5 475/ [accessed March 31, 2021].
31. Chen, T. H. H. et al. Estimation of sojourn time in chronic disease screening without data on interval cases. Biometrics 56, 167–172
(2000).
32. Duffy, S. W., Chen, H. H., Tabar, L. & Day, N. E. Estimation of mean sojourn time in breast cancer screening using a Markov chain
model of both entry and exit from the preclinical detectable phase. Stat. Med. 14, 1531–1543 (1995).
33. Kalbfleisch, J. D. & Lawless, J. F. The analysis of panel data under a Markov assumption. J. Am. Stat. Assoc. 80, 863–871 (1985).
34. Sethuraman, N., Jeremiah, S. S. & Ryo, A. Interpreting diagnostic tests for SARS-CoV-2. J. Am. Med. Associ. 323, 2249–2251 (2020).
35. Wu, G. H. M. et al. A stochastic model for survival of early prostate cancer with adjustments for leadtime, length bias, and over-
detection. Biom. J. 54, 20–44 (2012).
36. Wu, J. C. et al. Estimation of natural history parameters of breast cancer based on non-randomized organized screening data:
Subsidiary analysis of effects of inter-screening interval, sensitivity, and attendance rate on reduction of advanced cancer. Breast
Cancer Res. Treat. 122, 553–566 (2010).
37. Yen, A. M. F. & Chen, H. H. Modeling the overdetection of screen-identified cancers in population-based cancer screening with
the Coxian phase-type Markov process. Stat. Med. 39, 660–673 (2020).
38. Smith, R. L. et al. Longitudinal assessment of diagnostic test performance over the course of acute SARS-CoV-2 infection. J. Infect.
Dis. 224, 976–982 (2021).
39. Kucirka, L. M., Lauer, S. A., Laeyendecker, O., Boon, D. & Lessler, J. Variation in false-negative rate of reverse transcriptase poly-
merase chain reaction–based SARS-CoV-2 tests by time since exposure. Ann. Intern. Med. 173, 262–267 (2020).
40. Voysey, M. et al. Safety and efficacy of the ChAdOx1 nCoV-19 vaccine (AZD1222) against SARS-CoV-2: an interim analysis of
four randomised controlled trials in Brazil, South Africa, and the UK. Lancet 397, 99–111 (2021).
Author contributions
G.H.J., A.M.Y., and T.H.C. conceptualized and design the study. G.H.J. was responsible for data analysis and the
drafting of the manuscript. A.M.Y. and C.Y.H. was responsible for statistical analysis. A.M.Y. and S.L.C. were
in charge of the data collection and management. H.S., S.L.C., and T.H.C. interpreted results and revised the
manuscript. All authors agreed the findings and provided input on the revision of the manuscript. All authors
agreed the findings and provided input on the revision of the manuscript.
Funding
This work was funded by Ministry of Science and Technology, Taiwan (MOST 108-2118-M-002-002-MY3;
MOST 108-2118-M-038-001-MY3; MOST 108-2118-M-038-002-MY3; MOST 109-2327-B-002-009; MOST
110-2811-M-038-003).
Competing interests
The authors declare no competing interests.
Scientific Reports | (2022) 12:6053 | https://doi.org/10.1038/s41598-022-09863-w 10
Vol:.(1234567890)www.nature.com/scientificreports/
Additional information
Supplementary Information The online version contains supplementary material available at https://doi.org/
10.1038/s41598-022-09863-w.
Correspondence and requests for materials should be addressed to T.H.-H.C.
Reprints and permissions information is available at www.nature.com/reprints.
Publisher’s note Springer Nature remains neutral with regard to jurisdictional claims in published maps and
institutional affiliations.
Open Access This article is licensed under a Creative Commons Attribution 4.0 International
License, which permits use, sharing, adaptation, distribution and reproduction in any medium or
format, as long as you give appropriate credit to the original author(s) and the source, provide a link to the
Creative Commons licence, and indicate if changes were made. The images or other third party material in this
article are included in the article’s Creative Commons licence, unless indicated otherwise in a credit line to the
material. If material is not included in the article’s Creative Commons licence and your intended use is not
permitted by statutory regulation or exceeds the permitted use, you will need to obtain permission directly from
the copyright holder. To view a copy of this licence, visit http://creativecommons.org/licenses/by/4.0/.
© The Author(s) 2022
Scientific Reports | (2022) 12:6053 | https://doi.org/10.1038/s41598-022-09863-w 11
Vol.:(0123456789)You can also read