A wearable patch for continuous analysis of thermoregulatory sweat at rest
←
→
Page content transcription
If your browser does not render page correctly, please read the page content below
ARTICLE
                  https://doi.org/10.1038/s41467-021-22109-z                 OPEN

                  A wearable patch for continuous analysis
                  of thermoregulatory sweat at rest
                  Hnin Yin Yin Nyein1,2,3,4, Mallika Bariya1,2,3,4, Brandon Tran 1,3, Christine Heera Ahn1,
                  Brenden Janatpour Brown1, Wenbo Ji1,2,3, Noelle Davis1 & Ali Javey 1,2,3 ✉
1234567890():,;

                  The body naturally and continuously secretes sweat for thermoregulation during sedentary
                  and routine activities at rates that can reflect underlying health conditions, including nerve
                  damage, autonomic and metabolic disorders, and chronic stress. However, low secretion
                  rates and evaporation pose challenges for collecting resting thermoregulatory sweat for non-
                  invasive analysis of body physiology. Here we present wearable patches for continuous sweat
                  monitoring at rest, using microfluidics to combat evaporation and enable selective monitoring
                  of secretion rate. We integrate hydrophilic fillers for rapid sweat uptake into the sensing
                  channel, reducing required sweat accumulation time towards real-time measurement. Along
                  with sweat rate sensors, we integrate electrochemical sensors for pH, Cl−, and levodopa
                  monitoring. We demonstrate patch functionality for dynamic sweat analysis related to
                  routine activities, stress events, hypoglycemia-induced sweating, and Parkinson’s disease.
                  By enabling sweat analysis compatible with sedentary, routine, and daily activities, these
                  patches enable continuous, autonomous monitoring of body physiology at rest.

                  1 Department of Electrical Engineering and Computer Sciences, University of California, Berkeley, CA, USA. 2 Berkeley Sensor and Actuator Center, University

                  of California, Berkeley, CA, USA. 3 Materials Sciences Division, Lawrence Berkeley National Laboratory, Berkeley, CA, USA. 4These authors contributed
                  equally: Hnin Yin Yin Nyein, Mallika Bariya. ✉email: ajavey@berkeley.edu

                  NATURE COMMUNICATIONS | (2021)12:1823 | https://doi.org/10.1038/s41467-021-22109-z | www.nature.com/naturecommunications                                  1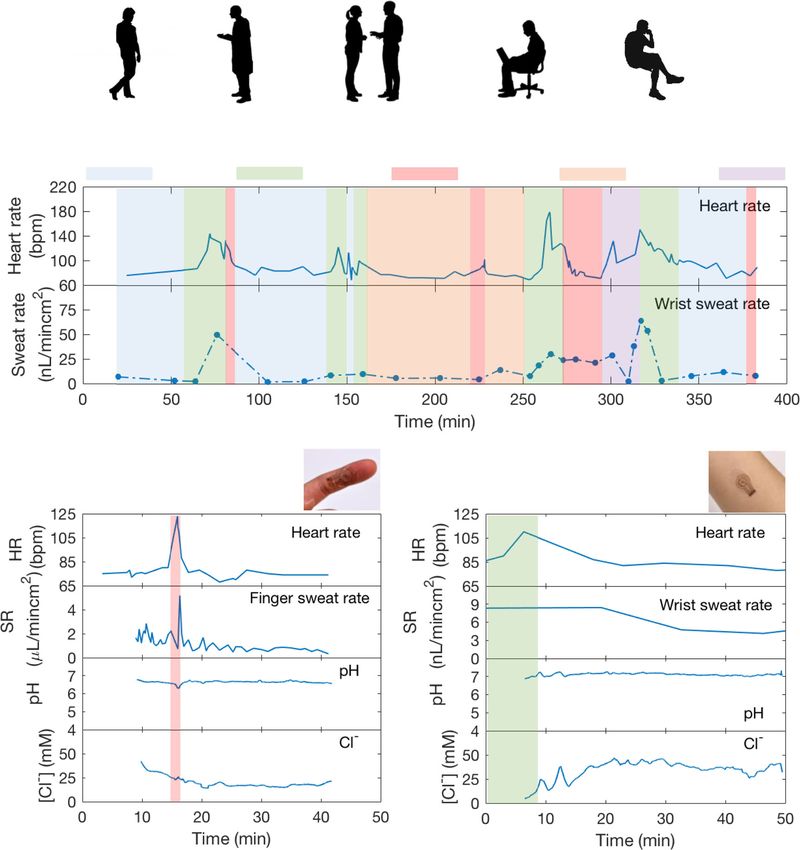
ARTICLE                                                                 NATURE COMMUNICATIONS | https://doi.org/10.1038/s41467-021-22109-z

S
       weating is commonly associated with exercise and high                 gland secretory pressure is sufficient to push resting sweat into
       ambient temperature, but the body naturally sweats more               the device, while also ensuring fast movement of entrapped sweat
       broadly and continuously to regulate core temperature                 within the channel and over embedded sweat rate sensing elec-
during endogenous metabolic or stress processes, even during                 trodes. These electrodes have interdigitated spokes—as the
sedentary activities like sitting or sleeping. At-rest thermo-               advancing sweat front meets a new spoke, a jump in admittance is
regulatory sweat is secreted at much lower rates than during                 detected that allows for selective flow measurement without
exercise—as low as a few nL min−1 cm−2 compared to higher                    interference from varying ionic concentration. In addition, the
exercise rates of 100’s of nL min−1 cm−2—making it challenging               patch has a small footprint that allows versatile body placement
to collect and analyze1. However, near- or at-rest sweat may                 even at small-area regions like the fingertips. Along with the
provide unique insight into body physiology compared to exer-                electrical sensor for sweat rate monitoring, we integrate electro-
cise, thermal, or chemically induced sweat. Specifically, the rate            chemical sensors for pH, Cl−, and levodopa detection inside the
of resting sweat secretion can reflect sympathetic nervous system             microchannel for continuous analysis of resting sweat rate and
activity stemming from underlying health conditions. For                     compositions. These analytes are chosen to demonstrate the
example, resting sweating rate is related to defects in the central          patch’s capabilities for ion and enzymatic sensing, and further
nervous system of infants2,3, to the severity of paresis in patients         because of the potential significance of these markers for indi-
with brain infarction4,5, and to physiological habituation of                cating physiological state. Sweat pH could potentially reflect
soldiers6. Elevated or inhibited sweating at rest can further                acid–base disorders, chloride levels are relevant to testing for
indicate autonomic dysfunctions, diabetes, cerebrovascular dis-              cystic fibrosis and potentially for hydration status and electrolyte
eases, and Parkinson’s disease, as well as chronic psychological             stores, and levodopa testing through sweat could be used toward
stress, anxiety, or pain7–9. Resting sweat is uniquely poised to             precision medicine for Parkinson’s patients14,27,28. Multiplexed
give insight into these conditions by ensuring that endogenous               sensing of all three analytes is further valuable as enzymatic
sweating rates associated with stress, injury, or illness are not            sensors, including the levodopa sensor, can be impacted by
overwhelmed or confounded by the vastly higher rates associated              sample pH and ionic strength, so simultaneous tracking of these
with exercise or other external sweat triggers. In addition,                 influencing parameters can be important for converting sensor
low secretion rates may better preserve diffusive equilibria of              signals into meaningful concentration readings. By uniting these
biomarkers between sweat and blood, potentially making resting               electrochemical sensors, the presented device creates opportu-
sweat composition more reflective of blood chemistry than other               nities to study how the body’s endogenous sweating response
types of sweat. Finally, resting sweat is continuously generated,            relates to stress, metabolic conditions, and potentially neurolo-
unlike the discrete or short-term generation of exercise or che-             gical afflictions amongst other applications. We utilize the device
mically induced sweat, creating opportunities for long-term                  to measure resting sweat secretion rates on various locations
monitoring of evolving body state even for impacted populations              including shoulder, chest, bicep, wrist, abdomen, thigh, and leg,
including patients or the elderly. Continuous measurement of at-             and finger. We explore dynamic sweat behaviors during
rest thermoregulatory sweat rate and composition with wearable               light physical activities, glucose fluctuations, and control drug
sensors can therefore be a powerful route for noninvasive health             administration for Parkinson’s disease management. We further
monitoring.                                                                  conduct longitudinal sweat rate monitoring over 24-h periods to
   Accessing resting sweat remains an outstanding challenge, as              detect the onset of and recovery from stress events. Our device
low secretion rates and rapid evaporation limit the amount of                proves to be an ideal platform to continuously or routinely
biofluid volume available to be collected in a sensor for analysis.           monitor users’ medical conditions and physiological status during
For this reason, most wearable sweat sensors have focused on                 daily routines. It can also advance sweat investigations beyond
exercise, thermal, or chemically stimulated sweat produced at                what current wearable sweat sensors can provide by promoting a
rates of 10’s or 100’s of nL min−1 cm−2 or higher10–23. They are             fundamental understanding of at-rest sweat secretion and its
unable to draw low volumes of resting sweat rapidly into                     relation to diverse health conditions.
the device, limiting real-time assessment. A few platforms have
targeted low nL min−1 cm−2 rates, but have failed to enable
continuous analysis and, critically, accurate measurement of                 Results and discussion
resting sweat rate24,25. Even historically, at-rest thermoregulatory         Device structure. Our microfluidic device shown in Fig. 1 is
sweat rate monitoring in clinical environments has required bulky            designed to enable effective small volume collection and analysis
instrumentation such as ventilated humidity measurement                      of resting sweat. The device, includes three major components: a
chambers, or 24-h collection periods for single-point analyte                microfluidic layer, electrochemical and electrical sweat sensing
measurement26. Convenient, wearable devices for continuous                   electrodes, and a laminated hydrophilic filler. As displayed in
resting sweat monitoring remain a gap in the field. This is a key             Fig. 1a, the polydimethylsiloxane (PDMS)-based microfluidic
outstanding challenge that must be overcome to make sweat a                  layer contains a collection well and a microfluidic channel. The
viable mode of health monitoring across activities, whether active           collection well interfaces the skin and its area can be modulated to
or sedentary, and across user groups, whether young or old,                  acquire varying amounts of sweat. The microfluidic channel
healthy or ill.                                                              contains two intertwined spirals, and the channel connects the
   In this work, we present a wearable patch for continuous                  collection well and the outlet. The microfluidic layer is aligned
measurement of at-rest thermoregulatory sweat composition and                and bonded together with the sweat sensing electrodes. The
rate, overcoming evaporation by entrapment of sweat within a                 sensing electrodes contain four outer semicircles surrounding two
microfluidic sensing channel. Rapid uptake at low secretion rates             interdigitated wheel-shaped electrodes. The electrochemical sen-
is achieved via incorporation of a hydrophilic filler in the sweat            sors such as pH, Cl−, and levodopa are functionalized on the
collection well to reduce the volume of sweat that must be                   semicircles, and the central interdigitated wheel acts as an
accumulated before it is pushed into the channel for measure-                impedance-based sweat rate sensor. Finally, the collection well is
ment. Combining a rigid, hydrophilic insert with an overlaying               filled with a patterned SU8 filler coated with a thin saturated
hydrogel prevents sweat leakage for rapid uptake while also                  hydrogel layer that contacts skin for sweat uptake (Fig. 1b). The
ensuring mechanical integrity. In addition, channel dimensions               patch can be worn on areas such as the finger and wrist without
are tailored to minimize hydraulic pressure losses so that sweat             interrupting human activities as pictured in Fig. 1c, d.

2                NATURE COMMUNICATIONS | (2021)12:1823 | https://doi.org/10.1038/s41467-021-22109-z | www.nature.com/naturecommunications
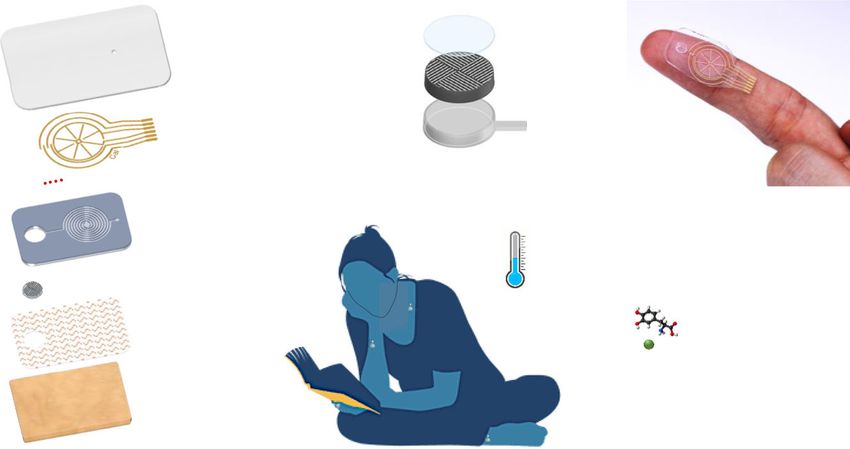
NATURE COMMUNICATIONS | https://doi.org/10.1038/s41467-021-22109-z                                                                        ARTICLE

Fig. 1 A schematic of the design, structure, and usage of the microfluidic sweat analysis patch. a The patch contains multiple layers. It interfaces the skin
via a skin adhesive, and sweat is collected by assistance of hydrophilic filler into the microfluidics and eventually measured using sensing electrodes
fabricated on a thin PET. b The hydrophilic filler includes a patterned SU8 mold covered with PVA film and AG-GLY hydrogel and is embedded inside the
collection well. The filler enhances sweat collection by lowering sweat secretion pressure and taking up volume of the well otherwise will need to be filled.
c An optical image of the sweat patch on a user’s finger is displayed. d The patch can be worn on various locations and is used to monitor sweat dynamics
without interrupting routine activities. e It can continuously monitor both sweat secretion rate and compositions for long-term without external sweat
stimulation, as schematically shown using model trends.

Device design. Humans’ sweat secretion rates at rest vary across                 low sweat volumes, but for efficiently drawing it over inter-
different body locations on average. For instance, sweat secretion               digitated electrode spokes for selective, continuous sweat rate
rates can be lower than 10 nL min−1 cm−2 at low secretion sites                  measurement within a consolidated sensor footprint.
such as arm and leg, and can reach on the order of 100 nL min−1                     It is ideally beneficial for microfluidic collection area to be large
cm−2 at high secretion areas like the palm and foot29,30. Such                   to maximize the accessible sweat glands. However, a large
secretion rates are small compared to typical sweat rates obtained               collection area creates a dead volume, in which sweat firstly needs
by active sweat stimulation, which can be higher by an order29,31.               to be filled before flowing into the microchannel. This creates a
To enable low resting sweat rate measurement inside the micro-                   lag time in sensor’s response. To address this problem, we
channel, the channel cross-section needs to be as small as possible              incorporated a hydrophilic filler, containing a patterned SU8
such that temporal variations in secretion rate can be resolved                  mold and hydrogels, to occupy the dead volume and to draw
by allowing fast speeds of the moving sweat front. At the same                   sweat readily into the channel as soon as it secretes. Hydrogels
time, the channel resistance cannot be so high as to limit flow in                have been used extensively in the wearable electronics community
the channel and potentially suffocate sweat gland secretion, so the              to create soft interfaces and to absorb and hold biofluids onto
channel cross section cannot be too narrow. Finally, the channel                 sensor surfaces, but deploying gels to enhance sweat replacement
length needs to be long enough for the device to have sufficient                  times and minimize accumulation volumes and lag times
volumetric holding capacity to enable long-term measurement on                   represents a key advantage in this work32–34. This structure
desired body locations. Here, we aim to develop a microfluidic                    overall comprises of a PVA-coated rigid SU8 component that is
device that can contain ~750 nL or greater such that sweat analysis              first inserted into the well and overlayed with an agarose–glycerol
can be done longer than an hour at the lowest sweat rate regions.                hydrogel that directly contacts skin for sweat uptake (Supple-
Toward this goal, we estimated secretory pressures of the sweat                  mentary Fig. 2). Optical images of the filler and the assembled
gland spanning a broad range of resting sweat secretion rates from               microfluidic are shown in Supplementary Fig. 3. We did not use
3 to 1 µL min−1 cm−2. We established that the channel con-                       hydrogel alone as a filler because it can dilute sweat compositions
tributes to most of the device hydraulic resistance compared to the              and hence put a challenge on the detection limit and sensitivity of
collection well. For various square cross-sectional areas and                    electrochemical sensors, so we instead use only a thin hydrogel
associated channel lengths that give close to 750 nL holding                     layer and occupy the remaining dead space with the rigid filler.
capacity, we calculated hydraulic pressure losses and compared                   The ameliorating effects of this combination on mixing and
these to the secretory pressure of the grand. From this, we                      analyte dispersion are detailed in the Supplementary Information
established that a channel cross section of 70 µm × 70 µm with                   on Page 7. The filler further contributes to mechanical integrity,
~15 cm length has low enough resistance to support sweat flow                     inhibiting collapse of the collection well under pressures which
across low to high secretory rates. Detailed calculations of this                could otherwise artificially force fluid into the channel and create
procedure are reported on Page 4 of the Supplementary Infor-                     artefacts in measured sweat rate. The SU8 filler is patterned with
mation. Based on these results, we chose two cross-sectional areas               grooves to alternate closed-off regions that diminish well volume
of the spiraling microfluidic portion for sweat rate measurement,                 with open regions roughly 100 µm-wide that allow sweat to pass
70 μm × 70 μm (design 1) and 200 μm × 70 μm (design 2) as                        through and into the device. The hydrophilic film contains
depicted in Supplementary Fig. 1, with lengths shorter than 15 cm                two layers: a polyvinyl alcohol (PVA) and an agarose–glycerol
to monitor sweat rates in low and high secretion regions,                        (AG-GLY) film. The thin PVA film covers the entire SU8 filler. A
respectively. Note that channels on the order of 10’s of microns                 single PVA layer is brittle and can easily expose the hydrophobic
wide have been previously demonstrated for wicking nanoliters of                 pathway along the cracks. This will introduce pressure against
sweat off the skin surface and onto the sensor25. In contrast, the               sweat secretion due to surface tension and can prevent effective
spiraling channel design used here is crucial not only for capturing             transport of sweat from the skin surface into the channel.

NATURE COMMUNICATIONS | (2021)12:1823 | https://doi.org/10.1038/s41467-021-22109-z | www.nature.com/naturecommunications                                  3
ARTICLE                                                                 NATURE COMMUNICATIONS | https://doi.org/10.1038/s41467-021-22109-z

By addition of the deformable AG-GLY gel35 with high                         conditions7,8,37–40. Tracking sweat secretion routinely may help
hydrophilicity, sweat from the collection area can be drawn into             discover valuable insights into human physiology (Fig. 1e).
the gel and transported to the microchannel more effectively.                Toward this goal, we first tested the feasibility of our microfluidic
Therefore, the AG-GLY film covers the top surface of the filler                collector. We performed on-body sweat collection on various
and is directly in contact with the skin. Without the hydrophilic            body sites, including shoulder, chest, bicep, wrist, abdomen, fin-
filler, volumetric calculations show that a collection well with a 5          ger, thigh, and leg as displayed in Fig. 2a. The patches were worn
mm diameter and a 400 μm thickness will require more than 2 h                by a volunteer individual (subject 1) for 24 h, and optical images
to fill the well if sweat secretes at 300 nL min−1 cm−2 while taking          were taken periodically. Patches with different collection areas
over 30 min and 200 h for extreme rates of 1 µL min−1 cm−2 and               were used to capture sweat rate in a practical time frame; speci-
3 nL min−1 cm−2, respectively. The integration of the hydrophilic            fically, smaller collection area was used in high secreting regions
filler enhances the collection and transports fluid into the channel           like the fingers while larger areas were used in lower secreting
within a few minutes. For a 5 mm diameter collection area, the               regions like the chest as described in the Supplementary Infor-
film can hold a liquid volume of nearly 200 nL in the well. For               mation Table 1. The subject was asked to refrain from moderate
300 nL min−1 cm−2, it takes approximately 3 min to fill the                   to vigorous physical activities during the 24-h time frame. An
well and initiate the sweat analysis. Similarly, it takes under a            example of the collection area and the imaging area of the patches
minute for a rate of 1 µL min−1 cm−2 near the upper range of                 are displayed in Fig. 2b. Depending on the targeted regions, the
resting sweat secretion or around 30 min for rates toward the                patches differed in collection area and microfluidic dimensions.
3 nL min−1 cm−2 lower end when appropriately sized collection                Color dye was used in the hydrogel to ensure sweat flow in the
wells are used. The experimental result using a syringe pump                 channel could be clearly observed. The first images in each
supports this conclusion as shown in Supplementary Fig. Sa. For              location were taken as soon as sweat secretion began in the image
typical resting sweat rates ~
NATURE COMMUNICATIONS | https://doi.org/10.1038/s41467-021-22109-z                                                                         ARTICLE

Fig. 2 Collection of at-rest thermoregulatory sweat on various parts of the body. a Sweat patches were placed on 8 different locations including shoulder,
chest, bicep, wrist, abdomen, finger, thigh, and calf. b The sweat patch used for collection and imaging is displayed. c The bar graph shows a subject’s local
average sweat rates of regions indicated in (a) based on optical tracking of sweat in the microchannel from images like those in (d). d Optical images of
microfluidic sweat collection at different locations and times are displayed. Note that collection areas and microfluidic dimensions are different for each
location. Two different dimensions discussed in the Results section were utilized, and a collection well with diameter varied from 3 to 10 mm were used.
Measured rates were normalized by the collection area.

measurements or as an independent visual measurement scheme                      order of 100%. This can lead to a lower sweat rate measured by
enabled by this patch. This scheme for optical sweat rate tracking               the gravimetric method. This shows a key advantage of our device
is realized via discrete photographs of sweat progression within                 as it minimizes the uncertainty arisen from the evaporation.
the channel as in Fig. 2.                                                        When dealing with low volumes and rates associated with at-rest
   As for the second factor that could impact sweat rate accuracy,               sweat, our device encapsulates sweat immediately and uses a
namely compensatory sweating effects, all devices covering sweat                 narrow channel to create rapid movement of the sweat front,
glands can induce the same effect, and this requires careful                     translating into frequent and updated sweat rate measurements
studies in the future. Local heat generation due to on-body                      that overcome the evaporation and errors of gravimetric analysis.
attachment of the patch must also be considered as it could                      With these considerations, it is reasonable to assume that sweat
potentially elevate sweating rates18, but negligible local heating is            under the collection area faithfully contributes to the measured
observed as demonstrated in Supplementary Fig. 19 due to the                     sweat rate from the patch.
small patch size and at or near rest conditions. We compared the
measured sweat rates from the patches with more traditional
gravimetric analysis. For the latter, an absorbent pad is held                   Sensors characterization. In order to utilize the microfluidic
against skin for sweat accumulation and weighed before and after                 patch for electrical measurement, electrical sensing electrodes are
each sweat collection that lasts approximately 20–30 min. The                    incorporated into the microfluidic. As shown in Fig. 3a, two
pad is placed in a shallow 0.5 cm2 chamber to minimize                           interdigitated wheel shape electrodes are aligned with the
evaporation during sweat collection. A new patch was used in                     microfluidic and act as a sweat rate sensor. The electrodes contain
each sweat collection. The patch and the pad were placed on ring                 a total of 8–24 radial electrodes. At the initial contact, a sudden
and pinky fingers to simultaneously collect sweat. Results are                    change in admittance indicates fluid entering the channel. As
displayed in Supplementary Fig. 8, which shows that the patch                    fluid is transported through the channel, it contacts an increasing
collects ~2 times larger sweat amount per unit area than the                     area of the radial electrodes. With each contact by fluid, the
pad. It is important to note that evaporation of the absorbent                   impedance decreases because of a decrease in the resistance
pad during removal from the skin surface and weighing can                        between the two electrodes, and a pulse indicating a change in
have significant effect on the measured amount of sweat. We                       admittance (inversely proportional to impedance) is observed. By
discovered that the evaporation rate from the pad can be                         counting the number of pulses and time interval between each
200–400 nL min−1 cm−2, which is the same order of measured                       pulse, the volume contained in the channel and sweat rate can be
sweat rates. Hence, gravimetric measurement error can be on the                  computed. In other words, as the spacing between the spokes is

NATURE COMMUNICATIONS | (2021)12:1823 | https://doi.org/10.1038/s41467-021-22109-z | www.nature.com/naturecommunications                                   5
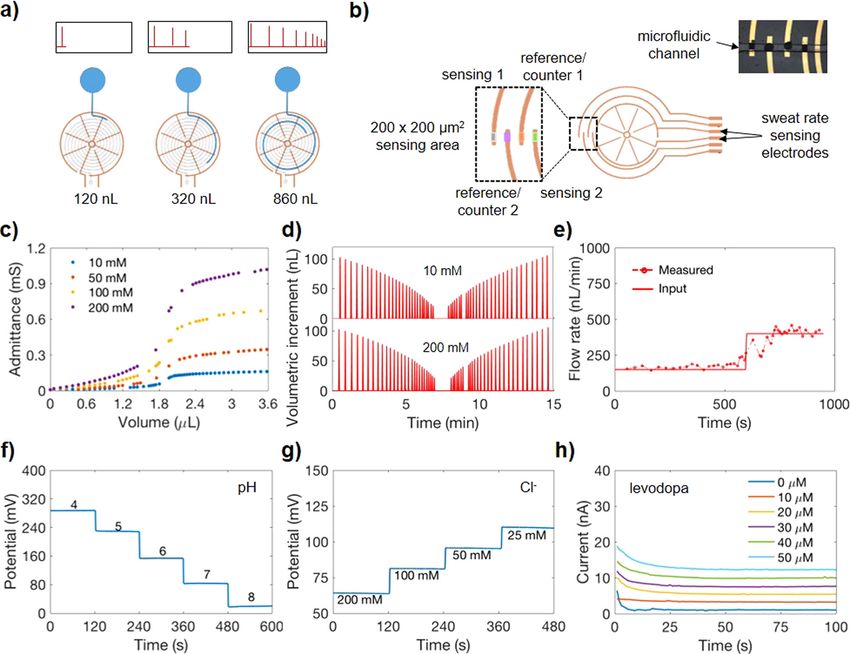
ARTICLE                                                                   NATURE COMMUNICATIONS | https://doi.org/10.1038/s41467-021-22109-z

Fig. 3 Sweat sensor characterization. a An impedimetric sweat rate sensing electrodes for detection of secretion rate is illustrated. An admittance
(reciprocal of impedance) pulse is measured upon fluid contacting each of the radial electrode. b Electrochemical sensors for compositional analysis are
functionalized near the tip of the four semicircles. These sensors are embedded inside the microchannel. c Admittance responses to solution containing
NaCl concentrations of 10, 50, 100, and 200 mM. d Incremental volume filled inside the microchannel with respect to time is plotted when 10 and 200 mM
NaCl solutions are flowed at a constant rate of 250 nL/min. The incremental volume corresponds to additional fluid filled between two adjacent radial
electrodes. e Input flow rate from syringe pump and measured flow rate from sweat rate sensor are compared. Performance of (f) pH, (g) Cl−, and
(h) levodopa sensors are presented.

known and the channel cross-section is fixed, each time the                     was chosen to minimize the capacitance contribution of the
sensor signal undergoes a discrete step change we can know how                 impedance and to maximize the resistive part of the impedance
much additional volume of fluid was added to the channel. This                  measurement. Figure 3c demonstrates the relationship between
allows an estimate of volumetric increment versus time, where                  admittance and fluid volume in the channel for NaCl concentra-
the time points correspond to the time of the admittance step                  tions of 10, 50, 100, and 200 mM. It can be seen that at higher
changes, as shown schematically by the signals in Fig. 3a. Note                NaCl concentrations, the admittance between the electrodes
that the spacing between spokes decreases as the channel                       increases due to the higher conductivity of increasing ion
spirals inwards and increases once it starts spiraling outwards.               concentrations. In addition, increasing fluid volume in the
This causes the volume increment to decrease as the fluid front                 channel gives rise to higher admittance as more ionic solution
moves toward the center of the spiral, and to increase as it                   is in contact with a larger area of the electrodes, decreasing the
continues to move outwards.                                                    resistance between the electrodes. To demonstrate the reliability
   A larger number of radial electrodes allows for higher temporal             and reproducibility of the sweat rate sensors, it is also necessary to
resolution of sweat rate measurements. Electrochemical sensors                 show that the time interval between admittance pulses are the
located at the end of the semicircular electrodes are aligned with             same for a given flow rate in the channel and for fluid volume
the microchannel as shown in Fig. 3b. This allows electrochemical              between the two contacts regardless of ions concentration. Using
analysis as soon as sweat secretes into the channel. Depending on              a commercial syringe pump, 10 and 200 mM NaCl solutions were
the sensing mechanism, either electrical current or potential is               flowed at a constant rate of 250 nL min−1 into the sweat rate
monitored.                                                                     sensor. The volumetric increments between consecutive contacts
   The sweat rate sensor (200 μm × 70 μm) was first characterized               is plotted as a function of time in Fig. 3d. In comparing the 10
by measuring admittance in different concentrations of NaCl                    and 200 mM plots, it can be seen that the pulses occur at the same
solutions at an operating frequency of 100 kHz. This frequency                 time, indicating a reproducible calculation of sweat rate. It is also

6                  NATURE COMMUNICATIONS | (2021)12:1823 | https://doi.org/10.1038/s41467-021-22109-z | www.nature.com/naturecommunications
NATURE COMMUNICATIONS | https://doi.org/10.1038/s41467-021-22109-z                                                                     ARTICLE

important to note that the time interval spacing between each                    remains relatively stable for variation of ionic strength. Selectivity
pulse is not the same for a constant flow rate in the channel                     of this modified levodopa sensor is shown in Supplementary
because the fluid volume between consecutive contacts decreases                   Fig. 13.
as fluid travels toward the center and increases as fluid travels                     To further investigate the flow effect on the sensors’
outwards from the center toward the outlet. For a 24-electrodes                  performances upon integration into the microfluidic channel,
with 200 μm × 70 μm channel, the time resolution is between ~4                   we performed flow dependence test as shown in Supplementary
and 20 s for 50 nL min−1 and can reach 2–9 min for 2 nL min−1.                   Fig. 14. The levodopa sensor signal shows influence from flow
For a 24-electrodes with 70 μm × 70 μm channel design, the                       rate that can be understood as follows: at lower rates, levodopa
resolution is further enhanced. Lastly, to verify that our sweat rate            concentration is mass transfer limited and changes in flow rate
device accurately returns the correct flow rate, the measured flow                 more significantly impact the levodopa availability at the sensor
rate calculated from our sweat rate sensor was compared against                  surface. Above these rates (toward 100 nL/min and beyond), mass
the known input pump rate of a commercial syringe pump                           transfer of levodopa to the sensor surface is abundant and the
system. The syringe pump was used to flow 200 mM NaCl inside                      sensor remains at a stable, higher signal level than at lower rates.
the microfluidic channel at an input rate of 150 and 400 nL min−1                 The levodopa sensor (Supplementary Figs. 8a and 15) shows an
as shown in Fig. 3e. It can be seen that the input pump rate is in               increase of approximately 0.02 nA for a change in flow rate of
agreement with the measured flow rate from the device, which is                   10 nL min−1. This dependence was considered when we com-
also evident in Supplementary Fig. 4b for lower flow rates. Note                  puted the concentration of levodopa during on-body trials. It is
that an injection pump is used to conduct this benchtop analysis,                important to note that, for on-body levodopa sensing, the sweat
and variation in how smoothly and consistently the pump injects                  rate variations were generally
ARTICLE                                                                   NATURE COMMUNICATIONS | https://doi.org/10.1038/s41467-021-22109-z

Fig. 4 In-situ sweat analysis of a healthy volunteer while performing daily tasks. a The study was conducted to explore dynamic heart rate and sweat
behaviors of a sedentary subject during routine activities such as talking, walking, eating, etc. b A subject wore the microfluidic patch and a heart rate
monitor on the wrist, and heart rate and sweat rate were continuously monitored for 6 h. A subject wore the microfluidic patch on (c) finger and (d) wrist,
and heart rate, sweat rate, sweat pH and Cl− were simultaneously measured. Sweat measurement began 10 min and 4 h after sweat secretion began on
finger and wrist, respectively.

finger and wrist sweat analyses 10 min and 4 h after sweat                      faster sweat secretion rate. Resolution of wrist sweat rate can be
secreted into the sensing channel. The time scales were chosen                 enhanced by increasing number of radial electrodes in sweat rate
based on the subjects’ average sweat rate shown in Supplementary               sensors as discussed previously. Under our experimental condi-
Table 2 and to achieve a stable sensing signal. For instance, for an           tions, we consistently observed perspiration in short time inter-
average sweat rate of 300 nL min−1 cm−2, it takes ~3 min for                   vals (in second for the finger and in minutes for the wrist)
sweat to flow into the sensing channel. To ensure we can capture                throughout the day. Due to its ability to closely track different
a stable signal we waited until 10 min to initiate the measurement.            activities, it can be beneficial for sweat investigations associating
Figure 4c, d shows finger and wrist sweat analyses as well as heart             with physical and mental stress-induced sweat.
rate measurement on a healthy subject. Similar to the previous
study, sweat rate, in general, follows changes in heart rate by                Sweat analysis to detect stress events over 24 h. The patch was
elevating due to periods of activity and then restoring to lower               next worn on the fingertip of a healthy volunteer during two
levels. Sweat pH remained stable at 6.8 and 7.1 on the finger and               trials, 24 h each, with routine activity including eating, walking,
wrist throughout the measurement period. Sweat Cl− showed                      and sleeping, while heart rate and ambient temperature were
slight variation initially and stabilized around 22 and 40 mM on               monitored simultaneously. The subject was mostly sedentary and
finger and wrist, respectively. This observation is supported by                performed intervals of public speaking including giving a pre-
the literature41. Finger sweat rate showed higher resolution due to            sentation and answering questions in a live streamed conference

8                  NATURE COMMUNICATIONS | (2021)12:1823 | https://doi.org/10.1038/s41467-021-22109-z | www.nature.com/naturecommunications
NATURE COMMUNICATIONS | https://doi.org/10.1038/s41467-021-22109-z ARTICLE
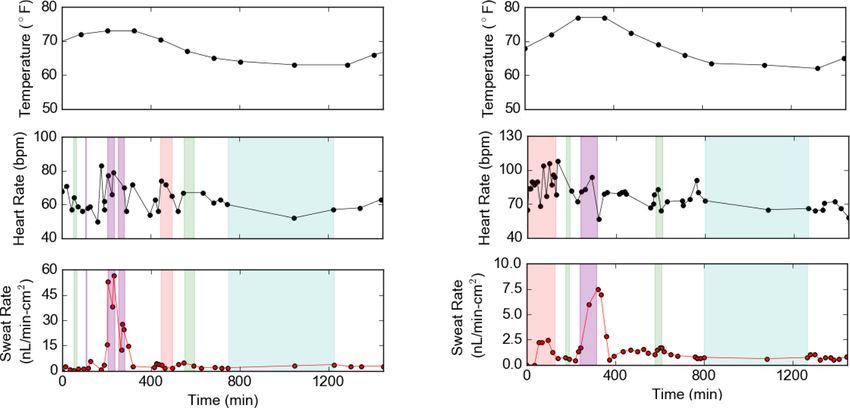
Fig. 5 Twenty-hour in situ sweat analysis to identify stress events among routine activities. Sweat is monitored on the fingertip of a healthy volunteer
along with heart rate and ambient temperature as the mostly sedentary subject performed intervals of public speaking (a) during a live-streamed academic
conference in Trial 1, and (b) while teaching a class in Trial 2. The stress-inducing intervals of public speaking are associated with elevated heart rate and a
sharp increase in sweat rate.
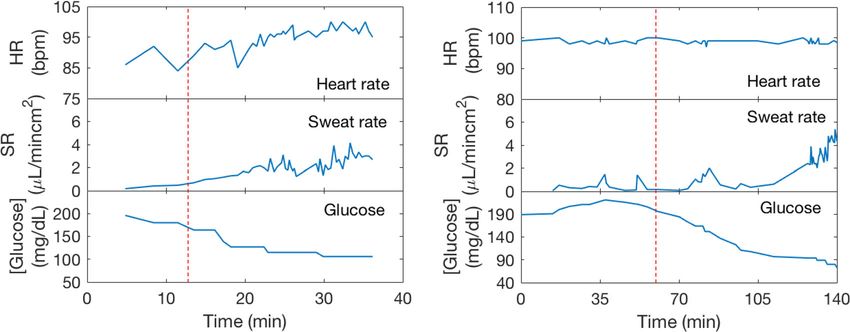
in Trial 1 (Fig. 5a), and teaching a class in Trial 2 (Fig. 5b). These diabetic subject. In both trials, glucose was initially high when the
events generated a stress response in the body due to a combi- measurement began, and the sweat rate remained relatively low
nation of anticipation and public speaking that is reminiscent of between 0.5 and 1 μL min−1 cm−2. After insulin was injected,
the clinical standard Trier Social Stress Test42. Heart rate gen- glucose started to decrease rapidly. In the meantime, an increase
erally elevated in anticipation of and during the stress events in in sweat rate was observed. When glucose further decreased lower
both trials, increasing a total of 28 bpm for the presentation than 90 mg/dL in Fig. 6b, there was a dramatic increase in sweat
in Trial 1 and 21 bpm while teaching in Trial 2. In Trial 1, rate up to 5 μL min−1 cm−2. Heart rate remained relatively
baseline sweat rates during routine activities hovered around unchanged during low glucose level. Based on our results, sig-
2.8 nL min−1 cm−2 but elevated up to nearly 57 nL min−1 cm−2 nificant decrease in glucose level is accompanied by a rise in sweat
during the presentation. Similarly, in Trial 2, baseline sweating rate while no clear heart rate irregularity is observed. To develop
rates were typically under 2.5 nL min−1 cm−2 but elevated to over this qualitative relation further, larger population studies must be
7.5 nL min−1 cm−2 while teaching. These trials demonstrate the conducted in future to quantitatively relate low glucose events
capability of these patches to detect monitor the body’s normal and elevated sweating at rest.
sweating response during routine activities over extended and
full-day time periods, and from this identify when the body
moves into physiologically deviating states such as those pro- Levodopa sensing for Parkinson’s disease management.
duced during stress. Many clinical tests of stress rely on self- Levodopa is a first-line drug for treating Parkinson’s disease. It
reported and largely qualitative measures, but this work creates has been reported that long-term intermittent oral dosage of
potential opportunities for continuous and quantitative stress levodopa causes fluctuation in plasma levodopa concentrations
testing through resting sweat rate. and leads to unpredictable responses such as motor fluctuations
and dyskinesia; thus, continuous monitoring of levodopa
is important to circumvent such unforeseen responses46. Sweat
Sweat secretion induced by metabolic changes. The patch was has been reported to contain foreign drugs, including
further utilized to investigate hypoglycemia-induced sweat levodopa47,48. Sweat is a promising noninvasive way to con-
secretion. In diabetic patients, injection of insulin gives rise to tinuously monitor levodopa level inside the body. It may also
hyperhidrosis due to hypoglycemia43,44. They can also be vul- facilitate finding an optimal dosage and interval that is persona-
nerable to irregular heartbeat, which can be life-threatening45. lized to each patient. In addition, Parkinson’s patients usually
Understanding sweating and heart complications in diabetic suffer from abnormal sweating. Hyperhidrosis occurs when the
patients, hence, can facilitate diabetes management. Toward this blood levodopa concentration is low8,49 Therefore, studying sweat
aim, we performed simultaneous monitoring of heart rate, sweat behavior and monitoring levodopa concentration can assist
rate, and interstitial fluid (ISF) glucose levels to explore heart and management of Parkinson’s disease. Herein, we conducted on-
sweat complications during large glucose variation. A diabetic body trials to study how sweat levodopa evolves within our body.
subject wore the microfluidic patch on the finger along with a A healthy subject was asked to consume 100 and 200 g intake of
pulse oximeter. The measurement was done without interrupting broad beans which contain levodopa50 to observe sweat levodopa
the routine insulin injection procedures of the diabetic patient. relation to broad beans intake. In this study, boiled broad beans
During the measurement duration, the subject was asked to which were reported to contain approximately 0.6 wt% levodopa
remain sitting without vigorous movements. ISF glucose data was were used51. This corresponds to levodopa intake similar to that
recorded via Dexcom G6 continuous glucose monitor. Figure 6a, of levodopa medication consumed by Parkinson’s patients in a
b shows measurements obtained from the two trials on the day. Levodopa sensors were calibrated in sweat as shown in
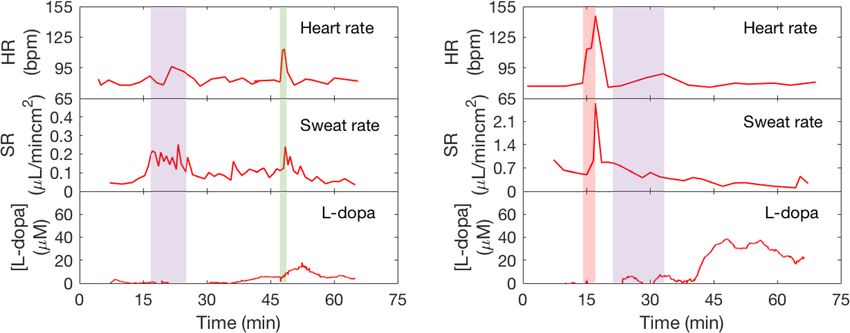
NATURE COMMUNICATIONS | (2021)12:1823 | https://doi.org/10.1038/s41467-021-22109-z | www.nature.com/naturecommunications 9ARTICLE NATURE COMMUNICATIONS | https://doi.org/10.1038/s41467-021-22109-z Fig. 6 In situ sweat analysis for hypoglycemia-induced sweat analysis. Sweat secretion rate was measured along with heart rate and ISF glucose levels of a diabetic subject. Subject had insulin injection to lower glucose levels in (a) trial 1 and (b) trial 2. Fig. 7 In situ sweat analysis to assist Parkinson’s disease management on daily basis. A healthy subject wore the microfluidic patch on the finger and had broad beans intake of (a) 1 dose = 100 g and (b) 2 doses = 200 g during the measurement duration. (levodopa = L-dopa). Supplementary Fig. 17 to ensure measurement accuracy and depend on diet, hydration, other physiological conditions that account for batch variation in absolute sensor signal. A sweat impact absorption and metabolism rates, and on sweat rate and collection well of 3 mm diameter was used. In Fig. 7a, it was secretion mechanisms. Larger population studies must be per- observed that levodopa was detected in sweat approximately formed to better understand the influence of these factors. 20 min after initial intake and its concentration peaked at 35 min In summary, we present a wearable device for rapid uptake of after intake. The peak concentration was measured to be nL min−1 cm−2 rates of thermoregulatory sweat at rest, enabling approximately 13 μm when the subject had 1 dose of levodopa near-real-time sweat rate and composition analysis at rest. This (1 dose of levodopa = 100 g of broad beans). In Fig. 7b, the represents a crucial advancement for detecting sweat rates subject again consumed 200 g of broad beans, and levodopa was associated with underlying physiological conditions, as demon- measured approximately 20 min after initial intake. Its con- strated in subject studies exploring the relation between at-rest centration peaked at 35 μm, 30 min after initial intake and slowly sweating and metabolic and stress conditions. Expanding on these decreased. Additional trials presented in Supplementary Fig. 18a, preliminary trials, this patch can be deployed for patients or b for 1 and 2 doses of levodopa intake showed similar results for applications where deregulated sweating is a priori known to the same subject. We observed that levodopa concentration in indicate underlying health conditions, or can be used in sweat generally increases with increasing doses. When other foods exploratory subject studies to decode how sweating patterns with minimal levodopa is consumed, no significant signal is relate to broader physiology. For example, hypoglycemia is observed (Supplementary Fig. 18c). This indicates that monitor- known to qualitatively increase sweating rates as the body seeks to ing sweat levodopa may be a promising way to keep track of lower core temperature to conserve energy52. The presented patch blood levodopa to assist medication management of Parkinson’s can be used to more quantitatively study this phenomenon by disease patients. However, the exact relations between sweat simultaneously accumulating data on resting sweating rates and levodopa concentration, plasma levels, and intake dose can blood glucose levels, both for an individual over time and across a 10 NATURE COMMUNICATIONS | (2021)12:1823 | https://doi.org/10.1038/s41467-021-22109-z | www.nature.com/naturecommunications
NATURE COMMUNICATIONS | https://doi.org/10.1038/s41467-021-22109-z                                                                                           ARTICLE

population of subjects. Personalized and universal correlations                          PVA in DI water was then drop-casted onto the filler (0.5 μL/mm2), ensuring a
could then be built that enable resting sweat rate to serve as a                         complete coverage on the entire filler (including side and back walls), and was
                                                                                         quickly heated on a hotplate at 80 °C. The PVA film was approximately 10 μm in
noninvasive predictor of hypoglycemia. Similarly, excessive                              thickness. Once PVA dried, an AG-GLY film was placed on top of the filler. AG-
sweating is qualitatively known to indicate psychological duress,                        GLY film was prepared by stirring and dissolving 2% agarose and 50% glycerol in
but more quantitative correlation studies can be performed                               DI water at 120 °C for 5 min. Once everything dissolved, ~3 mL of the solution was
between resting sweating rate and traditional, invasively obtained                       quickly poured into a 100 mm hydrophilic glass dish and waited until the solution
or discrete measures of mental state such as cortisol hormone                            dried to become a gel-like film. The AG-GLY solution is viscous and dries easily;
                                                                                         hence, rapid pour on a hydrophilic dish is necessary for a thin and uniform
levels53. Based on these correlations, at-rest sweat rate could then                     thickness. Here the AG-GLY film was not directly drop-casted on the filler because
be used to continuously and non-invasively estimate stress, with                         of the difficulty to achieve a thin uniform coating on the entire filler if we directly
applications in assessing and improving the welfare of infants,                          drop-casted the solution. The AG-GLY film was saturated with deionized water
soldiers, and stroke patients, and more generally of individuals                         before placing on the filler. The film is approximately 90–130 μm thick. The
                                                                                         laminated filler was finally placed inside the collection well of the
going about everyday activities. More generally, the presented                           microfluidic patch.
patch can be used to study correlations between sweat rates and
composition, helping to better understand analyte secretion                              Device characterization. Sensor characterizations were performed on CHI1430
mechanisms and guide how measured concentrations should be                               (CH Instruments, USA). The pH sensor was tested using McIlvaine’s buffer of pH
interpreted. By allowing these studies to be performed in a way                          4–8, and Cl− sensor was tested using NaCl solution of concentration ranging from
that is compatible with daily routines, this work creates fresh                          25 to 200 mM. The potential difference with respect to a reference electrode was
                                                                                         measured for both sensors. Levodopa sensor was measured by applying 0.35 V with
opportunities for decoding how noninvasive parameters relate to                          respect to a shared reference/counter silver electrode. Flow rate experiments were
deeper body health and for establishing the physiological utility of                     carried out using Harvard Apparatus PHD 2000 Syringe Pump.
sweat sensing as a whole.
                                                                                         On-body sweat analysis. On-body human trials were carried out at the University
                                                                                         of California, Berkeley in compliance with the human research protocol (CPHS
Methods
                                                                                         2014-08-6636 and CPHS 2015-05-7578) approved by the Berkeley Institutional
Materials. (3-Aminopropyl)triethoxysilane (APTES), polyvinyl butyral resin
                                                                                         Review Board (IRB). Both male and female subjects (between aged 21 and 45) were
BUTVAR B-98 (PVB), aniline, sodium chloride, tyrosinase, glutaraldehyde, bovine
                                                                                         recruited from the Berkeley campus through campus flyers and verbal recruit-
serum albumin, thionine acetate salt, Nafion® 117, tetrabutylammonium bromide
                                                                                         ments. Informed consents were obtained from all study subjects before enrollment
(TBAB), sodium chloride (NaCl) were purchased from Sigma-Aldrich. Aniline was
                                                                                         in the study. The trials indicated in Figs. 2 and 4b were conducted at 20–23 °C and
distilled prior to usage. Silver ink CI-4040 was purchased from EMS Adhesives.
                                                                                         39–50% relative humidity. Trials in Fig. 5 were conducted at 40–50% relative
Polydimethylsiloxane (Sylgard 184) was purchased from Ellsworth Adhesives.
                                                                                         humidity with temperatures indicated in the figure. The trial in Fig. 7b was con-
Moisture resistant polyester film 0.0005″ was purchased from McMasterCarr
                                                                                         ducted at 22 °C and 43% relative humidity. All other trials were conducted at 21 °C
(Los Angeles, CA).
                                                                                         and 40% relative humidity. Targeted locations for sweat analysis were wiped with
                                                                                         alcohol swab and gauze before application of the microfluidic device. Subjects were
Sensor fabrication. Conductive Au electrodes were fabricated by standard pho-            allowed to wear comfortable clothing. For heart rate measurements, a pulse oxi-
tolithography and evaporation methods as detailed in our prior work27. Electro-          meter (Zacurate Model 500DL) was used. The double-sided adhesive that was
chemical depositions required for sensor functionalization were performed on             laminated between the skin and the patch was from Adhesive Research (93551). To
PCI4G300 (Gamry Instruments, USA). pH sensor was prepared by growing Au                  ensure device could stay firmly on skin for the measurement durations, an addi-
microstructures at 0 V for 30 s to roughen the surface as demonstrated in previous       tional adhesive (93690 from Adhesive Research) was applied on top of the patch.
works54, and then electrochemically depositing aniline solution (1 M HCl, 0.1 M          No irritation from these adhesives or prolonged patch wear, and no adhesive
aniline) by performing cyclic voltammetry from −0.2 to 1 V vs. Ag/AgCl at                delamination, were found during the extended on-body trials, consistent with the
100 mV/s for 25 cycles. Cl− sensor was prepared by dropcasting silver ink and            adhesives’ suitability of over 14 days of wear as stated by the manufacturer. For the
cured at 90 °C for 30 min. The electrode was subsequently treated with 0.1 M FeCl3       on-body wrist sweat rate analysis, sweat rate sensors containing 24 radial electrodes
for 1 min. The reference electrode for pH and Cl− sensors was prepared by                were used. All the data presented were collected from separate measurements.
dropcasting a thin layer of silver ink onto the Au electrode. After drying, a solution   Sweat composition data were collected using an electrochemical workstation
containing 79.1 mg PVB and 50 mg NaCl in 1 mL methanol was dropcasted                    CHI1430 (CH Instruments, USA). Electrical sweat rate data were collected using
(10 μL/mm2). Levodopa sensor was prepared by initially growing Au nanoden-               E4980AL precision LCR meter (Keysight Technologies). All the figures were
drites using pulsed voltage from −1 to 1 V at a signal frequency of 50 Hz, 50% duty      plotted via Matlab.
cycle, and 1500 cycles, creating high surface area structures as imaged in our
previous work55. Thionine acetate salt solution (0.25 mM) was deposited by               Statistical analysis. Standard deviations shown in Fig. 2c and reported in Sup-
applying 1 Hz signal frequency, pulsed voltage from −0.6 to 0 V, 90 % duty cycle,        plementary Table 2 are calculated by considering multiple measurements of
and 660 cycles. Next, 0.2 μL of Tyrosinase solution containing 99 μL of 1% bovine        instantaneous sweat rate at each tested body location.
serum albumin, 1 μL of 2.5% glutaraldehyde, and 0.25 μL of 1 mg/mL tyrosinase
was dropcasted and dried. The membrane was additionally coated with 0.2 μL of
Nafion–TBAB solution which was prepared as reported in literature56. The levo-            Reporting summary. Further information on research design is available in the Nature
dopa sensors could be used after drying for an hour at room temperature. For long-       Research Reporting Summary linked to this article.
term storage, levodopa sensors were kept at 4 °C. The shared reference/counter
electrode for levodopa sensor was prepared by dropcasting silver ink and letting it
dry before usage.
                                                                                         Data availability
                                                                                         All relevant data supporting the findings of this study are available within the paper and
                                                                                         its Supplementary information files or from the corresponding author upon reasonable
Microfluidic device fabrication. Microfluidic was fabricated using standard                request. A reporting summary for this Article is available as a Supplementary
photolithography process. SU8 photoresist was used to pattern microfluidics on a          Information file. Source data are provided with this paper.
Si wafer. PDMS (base to curing agent ratio of 10:1) was poured onto the SU8 mold
and cured at 60 °C for 4–5 h. The cured PDMS was peeled off and put under O2
plasma, along with the PET patterned with sensing electrodes at a power of 90 W,
                                                                                         Code availability
0.2 mtorr for 1 min. 1% APTES solution was dropcasted on entire surface of the           Custom code is available at https://github.com/m-bariya1/Resting-sweat-patch-custom-code.
PET for 2 min. The PET was cleaned with DI water and quickly dry with N2. The
PET was then bonded with PDMS and left it for at least an hour before usage.             Received: 5 November 2020; Accepted: 24 February 2021;
PDMS is soaked in DI water for 5 h prior to utilization to saturate PDMS57 such
that permeation-driven flow is minimized58. Oversaturation can also be achieved
through longer presoak time at high temperature. By presoaking, sweat-containing
microfluidic channel evaporated/diffused through the PDMS at 0.01 nL min−1 cm−2
when the device was tested for 8 h at 21–23 °C and relative humidity of 39–42%.
                                                                                         References
Hydrophilic filler fabrication. The patterned SU8 filler was prepared to a thick-          1.   Sonner, Z. et al. The microfluidics of the eccrine sweat gland, including
ness of 200 μm on a flexible PET using standard procedures. The filler was carefully            biomarker partitioning, transport, and biosensing implications.
peeled off from the PET and put under O2 plasma. A solution containing 0.5%                   Biomicrofluidics https://doi.org/10.1063/1.4921039 (2015).

NATURE COMMUNICATIONS | (2021)12:1823 | https://doi.org/10.1038/s41467-021-22109-z | www.nature.com/naturecommunications                                                      11
ARTICLE NATURE COMMUNICATIONS | https://doi.org/10.1038/s41467-021-22109-z
2. Foster, K. G., Hey, E. N. & O’Connell, B. Sweat function in babies with defects 33. Shay, T., Dickey, M. D. & Velev, O. D. Hydrogel-enabled osmotic pumping for
of central nervous system. Arch. Dis. Child 46, 444–451 (1971). microfluidics: towards wearable human-device interfaces. Lab Chip 17,
3. Harpin, V. A. & Rutter, N. Development of emotional sweating in the 710–716 (2017).
newborn infant. Arch. Dis. Child 57, 691–695 (1982). 34. Zhao, F. J. et al. Ultra-simple wearable local sweat volume monitoring patch
4. Satoh, T., Ogawa, T. & Takagi, K. Sweating during daytime sleep. Jpn. J. based on swellable hydrogels. Lab Chip 20, 168–174 (2019).
Physiol. 15, 523–531 (1965). 35. Barrangou, L. M., Daubert, C. R. & Foegeding, E. A. Textural properties of
5. Korpelainen, J. T., Sotaniemi, K. A. & Myllylä, V. V. Asymmetric sweating in agarose gels. I. Rheological and fracture properties. Food Hydrocoll. 20,
stroke: a prospective quantitative study of patients with hemispheral brain 184–195.
infarction. Neurology 43, 1211–1214 (1993). 36. Lee, H. et al. A graphene-based electrochemical device with thermoresponsive
6. Wood, D. et al. Combat-related post-traumatic stress disorder: a case report microneedles for diabetes monitoring and therapy. Nat. Nanotechnol. 11,
using virtual reality graded exposure therapy with physiological monitoring 566–572 (2016).
with a female seabee. Mil. Med. 174, 1215–1222 (2009). 37. Ogawa, T. Thermal influence on palmar sweating and mental influence on
7. Cheshire, W. P. & Freeman, R. Disorders of sweating. Semin. Neurol. 23, generalized sweating in man. Jpn. J. Physiol. 25, 525–536 (1975).
399–406 (2003). 38. Kamei, T. et al. Physical stimuli and emotional stress-induced sweat secretions
8. Micieli, G., Tosi, P., Marcheselli, S. & Cavallini, A. Autonomic dysfunction in in the human palm and forehead. Anal. Chim. Acta 365, 319–326 (1998).
Parkinson’s disease. Neurol. Sci. 24(Suppl 1), S32–S34 (2003). 39. Shamsuddin, A. K. M. & Togawa, T. Continuous measurement of sweat
9. Harker, M. Psychological sweating: a systematic review focused on aetiology electrolyte quantity to evaluate mental stress. in Proc. 18th Annual
and cutaneous response. Skin Pharm. Physiol. 26, 92–100 (2013). International Conference of the IEEE Engineering in Medicine and Biology
10. Yang, Y. et al. A laser-engraved wearable sensor for sensitive detection of uric Society. vol. 1 38–39 (1996).
acid and tyrosine in sweat. Nat. Biotechnol. 38, 217–224 (2020). 40. Bahar, R. et al. The prevalence of anxiety and depression in patients with or
11. Parlak, O., Keene, S. T., Marais, A., Curto, V. F. & Salleo, A. Molecularly without hyperhidrosis (HH). J. Am. Acad. Dermatol 75, 1126–1133 (2016).
selective nanoporous membrane-based wearable organic electrochemical 41. Patterson, M. J., Galloway, S. D. R. & Nimmo, M. A. Variations in regional
device for noninvasive cortisol sensing. Sci. Adv. 4, eaar2904 (2018). sweat composition in normal human males. Exp. Physiol. /core/journals/
12. Lee, H. et al. Wearable/disposable sweat-based glucose monitoring device with experimentalphysiology/article/div-classtitlevariations-in-regional-sweat-
multistage transdermal drug delivery module. Sci. Adv. 3, e1601314 (2017). composition-in-normal-humanmalesdiv/
13. Yokus, M. A., Songkakul, T., Pozdin, V. A., Bozkurt, A. & Daniele, M. A. 31DAB66D8C207D90600B4CA48DDB1B89 (2000).
Wearable multiplexed biosensor system toward continuous monitoring of 42. Allen, A. P. et al. The trier social stress test: principles and practice. Neurobiol.
metabolites. Biosens. Bioelectron. 153, 112038 (2020). Stress 6, 113–126 (2016).
14. Emaminejad, S. et al. Autonomous sweat extraction and analysis applied to 43. Passias, T. C., Meneilly, G. S. & Mekjavić, I. B. Effect of hypoglycemia on
cystic fibrosis and glucose monitoring using a fully integrated wearable thermoregulatory responses. J. Appl. Physiol. 80, 1021–1032 (1996).
platform. Proc. Natl Acad. Sci. USA 114, 4625–4630 (2017). 44. Buono, M. & Verity, L. Cholinergic-induced sweat rate during hypo- and
15. Jia, W. et al. Electrochemical tattoo biosensors for real-time noninvasive hyperglycemia. Clin. Kinesiol. 58, 11–12 (2004).
lactate monitoring in human perspiration. http://pubs.acs.org/doi/abs/ 45. Chow, E. et al. Risk of cardiac arrhythmias during hypoglycemia in
10.1021/ac401573r (2013). patients with type 2 diabetes and cardiovascular risk. Diabetes 63, 1738–1747
16. Kim, J. et al. Noninvasive alcohol monitoring using a wearable tattoo-based (2014).
iontophoretic-biosensing system. http://pubs.acs.org/doi/abs/10.1021/ 46. Olanow, C. W. et al. Continuous intrajejunal infusion of levodopa-carbidopa
acssensors.6b00356 (2016). intestinal gel for patients with advanced Parkinson’s disease: a randomised,
17. Nyein, H. Y. Y. et al. Regional and correlative sweat analysis using high- controlled, double-blind, double-dummy study. Lancet Neurol. 13, 141–149
throughput microfluidic sensing patches toward decoding sweat. Sci. Adv. 5, (2014).
eaaw9906 (2019). 47. Kintz, P., Henrich, A., Cirimele, V. & Ludes, B. Nicotine monitoring in sweat
18. Alizadeh, A. et al. A wearable patch for continuous monitoring of sweat with a sweat patch. J. Chromatogr. B Biomed. Sci. Appl 705, 357–361 (1998).
electrolytes during exertion. Lab Chip 18, 2632–2641 (2018). 48. Tsunoda, M., Hirayama, M., Tsuda, T. & Ohno, K. Noninvasive monitoring of
19. Bandodkar, A. J., Jeang, W. J., Ghaffari, R. & Rogers, J. A. Wearable sensors plasma L-dopa concentrations using sweat samples in Parkinson’s disease.
for biochemical sweat analysis. Annu Rev. Anal. Chem. 12, 1–22 (2019). Clin. Chim. Acta 442, 52–55 (2015).
20. Li, S., Ma, Z., Cao, Z., Pan, L. & Shi, Y. Advanced wearable microfluidic 49. Mano, Y., Nakamuro, T., Takayanagi, T. & Mayer, R. F. Sweat function in
sensors for healthcare monitoring. Small 16, 1903822 (2020). Parkinson’s disease. J. Neurol. 241, 573–576 (1994).
21. Koh, A. et al. A soft, wearable microfluidic device for the capture, storage, 50. Mehran, S. M., M. & B., G. Simultaneous determination of levodopa and
and colorimetric sensing of sweat. Sci. Transl. Med. 8, 366ra165–366ra165 carbidopa from fava bean, green peas and green beans by high performance
(2016). liquid gas chromatography. J. Clin. Diagn. Res. 7, 1004–1007 (2013).
22. Twine, N. B. et al. Open nanofluidic films with rapid transport and no analyte 51. Etemadi, F., Hashemi, M., Randhir, R., ZandVakili, O. & Ebadi, A.
exchange for ultra-low sample volumes. Lab Chip 18, 2816–2825 (2018). Accumulation of l-DOPA in various organs of faba bean and influence of
23. Bariya, M. et al. Roll-to-roll gravure printed electrochemical sensors for drought, nitrogen stress, and processing methods on l-DOPA yield. Crop J. 6,
wearable and medical devices. ACS Nano 12, 6978–6987 (2018). 426–434 (2018).
24. Lin, S. et al. Natural perspiration sampling and in situ electrochemical analysis 52. Kenny, G. P., Sigal, R. J. & McGinn, R. Body temperature regulation in
with hydrogel micropatches for user-identifiable and wireless chemo/ diabetes. Temperature 3, 119–145 (2016).
biosensing. ACS Sens. 5, 93–102 (2020). 53. Burke, H. M., Davis, M. C., Otte, C. & Mohr, D. C. Depression and cortisol
25. Hauke, A. et al. Complete validation of a continuous and blood-correlated responses to psychological stress: a meta-analysis. Psychoneuroendocrinology
sweat biosensing device with integrated sweat stimulation. Lab Chip 18, 30, 846–856 (2005).
3750–3759 (2018). 54. Tian, Y., Liu, H., Zhao, G. & Tatsuma, T. Shape-controlled electrodeposition
26. Berger, M. J. & Kimpinski, K. Test–retest reliability of quantitative sudomotor of gold nanostructures. J. Phys. Chem. B 110, 23478–23481 (2006).
axon reflex testing. J. Clin. Neurophysiol. 30, 308–312 (2013). 55. Lin, Y. et al. Porous enzymatic membrane for nanotextured glucose sweat
27. Nyein, H. Y. Y. et al. A wearable electrochemical platform for noninvasive sensors with high stability toward reliable noninvasive health monitoring.
simultaneous monitoring of Ca2+ and pH. http://pubs.acs.org/doi/abs/ Adv. Funct. Mater. 29, 1902521 (2019).
10.1021/acsnano.6b04005 (2016). 56. Meredith, S., Xu, S., Meredith, M. T. & Minteer, S. D. Hydrophobic salt-
28. Tai, L.-C. et al. Wearable sweat band for noninvasive levodopa monitoring. modified Nafion for enzyme immobilization and stabilization. J. Vis. Exp.
Nano Lett. 19, 6346–6351 (2019). https://doi.org/10.3791/3949 (2012).
29. Taylor, N. A. & Machado-Moreira, C. A. Regional variations in 57. Ojuroye, O., Torah, R. & Beeby, S. Modified PDMS packaging of sensory
transepidermal water loss, eccrine sweat gland density, sweat secretion rates e-textile circuit microsystems for improved robustness with washing.
and electrolyte composition in resting and exercising humans. Extrem. Microsyst. Technol. https://doi.org/10.1007/s00542-019-04455-7 (2019).
Physiol. Med. 2, 4 (2013). 58. Randall, G. C. & Doyle, P. S. Permeation-driven flow in poly
30. Bariya, M. et al. Glove-based sensors for multimodal monitoring of natural (dimethylsiloxane) microfluidic devices. Proc. Natl Acad. Sci. USA 102,
sweat. Sci. Adv. 6, eabb8308 (2020). 10813–10818 (2005).
31. Hussain, J. N., Mantri, N. & Cohen, M. M. Working up a good sweat—the
challenges of standardising sweat collection for metabolomics analysis. Clin.
Biochem. Rev. 38, 13–34 (2017). Acknowledgements
32. Koo, H.-J. & Velev, O. D. Design and characterization of hydrogel-based This work was supported by the National Science Foundation (NSF) Nanomanufacturing
microfluidic devices with biomimetic solute transport networks. Systems for Mobile Computing and Mobile Energy Technologies (NASCENT), Berkeley
Biomicrofluidics 11, 024104 (2017). Sensor and Actuator Center (BSAC), and Bakar fellowship.
12 NATURE COMMUNICATIONS | (2021)12:1823 | https://doi.org/10.1038/s41467-021-22109-z | www.nature.com/naturecommunicationsYou can also read