Activity, Movements, and Microenvironment Associations of Siren intermedia (Lesser Siren) in a Western Kentucky Wetland Complex - University of ...
←
→
Page content transcription
If your browser does not render page correctly, please read the page content below
2021
               2021                                      Northeastern Naturalist
                                                     NORTHEASTERN     NATURALIST                    Vol. 28, No. 2
                                                                                                   28(2):114–126
                                          A.G. Davis, W. Leuenberger, A.N. Drayer, and S.. Price

                   Activity, Movements, and Microenvironment Associations
                   of Siren intermedia (Lesser Siren) in a Western Kentucky
                                       Wetland Complex
               Allison G. Davis1,*, Wendy Leuenberger1, Andrea N. Drayer1, and Steven J. Price1

               Abstract - In Kentucky, at the periphery of the species’ range, Siren intermedia (Lesser
               Siren) is a species of greatest conservation need. We monitored Lesser Sirens in a western
               Kentucky wetland complex from July 2018 to May 2019. Using funnel traps, we captured
               60 Lesser Sirens and recaptured 2 individuals. Activity was greatest in July, and lowest
               October–January. Three Passive Integrated Transponder (PIT) telemetry surveys detected
               7 PIT-tagged individuals; 1 Lesser Siren moved 36.9 m over 8 months. Capture success
               increased with warmer minimum water temperature. Body size upon first capture was un-
               related to the microenvironment of the trap location. We recommend monitoring programs
               in western Kentucky concentrate funnel trapping in warm weather and use PIT telemetry
               to study movements.

                                                                 Introduction
                  Siren intermedia Barnes (Lesser Siren) is a paedomorphic, aquatic salaman-
               der distributed in scattered populations throughout the eastern and central United
               States (Gehlbach and Kennedy 1978, Petranka 1998). The primary habitat of the
               Lesser Siren is shallow wetlands with permanent or semi-permanent hydroperiods
               that include dense aquatic vegetation and deep, organic sediment (Gehlbach and
               Kennedy 1978). Aquatic vegetation can provide nesting sites, foraging grounds
               (Gehlbach and Kennedy 1978), and cover (Brodman 2008). Lesser Sirens are noc-
               turnal bottom-feeders that spend a considerable amount of time burrowed in deep,
               mucky sediment (Davis and Knapp 1953) where they estivate during dry condi-
               tions (Gehlbach et al. 1973, Reno et al. 1972). The habits of and habitats used by
               the Lesser Siren necessitate intensive and specialized efforts to capture individuals
               (Gehlbach and Kennedy 1978, Raymond 1991, Thompson et al. 2019). Thus, many
               aspects of the natural history of the Lesser Siren are poorly understood.
                  Specifically, few studies have investigated seasonal activity, movements, and
               microenvironment associations of the Lesser Siren. Previous research suggests
               that activity levels vary geographically. In the southern US, individuals appear to
               be active throughout the year during favorable environmental conditions (Frese
               et al. 2003, Gehlbach and Kennedy 1978, Godley 1983, Johnson and Blackwell
               2011, Raymond 1991, Sever et al. 1996). In contrast, the Lesser Siren undergoes
               dormancy during cold winter months at the northern reaches of the species’ range
               (Blatchley 1899, Brodman 2008, Cagle 1942, Cagle and Smith 1939, Cockrum

               1
                Department of Forestry and Natural Resources, University of Kentucky, Lexington, KY
               40546. *Corresponding author- ada283@uky.edu.
               Manuscript Editor: Peter Paton

                                                                         114

Downloaded From: https://bioone.org/journals/Northeastern-Naturalist on 08 Jun 2021
Terms of Use: https://bioone.org/terms-of-use Access provided by University of Kentucky
2021 Northeastern Naturalist Vol. 28, No. 2
A.G. Davis, W. Leuenberger, A.N. Drayer, and S.. Price
1941). Even during times of activity, the Lesser Siren is considered relatively sed-
entary. For example, Gehlbach and Kennedy (1978) studied movements in a Texas
population and found the maximum distance moved between captures was2021 Northeastern Naturalist Vol. 28, No. 2
A.G. Davis, W. Leuenberger, A.N. Drayer, and S.. Price
July 2018 to May 2019, we deployed these trapping stations and checked them the
following morning. The interim between trapping sessions averaged 30 ± 3 d (min–
max = 27–36 d), for a total study period of 301 days. We placed funnel traps on the
surface of the water and submerged the funnel openings to ensure Lesser Sirens
could swim inside, but by-catch would not drown (Frese et al. 2003). Water levels
varied throughout the year; if a station was too shallow to submerge the funnel traps
openings, then we did not deploy traps at the site. In the southeast pool, we set trap
station 29 only if the other 3 trap stations were too shallow to set.
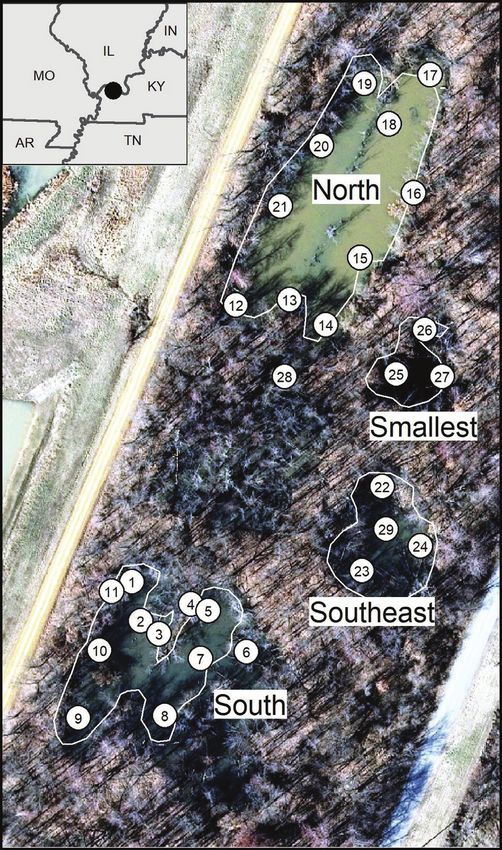
Figure 1. Placement
of 29 funnel-trap sta-
tions (numbered in
circles) for captur-
ing Lesser Sirens in
a wetland complex
(white outline) at
West Kentucky Wild-
life Management
Area, July 2018–May
2019 (KyFromAbove
2013).
116
Downloaded From: https://bioone.org/journals/Northeastern-Naturalist on 08 Jun 2021
Terms of Use: https://bioone.org/terms-of-use Access provided by University of Kentucky2021 Northeastern Naturalist Vol. 28, No. 2
A.G. Davis, W. Leuenberger, A.N. Drayer, and S.. Price
We checked traps during the morning hours. Captured Lesser Sirens were mea-
sured, weighed, and uniquely marked by injecting each with a 134.2-kHz, 12.5-mm
PIT tag (Biomark HPT12) using a Biomark© MK10 Implanter (Boise, ID). PIT tags
have a high retention rate in sirenids (Luhring 2009). We anesthetized individuals
in a solution of maximum, double-medicated Church and Dwight© Orajel® (Ac-
tive ingredients: 20% benzocaine and 0.26% menthol; Ewing Township, NJ) for
processing (Cecala et al. 2007). When the solution became weak, we added 0.5 g
of Orajel as needed and closely monitored each individual. Solution concentrations
varied from 0.5 to 2.0 g per L, and induction times varied from 3 to 25 minutes.
We processed specimens and returned them to their respective capture locations the
same day.
To augment detection rates and provide additional information on movements,
we opportunistically conducted PIT telemetry surveys along the wetland’s pe-
rimeter using a Biomark© HPR Plus portable reader with a BP portable antenna
(Biomark, Inc) and attempted to observe tagged individuals (Oldham et al. 2016).
We conducted surveys on 3 occasions (13 Nov 2018, 19 Mar 2019, and 16 Apr
2019). The hand-held reader emitted a radio frequency signal through an attached
portable antenna and could detect a PIT-tagged individual up to 34 cm away, assum-
ing optimal tag orientation and no environmental noise (Connette and Semlitsch
2012, Oldham et al. 2016).
To characterize spatial and temporal variation in the microenvironment of trap
stations, we measured depths and water temperatures. Beginning in Aug 2018,
we measured total depth (cm) and organic sediment depth (cm) using a graduated
PVC pipe at every trap station, and calculated water depth (cm) from the difference
between total depth and sediment depth. Hourly water temperatures were recorded
at 18 random trap stations using Embedded Data Systems© Thermochron iButton
temperature loggers (DS1922T-F5#, Lawrenceburg, KY) following a stratified-
random design by pool; we grouped the channel (trap station 28) with the North
pool. We coated the temperature loggers with white plastic tool dip (Plasti-Dip
International©, Circle Pines, MN) to prevent water damage and secured them to the
interior of a funnel trap with fishing line (Anderson et al. 2015). We did not collect
microenvironmental data in July 2018.
Analysis
We quantified monthly activity based on capture rates in funnel traps. To
estimate movements, we calculated the time (days), Euclidean distance (m), and
movement rate (m per day) between initial capture site and either the recapture site
in funnel traps or by detections using PIT-telemetry.
We quantified the microenvironment with 7 variables: minimum, maximum,
mean, and standard deviation (SD) of the sequence of hourly overnight water tem-
peratures (°C), organic sediment depth (cm), water depth (cm), and total depth (cm).
We included the 3 depth variables, because the Lesser Siren is known to burrow
in sediment (Davis and Knapp 1953). We included the 4 water temperature sum-
mary statistics because activity (as measured by the number of individuals captured)
in other parts of the species’ range was related to the extremes and variability of
117
Downloaded From: https://bioone.org/journals/Northeastern-Naturalist on 08 Jun 2021
Terms of Use: https://bioone.org/terms-of-use Access provided by University of Kentucky2021 Northeastern Naturalist Vol. 28, No. 2
A.G. Davis, W. Leuenberger, A.N. Drayer, and S.. Price
overnight temperature (Gehlbach and Kennedy 1978). Temperature loggers were
not deployed at every trap station every trap-night, so we interpolated nighttime wa-
ter temperature summary statistics to trap stations without loggers as follows. First,
we estimated time of sunset and sunrise at our study site on each trap night with the
R package ‘maptools’ (Bivand and Lewin-Koh 2020) and truncated the hourly se-
quences of water temperatures to nighttime, because the Lesser Siren is nocturnal
(Davis and Knapp 1953). Then we calculated water temperature summary statistics
at each logged trap station, and we assigned the mean of each summary statistic
across trap stations within a pool to the unlogged trap stations in the same pool. We
estimated the performance of this interpolation method by the root mean squared
error (RMSE) of leave-one-out cross-validation (LOOCV) with training groups
blocked by trap-night and pool to account for temporal and spatial structure of our
water temperature data (Roberts et al. 2017). We did not deploy temperature loggers
in July 2018, so those station-nights were omitted from the following analyses.
We modelled the associations between the microenvironment and funnel-trap
capture success in a generalized linear mixed-effects regression framework fol-
lowed by model selection. The unit of analysis was a trap station-night. To select
the fixed effects of the global model, we calculated Pearson’s correlation coef-
ficients (r) among the 7 microenvironment variables and omitted those that were
highly correlated (r > 0.9). We centered and scaled the remaining microenviron-
ment characteristics. The global model also included random intercepts for trap
night and trap station. We fit a global logistic linear mixed-effects regression mod-
el for capture success using the ‘glmer’ function from R package ‘lme4’ (Bates et
al. 2018) and then proceeded with model selection. We used the ‘dredge’ function
from R package ‘MuMIn’ (Barton 2020) to rank the set of all possible sub-models,
calculate Akaike’s information criterion corrected for small sample sizes (AICc),
and calculate each model’s ΔAICc from the model set’s minimum AICc value.
From the dredge output, we derived the likelihood of each model given the data
(exp[-0.5 × ΔAICc]). We considered models with a likelihood ≥0.125 given the
data and without uninformative parameters to be competing top models (Burnham
and Anderson 2002).
We modelled the associations between the microenvironment and the body
size (SVL) of Lesser Sirens upon first capture in a linear mixed-effects regression
framework followed by model selection. The unit of analysis was a trap station-
night that successfully captured a salamander. To select the fixed effects of the
global model, we calculated correlations among the 7 microenvironment variables
and omitted those that were highly correlated (r > 0.9). We centered and scaled the
remaining microenvironment characteristics. The global model also included a ran-
dom intercept for trap night. We fit a global linear mixed-effects regression model
with the ‘lmer’ function from R package ‘lme4’ (Bates et al. 2018) and proceeded
with the same model-selection process we used in the analysis of capture success.
All statistical analyses were conducted in R version 4.0.3 (R Core Team 2020). We
present mean ± SD of measured variables and confidence intervals of fitted esti-
mates throughout the paper.
118
Downloaded From: https://bioone.org/journals/Northeastern-Naturalist on 08 Jun 2021
Terms of Use: https://bioone.org/terms-of-use Access provided by University of Kentucky2021 Northeastern Naturalist Vol. 28, No. 2
A.G. Davis, W. Leuenberger, A.N. Drayer, and S.. Price
Results
We set an average of 27 ± 2 (min–max = 23–28) trap stations each trap-night
for a total of 295 trap station-nights and 590 trap-nights over 11 months. The
number of trap stations with temperature loggers averaged 17.6 ± 0.2 (min–max
=16–18 trap stations). We captured 60 individual Lesser Sirens in funnel traps and
caught more Lesser Sirens in warmer months than colder months (Fig. 2). We re-
captured 3.4% of marked individuals in funnel traps, and detected 12.1% with PIT
tag readers (n = 58) (Table 1). Over the course of our study year, our limited use
of PIT telemetry (3 winter surveys) accounted for 80% of our recaptures, and it
was the only source of detections when water temperatures were low in November
and March.
We measured movements between funnel-trap station locations of initial cap-
tures, recaptures, and detections by PIT telemetry (Table 1). We could not visually
confirm the PIT detections, but evidence of movement as we attempted to hand-
capture individuals indicated we detected a live animal. The Euclidean distance
travelled by an individual between successive observations varied from 0.0 to
34.5 m over 28 to 301 d. The furthest cumulative distance travelled by an individual
was 36.9 m over 8 months (26.3 m from August 2018 to November 2018, plus
10.6 m from November 2018 to April 2019); that individual was relatively small
(SVL = 150 mm). Body size negatively correlated with distance moved (r = -0.375)
and movement rate (r = -0.478).
Figure 2. Monthly number of detections of Lesser Siren by funnel trap (grey bar) and
PIT-tag telemetry survey (white bar) plotted against minimum underwater temperature
averaged across trap stations (mean ± SD; black dashed line and gray ribbon) as measured
by Embedded Data Systems© Thermochron iButton temperature loggers (DS1922T-F5#,
Lawrenceburg, KY). Surveys were conducted along the perimeter of a wetland complex at
West Kentucky Wildlife Management Area, July 2018–May 2019.
119
Downloaded From: https://bioone.org/journals/Northeastern-Naturalist on 08 Jun 2021
Terms of Use: https://bioone.org/terms-of-use Access provided by University of Kentucky2021 Northeastern Naturalist Vol. 28, No. 2
A.G. Davis, W. Leuenberger, A.N. Drayer, and S.. Price
The microenvironment on a trap station-night was relatively stable throughout
the study period with regards to organic sediment depth (22 ± 19 cm; min–max =
0–98 cm), water depth (18 ± 6 cm; 3–38 cm), and total depth (39 ± 18 cm; 14–101
cm), but we observed seasonal fluctuations in water temperature minima (10.6 ±
6.0 °C; 2.5–24.5 °C), maxima (14.1 ± 7.5 °C; 3.5–33 °C), means (12.4 ± 6.7 °C;
3.0–27.6 °C), and SD (1.1 ± 0.7 °C; 0.0–3.0 °C). The lower limits of water tem-
perature minima and maxima occurred in Jan 2019, and the upper limits occurred in
Aug 2018. The lower limits of water temperature SD occurred in Dec 2018 and Jan
2019, and the upper limits in Aug 2018 and Mar 2019. The performance of mean-
interpolation was good for water temperature minimum (RMSE = 1.1), maximum
(RMSE = 1.3), mean (RMSE = 1.0), and SD (RMSE = 0.3).
We assessed the association between the microenvironment and funnel-trap cap-
ture success on 266 trap station-nights, of which 35 successfully captured Lesser
Sirens. (We omitted 28 trap station-nights in July 2018 and 1 in Sept 2018 that did
not have microenvironmental data.) Water temperature minimum was highly corre-
lated with water temperature mean (r = 0.992) and maximum (r = 0.996), and total
depth was highly correlated with organic sediment depth (r = 0.950). After omit-
ting highly correlated variables, the fixed effects of the global capture model were
water temperature minimum and SD, organic sediment depth, and water depth; the
random intercepts were trap night (10 levels) and trap station (29 levels). From a set
of 16 sub-models, we found 7 with a likelihood ≥0.125 given the data, 1 of which
had no uninformative parameters. The top model (AICc = 177.9) indicated capture
probability improved with increasing minimum water temperature (odds ratio =
3.54, 95% CI: [1.78, 7.05], P < 0.001). We did not capture Lesser Sirens on trap
station-nights with minimum water temperatures below 6.5 °C.
We explored associations between the microenvironment and individual size
upon initial capture. Mean SVL was 190 ± 38 mm (n = 60), mean TL was 285 ±
54 mm (n = 60), and mean mass was 37.7 ± 21.3 g (n = 58); 2 individuals >100 g
Table 1. Movement distances (meters), time elapsed (days), and movement rates (m per day) between
detections of Lesser Sirens by funnel trap and passive integrated transponder (PIT) telemetry surveys
along the perimeter of a wetland complex at West Kentucky Wildlife Management Area, July 2018–
May 2019.
Initial capture Recapture Movement
PIT Date SVL Trap Date SVL Method Days Meters Rate
989-35683 17 Jul 2018 203 4 14 Aug 2018 NA Trap 4 28 0.0 0.000
989-35656 17 Jul 2018 275 27 14 May 2019 285 Trap 26 301 14.8 0.049
989-35660 17 Jul 2018 195 14 13 Nov 2018 NA PIT 119 2.7 0.023
989-35711 17 Jul 2018 143 21 18 Mar 2019 NA PIT 244 5.2 0.021
989-35678 14 Aug 2018 144 1 18 Mar 2019 NA PIT 216 10.2 0.047
989-95830 14 Aug 2018 142 20 13 Nov 2018 NA PIT 91 34.5 0.380
989-95836 14 Aug 2018 150 4 13 Nov 2018 NA PIT 91 26.3 0.289
16 Apr 2019 NA PIT 154 10.6 0.069
989-70732 11 Sep 2018 160 3 18 Mar 2019 NA PIT 188 21.2 0.113
989-70705 13 Dec 2018 144 7 18 Mar 2019 NA PIT 95 29.5 0.311
120
Downloaded From: https://bioone.org/journals/Northeastern-Naturalist on 08 Jun 2021
Terms of Use: https://bioone.org/terms-of-use Access provided by University of Kentucky2021 Northeastern Naturalist Vol. 28, No. 2
A.G. Davis, W. Leuenberger, A.N. Drayer, and S.. Price
were too heavy for our scale. One individual grew 10 mm in 301 d (0.03 mm per d)
between initial capture and recapture (Table 1). The SVLs and associated trap
station-night microenvironments of 40 individuals were included in this analysis,
while 20 captures from July 2018 lacked microenvironmental data and were omit-
ted. Water temperature minimum was highly correlated with water temperature
mean (r = 0.996) and maximum (r = 0.981), and total depth was highly correlated
with organic sediment depth (r = 0.960). The fixed effects included in the global
model were water temperature minimum and SD, organic sediment depth, and wa-
ter depth; the random intercept was trap night (6 levels). We dropped the random
intercept for trap station (20 levels) from the global model, because its inclusion
resulted in a singular fit (Barr et al. 2013). From a set of 16 sub-models, 5 had a
likelihood ≥0.125 given the data, and 1 (the global model) had uninformative pa-
rameters. The 4 competing top models each had 3 of the 4 fixed effects (Table 2).
Although no coefficient estimates were significant, SVL was weakly correlated with
water depth (r = 0.080), and SVL was negatively correlated with warmer minimum
water temperatures (r = -0.279).
In a post hoc examination of the association between the microenvironment and
body size, we observed a curvilinear relationship between SVL and minimum wa-
ter temperature (Fig. 3). To test the significance of this relationship, we fit a linear
mixed-effects regression model (Bates et al. 2018) where the response was SVL, the
Table 2. Competing top linear mixed-effects regression models of Lesser Siren snout–vent length
upon first capture (n = 40) in funnel traps deployed along the perimeter of a wetland complex at West
Kentucky Wildlife Management Area, August 2018 – May 2019. * indicates significant fixed effects.
Models with likelihood ≥0.125 given the data and without uninformative parameters were consid-
ered competing top models. σ2 = residual variance, τ00 = between-group variance, ICC = intraclass
correlation coefficient, n = number of random effect levels, AICc = Akaike’s information criterion
corrected for small sample sizes, ΔAICc = difference in AICc from top model, and likelihood = exp[-
0.5 × ΔAICc]
Model 1 Model 2 Model 3 Model 4
Fixed effects (estimate ± SE)
(Intercept) 181.6 ± 8.6* 181.5 ± 8.5* 182.9 ± 8.4* 181.3 ± 9.0*
Minimum temperature -5.5 ± 8.7 -9.4 ± 9.4 -3.7 ± 9.9
Organic sediment depth 7.2 ± 5.8 5.5 ± 5.7 6.6 ± 5.8
Water depth 6.3 ± 6.2 7.4 ± 6.0 3.6 ± 6.0
Temperature SD 1.5 ± 6.4 -0.5 ± 5.7 -0.6 ± 6.4
Random effects
σ2 896.11 924.28 904.98 930.32
τ00 238.95 228.03 244.65 266.87
ICC 0.21 0.2 0.21 0.22
n 6 DATE 6 DATE 6 DATE 6 DATE
Model fit
-log(L) -182.181 -182.633 -182.804 -182.861
AICc 378.908 379.812 380.153 380.267
ΔAICc 0.000 0.904 1.245 1.359
Likelihood 1.000 0.636 0.537 0.507
Weight 0.373 0.237 0.200 0.189
121
Downloaded From: https://bioone.org/journals/Northeastern-Naturalist on 08 Jun 2021
Terms of Use: https://bioone.org/terms-of-use Access provided by University of Kentucky2021 Northeastern Naturalist Vol. 28, No. 2
A.G. Davis, W. Leuenberger, A.N. Drayer, and S.. Price
fixed effects were minimum water temperature and its square, and capture date was
included as a random intercept. We found SVL had a concave-down relationship
with the square of minimum water temperature (estimate ± SE = -18.0 ± 8.1, 95%
CI: [-29.8, -3.87], P = 0.026). Had this model been included in the model-selection
process above, it would have been ranked first (AICc = 378.0, ΔAICc = -0.9).
Discussion
Activity of Lesser Sirens in western Kentucky was low during October–April
and higher during May–September. Like populations in the northern limits of the
species’ range (Blatchley 1899, Cagle 1942, Cagle and Smith 1939, Cockrum
1941), Lesser Sirens in western Kentucky may be dormant in cold months. High-
activity seasons in the south are low-activity seasons in the north (Raymond 1991),
suggesting there is an optimal ambient temperature for activity at the water’s sur-
face.
Previously, Lesser Sirens were recorded moving only 10–20 m in water (Frese et
al. 2003, Gehlbach and Kennedy 1978) and up to 6 m over land (Davis and Knapp
1953), with larger individuals moving farther than smaller individuals (Gehlbach
Figure 3. Locally-estimated scatterplot smoothing (LOESS) of association between snout–
vent length (SVL) of Lesser Sirens (n = 40) upon first capture and minimum water tempera-
ture (°C) at capture site as measured by Embedded Data Systems© Thermochron iButton
temperature loggers in a wetland complex at West Kentucky Wildlife Management Area,
July 2018–May 2019.
122
Downloaded From: https://bioone.org/journals/Northeastern-Naturalist on 08 Jun 2021
Terms of Use: https://bioone.org/terms-of-use Access provided by University of Kentucky2021 Northeastern Naturalist Vol. 28, No. 2
A.G. Davis, W. Leuenberger, A.N. Drayer, and S.. Price
and Kennedy 1978). We found 1 individual moved 37 m from initial capture site,
and movement distances and rates were negatively correlated with larger body siz-
es. This site fidelity exhibited by larger individuals might be evidence of territorial
behavior in male Lesser Sirens, which are typically larger than non-territorial fe-
males (Reinhard 2014). Farther movements by smaller individuals (SVL 100 g)
for our scale. Minimum body size in western Kentucky may be smaller than our
records, as smaller individuals are more likely to escape from funnel traps (Luhring
et al. 2016). Indeed, 2 of the smallest individuals we captured had dark band mark-
ings, possibly injuries from attempting to escape the funnel trap.
Although our model-selection analysis did not establish a significant relation-
ship between trap-station microenvironment and the body size of active Lesser
Sirens, a post hoc analysis of these data suggests a quadratic response in SVL to
minimum water temperature. Larger ectotherms may select microenvironments
with warmer, less-variable water temperatures than smaller individuals (Fitzgerald
and Nelson 2011). Alternatively, the apparent quadratic relationship could be an
artifact of same-aged cohorts congregating in similar habitat (Brodman 2008).
The ecology of the Lesser Siren in western Kentucky has not been investigated
until this study (KDFWR 2013), largely due to the species’ cryptic and benthic
nature. Future field research interested in studying the spatial ecology of the Lesser
123
Downloaded From: https://bioone.org/journals/Northeastern-Naturalist on 08 Jun 2021
Terms of Use: https://bioone.org/terms-of-use Access provided by University of Kentucky2021 Northeastern Naturalist Vol. 28, No. 2
A.G. Davis, W. Leuenberger, A.N. Drayer, and S.. Price
Siren should increase the density of the funnel-trapping grids, focus funnel trap-
ping on nights with minimum water temperature greater than 6.5 °C, and bolster
recapture rates using a combination of PIT telemetry and funnel trapping. This more
efficient, two-pronged approach could improve estimates of this elusive species’
population size and distribution, as well as reveal more information on its life his-
tory and ecology, which are essential data for anticipating and measuring the extent
of threats to the long-term survival of the Lesser Siren in western Kentucky.
Acknowledgments
We thank Tina Marshall, Marshall County High School (MCHS), MCHS Environ-
mental Science and AP Physics students, and Shelby Cosby for assistance in the field.
Steve Hampson from the University of Kentucky (UK) Kentucky Research Consortium
for Energy and Environment (KRCEE) Center for Applied Energy Research provided
logistical support. Tim Kreher (Kentucky Department of Fish and Wildlife Resources [KD-
FWR]) provided site management information. Research collection permits (SC1711110,
SC1811095) were provided by KDFWR. Funding was provided by KRCEE and the United
States Department of Energy Portsmouth Paducah Project Office, United States Depart-
ment of Agriculture McIntire-Stennis Cooperative Forestry Research Program (accession
number 1001968), and UK Department of Forestry and Natural Resources. This research
was approved under University of Kentucky Institutional Animal Care and Use Committee
protocol (2013-1073).
Literature Cited
Anderson, T.L., J.L. Heemeyer, W.E. Peterman, M.J. Everson, B.H. Ousterhout, D.L.
Drake, and R.D. Semlitsch. 2015. Automated analysis of temperature variance to deter-
mine inundation state of wetlands. Wetlands Ecology and Management 23:1039–1047.
Barr, D.J., R. Levy, C. Scheepers, and H.J. Tily. 2013. Random effects structure for
confirmatory hypothesis testing: Keep it maximal. Journal of Memory and Language
68:255–278.
Bartoń, K. 2020. MuMIn: Multi-model inference. Version 1.43.17. R package. Available
online at https://CRAN.R-project.org/package=MuMIn.
Bates, D., M. Maechler, B. Bolker, and S. Walker. 2015. Fitting linear mixed-effects models
using lme4. Journal of Statistical Software, 67(1:1–48. DOI:10.18637/jss.v067.i01..
Bivand, R., and N. Lewin-Koh. 2020. maptools: Tools for handling spatial objects. Version
1.0-1. R package. Available online at https://CRAN.R-project.org/package=maptools.
Blatchley, W.S. 1899. Notes on the batrachian and reptiles of Vigo County, Indiana II. 24th
Annual Report. Department of Geology and Natural Resources, Indianapolis, IN. 15 pp.
Brodman, R. 2008. Ecology and natural history observations of the salamander Siren in-
termedia nettingi (Western Lesser Siren) in Northern Indiana. Herpetological Review
39:414–419.
Brown, J.H. 1984. On the relationship between abundance and distribution of species. The
American Naturalist 124:255–279.
Burnham, K.P., and D.R. Anderson. 2002. Model Selection and Multimodel Inference: A
Practical Information-Theoretic Approach. Second Edition. Springer Science and Busi-
ness Media, New York, NY. 488 pp.
Cagle, F.R. 1942. Herpetological fauna of Jackson and Union counties, Illinois. American
Midland Naturalist 28:164.
124
Downloaded From: https://bioone.org/journals/Northeastern-Naturalist on 08 Jun 2021
Terms of Use: https://bioone.org/terms-of-use Access provided by University of Kentucky2021 Northeastern Naturalist Vol. 28, No. 2
A.G. Davis, W. Leuenberger, A.N. Drayer, and S.. Price
Cagle, F.R., and P.E. Smith. 1939. A winter aggregation of Siren intermedia and Triturus
viridescens. Copeia 1939:232–233.
Cecala, K.K., S.J. Price, and M.E. Dorcas. 2007. A comparison of the effectiveness of rec-
ommended doses of MS-222 (tricaine methanesulfonate) and Orajel® (benzocaine) for
amphibian anesthesia. Herpetological Review 38:63–66.
Cockrum, L. 1941. Notes on Siren intermedia. Copeia 1941:265.
Connette, G.M., and R.D. Semlitsch. 2012. Successful use of a passive integrated tran-
sponder (PIT) system for below-ground detection of plethodontid salamanders. Wildlife
Research 39:1–6.
Davis, W.B., and F.T. Knapp. 1953. Notes on the salamander Siren intermedia. Copeia
1953:119–121.
Fitzgerald, L.A., and R.E. Nelson. 2011. Thermal biology and temperature-based habitat
selection in a large aquatic ectotherm, the Alligator Snapping Turtle, Macroclemys tem-
minckii. Journal of Thermal Biology 36:160–166.
Frese, P.W., A. Mathis, and R. Wilkinson. 2003. Population characteristics, growth, and
spatial activity of Siren intermedia in an intensively managed wetland. Southwestern
Naturalist 48:534–542.
Gehlbach, F.R., and S.E. Kennedy. 1978. Population ecology of a highly productive aquatic
salamander (Siren intermedia). The Southwestern Naturalist 23:423–429.
Gehlbach, F.R., R. Gordon, and J.B. Jordan. 1973. Aestivation of the salamander Siren
intermedia. American Midland Naturalist 89:455–463.
Godley, J.S. 1983. Observations on the courtship, nests and young of Siren intermedia in
southern Florida. American Midland Naturalist 110:215–219.
Hampton, P.M. 2009. Ecology of the Lesser Siren, Siren intermedia, in an isolated eastern
Texas pond. Journal of Herpetology 43:704–709.
Johnson, J., and E. Blackwell. 2011. Population dynamics of two aquatic salamanders,
Siren intermedia and Amphiuma tridactylum, in the Mississippi Delta. BIOS 82:72–77.
Kentucky Department of Fish and Wildlife Resources (KDFWR). 2013. Kentucky’s com-
prehensive wildlife conservation strategy. Frankfort, KY. Available online at https://
fw.ky.gov/WAP/Pages/Default.aspx.
KyFromAbove. 2013. Kentucky Natural Color Imagery. TIFF. Kentucky Division of Geo-
graphic Information, N155E051. Available online at https://kygeonet.maps.arcgis.com/
home/webmap/viewer.html?webmap=ba05e691cf3a4acd9583b12ccf09856e. Accessed
April 2021.
Luhring, T.M. 2009. Using PIT tags to evaluate non-individual-specific marks under field
conditions: A case study with Greater Siren. Herpetological Review 40:170–173.
Luhring, T.M., G.M. Connette, and C.M. Schalk. 2016. Trap characteristics and species
morphology explain size-biased sampling of two salamander species. Amphibia–Rep-
tilia 37:79–89.
Oldham, C.R., J.L. Fleckenstein III, W.A. Boys, and S.J. Price. 2016. Enhancing ecological
investigations of snakes with passive integrated transponder (PIT) tag telemetry. Herpe-
tological Review 47:385–388.
Petranka, J. 1998. Salamanders of the United States and Canada. Smithsonian Institution
Press, Washington, DC. 592 pp.
Price, S.J., and T. Kreher. 2016. Amphibian habitat assessment at the Paducah Gaseous
Diffusion Plant and the West Kentucky State Wildlife Management Area. UK/KRCEE
Doc#. P27.16.2015. University of Kentucky Center for Applied Energy Research, Ken-
tucky Research Consortium for Energy and Environment, Lexington, KY. 57 pp.
125
Downloaded From: https://bioone.org/journals/Northeastern-Naturalist on 08 Jun 2021
Terms of Use: https://bioone.org/terms-of-use Access provided by University of Kentucky2021 Northeastern Naturalist Vol. 28, No. 2
A.G. Davis, W. Leuenberger, A.N. Drayer, and S.. Price
R Core Team. 2020. R: A language and environment for statistical computing. Version 4.0.3.
R Foundation for Statistical Computing, Vienna, Austria.
Raymond, L.R. 1991. Seasonal activity of Siren intermedia in northwestern Louisiana (Am-
phibia: Sirenidae). Southwestern Naturalist 36:144–147.
Reinhard, S. 2014. Life-history strategies and sexual dimorphism of the Amphibia with spe-
cial emphasis on the Urodela (Newts and Salamanders) and Gymnophiona (Caecilians).
Ph.D. Dissertation. Friedrich Schiller University Jena, Jena, Germany. 170 pp.
Reno, H.W., F.R. Gehlbach, and R.A. Turner. 1972. Skin and aestivational cocoon of the
aquatic amphibian, Siren intermedia Le Conte. Copeia 1972:625–631.
Roberts, D.R., V. Bahn, S. Ciuti, M.S. Boyce, J. Elith, G. Guillera-Arroita, S. Hauenstein,
J.J. Lahoz-Monfort, B. Schröder, W. Thuiller, D.I. Warton, B.A. Wintle, F. Hartig, and
C.F. Dormann. 2017. Cross-validation strategies for data with temporal, spatial, hierar-
chical, or phylogenetic structure. Ecography 40:913–929.
Sawyer, J.A., and S.E. Trauth. 2011. Seasonal activity, population characteristics, and age
estimation in the aquatic salamander Siren intermedia nettingi (Goin). Journal of the
Arkansas Academy of Science 65:117–125.
Semlitsch, R.D. 2008. Differentiating migration and dispersal processes for pond-breeding
amphibians. Journal of Wildlife Management 72:260–267.
Sever, D.M., L.C. Rania, and J.D. Krenz. 1996. Reproduction of the salamander Siren inter-
media Le Conte with especial reference to oviducal anatomy and mode of fertilization.
Journal of Morphology 227:335–348.
Thompson, L.M., B. Pugh, L.A. McDonald, A. Estrada, K. Horn, B.L.C. Gilman, L.K.
Belden, J.C. Mitchell, and K.L. Grayson. 2019. Surveys for population persistence and
Bd at the northeastern range edge of the Eastern Lesser Siren. Northeastern Naturalist
26:410–419.
126
Downloaded From: https://bioone.org/journals/Northeastern-Naturalist on 08 Jun 2021
Terms of Use: https://bioone.org/terms-of-use Access provided by University of KentuckyYou can also read