ADAPTATION BASELINE STAKEHOLDER AWARENESS AND ACCEPTANCE OF CLIMATE CHANGE - Dublin Climate Change Action Plans
←
→
Page content transcription
If your browser does not render page correctly, please read the page content below
ADAPTATION
        BASELINE
        STAKEHOLDER AWARENESS AND
        ACCEPTANCE OF CLIMATE CHANGE

18
22   FINGAL COUNTY COUNCIL DRAFT CLIMATE CHANGE ACTION PLAN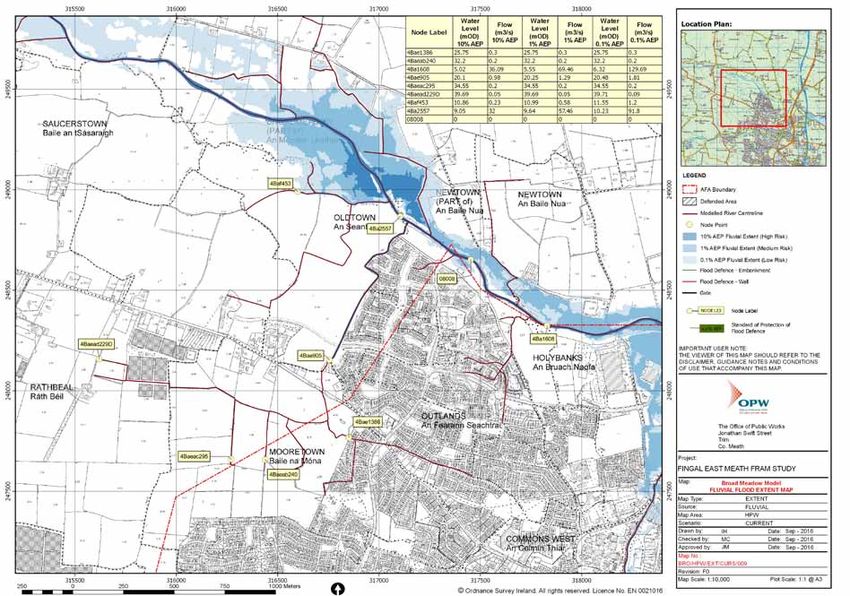
ADAPTATION BASELINE

                                                                                                                                 ADAPTATION BASELINE
Dublin’s energy agency Codema has produced this                 Further in from the coast, the County is characterised by a
adaptation baseline in line with the guidelines contained       mix of arable land, grassland, hedgerows, river valleys and
in the Local Authority Adaptation Strategy Development          urban areas. The major rivers in the County include the
Guidelines 2018 and The National Adaptation Framework.          Ward River, Delvin River, Broadmeadow River, Sluice River,
This Climate Change Action Plan has been peer reviewed          Mayne River, Tolka River, Santry River, and Liffey River.
to the requirements of the Local Authority Adaptation           It is also important to note that there are a number of
Strategy Development Guidelines 2018.                           watercourses, most of which flow directly to the Irish Sea
                                                                or via estuaries.
The objective of this baseline is to document the
occurrence of past climatic events, their frequency, the        According to the most recent Census (2016), Fingal
specific areas in Fingal that are most vulnerable, and          currently has a population of 296,020, with 104,851
the risks associated with such events. This adaptation          households, and these figures are expected to rise in
baseline also highlights the need for emergency planning        the future. The 2016 Census highlights that by 2031,
to be continually updated in line with extreme weather          population in the Greater Dublin Area (GDA) will increase
events.                                                         by just over 400,000, and this increase would account for
                                                                approximately two thirds of the total projected population
From the adaptation baseline, we can assess the current         growth in Ireland[14]. A rise in population will increase the
and future risks that will affect Fingal. These risks are       impacts of climate change due to additional pressure on
assessed and addressed by putting actions in place to           drainage systems that are already working at full capacity.
build a more resilient County that is robust, resourceful       Also, it is estimated that Ireland will need an additional
and is able to adapt in response to changes in climate          550,000 more homes by 2040, compared to 2017[4], and
and in times of crisis. The actions are a mix of grey and       this will lead to a decrease in pervious or green surfaces,
green solutions, which try to balance engineered solutions      exacerbating flooding due to enhanced run-off.
with nature-based resilience. A more exhaustive list of all
actions, including adaptation actions, may be found in          As explained in the previous section, this plan follows
each of the action areas contained in this Climate Change       the ICLEI Five Milestone Approach. As part of the second
Action Plan.                                                    milestone (Research), information was collected from
                                                                a range of departments to gather actions in each area,
BACKGROUND AND METHODOLOGY                                      through a series of meetings between Codema and staff
                                                                from all internal departments of Fingal County Council.
Ireland has a total population of 4,761,865, of which           There was also a series of collaborative workshops
approximately 1.9 million people live within five kilometres    with staff from across all four DLAs. Additional data and
of the coast; within this, 40,000 reside less than 100 metres   information was also gathered from multiple national
away from the sea[14]. Ireland has a number of climate          sources, including the Office of Public Works (OPW), Met
challenges, such as coastal flooding, sea level rise, coastal   Éireann and the Environmental Protection Agency (EPA).
erosion, pluvial flooding, extreme weather events and
extreme temperatures. The Dublin Region, being an urban         BASELINE
area, has different challenges and risks compared to more
rural areas.                                                    Table 1 on the next page summarises the climatic events
                                                                recorded by Met Éireann that have occurred in the Dublin
Fingal covers an area of 456 km2, and comprises of 88           Region over the last 32 years. These events were recorded
km of coastline, which stretches from Howth Head right          due to their unique intensity and abnormal weather
up to Balbriggan, encompassing villages, recreational           patterns. The effects (see description) of these major
areas and valuable protected natural habitats such as the       events are not purely economic; they also highlight social
Rogerstown Estuary.                                             and environmental impacts and vulnerabilities, as further
                                                                described in the following sections.

                                                                     FINGAL COUNTY COUNCIL DRAFT CLIMATE CHANGE ACTION PLAN     23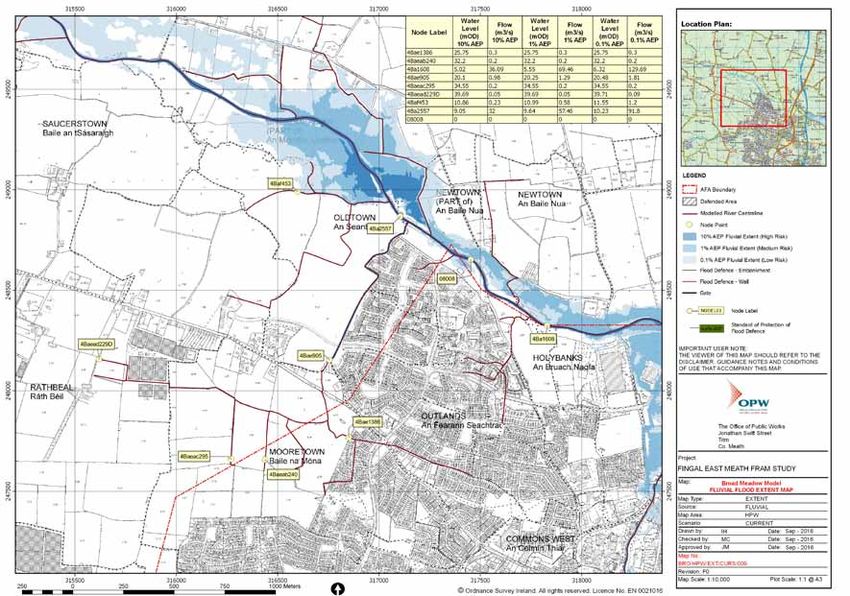
Table 1 Major Climatic Events in Dublin (Source: Met Éireann & Flooding.ie)

         TYPE                       DATE             DESCRIPTION
          Hurricane Charley         August 1986      Pluvial – Worst flooding in Dublin in 100 years.

          Pluvial & Strong Winds    February 1990    Heavy rain and consequently flooding, with long periods of strong winds. All weather
                                                     stations reported gale gusts.

          Pluvial/Fluvial           June 1993        100 mm of rain fell in Dublin and Kildare (more than three times the normal amount).

          Extreme Temperatures      June - August    Warmest summer on record, with mean air temperatures over two degrees above normal
                                    1995             in most places. Temperatures rose to around 30°C on a number of days and night time
                                                     minimum temperature remained above 15°C for many weeks.

          Windstorm                 December 1997    Conditions were severe in much of Leinster, especially the south and east. In the Dublin
                                                     area, there were record gusts of 150 km/h, with maximum 10-minute winds of storm
                                                     force.

          Fluvial                   November 2000    250 properties flooded in Dublin, 90.8 mm of rain fell. Significant disruption and damage,
                                                     especially in the area of the Lower Tolka catchment.

          Coastal                   February 2002    Second highest tide ever recorded. This caused sea defences to be overtopped. 1,250
                                                     properties flooded in Dublin, €60M worth of damage.

          Fluvial                   November 2002    Similar to the 2000 flood, 80 mm of rain fell in Dublin. This led to high river levels in the
                                                     River Tolka, which caused extensive flooding along the catchment.

          Extreme Temperatures      Summer 2006      Warmest summer on record since 1995.

          Pluvial                   August -         76 mm of rain fell at Dublin Airport. Severe flooding in areas, many of which had no
                                    September 2008   previous history of such flooding. Over 150 residential properties were inundated, as well
                                                     as commercial premises, public buildings, major roadways, etc.

          Pluvial                   July 2009        This was a 1-in-50-year event. Several areas within the Dublin Region were severely
                                                     affected.

          Extreme Cold              December 2010    It was the coldest of any month at Dublin Airport in 50 years. Casement Aerodrome’s
                                                     temperature plummeted to -15.7°C on Christmas Day, the lowest temperature ever
                                                     recorded in the Dublin Region.

          Pluvial/Fluvial           October 2011     This was between a 1-in-50 and 1-in-100-year event across the majority of Dublin.
                                                     Properties and roads were flooded, some electricity customers had no power supply in
                                                     the County.

          Coastal                   January 2014     The highest tide ever recorded, at 3.014 metres ODM recorded at Alexandra Basin.

          Storm Darwin              February 2014    1-in-20-year event, with gusts of 100-110 km/h in Dublin. Considerable damage to
                                                     housing and other buildings. 8,000 ha of forests damaged. Status: Yellow.

          Storm Ophelia             October 2017     First storm to come from a southerly direction, with damaging gusts of 120 to 150 km/h.
                                                     100 large trees blown over in the Dublin Region and significant damage to buildings
                                                     throughout the country. Status: Red

          The Beast from the East   February –       Met Éireann issued its first Status Red warning for snow on record. Closure of all schools
          and Storm Emma            March 2018       in the country, many businesses affected, water and power restrictions or outages.
                                                     Status: Red

          Extreme Temperatures      Summer 2018      Drier and warmer weather than normal throughout Ireland, with drought conditions in
                                                     many areas, including Dublin. Temperatures reached 28°C with above average sunshine
                                                     and heat wave conditions. Water restrictions were in place for the country for the majority
                                                     of the summer. Status: Yellow

          Storms Ali and Bronagh    September 2018   Storm Ali brought widespread, disruptive wind, which led to the delay or cancellation of
                                                     most flights to and from Dublin Airport. Storm Bronagh passed over the east of Ireland
                                                     bringing heavy rain. Mean wind speeds between 65-80 km/h and gusts between 110-130
                                                     km/h. Status: Orange

24   FINGAL COUNTY COUNCIL DRAFT CLIMATE CHANGE ACTION PLAN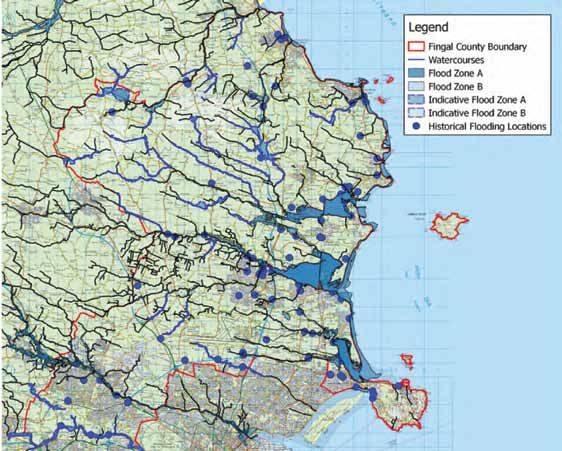
ADAPTATION BASELINE
Figure 4 Timeline of Major Climatic Events in Fingal
CLIMATIC EVENTS, TRENDS & RISKS
Table 2 on the following page shows a 30-year overview of
Fingal’s urban and rural geographic and demographic different climate variables (cold snaps, heat waves, storm
characteristics make it vulnerable to certain risks. As a rural surges, coastal erosion, etc.), which are grouped into three
environment, Fingal is home to agriculture, horticulture, types of events and trends (extreme weather events, sea level
equine industries, centres of food production and agri-food rise and flooding). This table summarises the current effects
businesses. A changing climate can result in an increase in of the climate change variables, projected changes in the
climatic events and will put Fingal’s rural environment at risk. next 30 years, and confidence in these projections.
Whilst as an urban environment, the Dublin Region creates its
own unique micro-climate and this can intensify current and The climatic events and trends that
future climate impacts. An example of this is the urban heat Fingal is facing are:
island effect, making it warmer than the surrounding semi-
urban and rural areas. This is mainly due to heat absorption
from built-up areas in the
urban environment,
waste heat
generated from urban activities and a lack of tree cover,
which can reduce temperatures in the Fingal area through
shading. Flood risks are also higher in urban areas due to
the amount of impervious surfaces and lack of vegetation
(pervious surfaces); this results in enhanced rainwater run-off,
which may result in flooding.
Risks may be categorised as:
1. Economic loss, which includes damage to infrastructure
and the disruption of daily activities
2. Social loss, including damage to human life, health,
community and social facilities
3. Environmental and heritage loss, which takes into
consideration the sensitivity of the environment (the
natural, cultural and historical environment), habitats and
species.
Risks in urban environments are exacerbated, which means
we need to assess the impacts of not only extreme weather
and climatic events, but also climatic trends, such as urban
flooding, sea level rise and increasing temperatures. These
events and trends should not be considered as independent,
as they influence each other. The slow, gradual increase
in temperatures and sea level rise will contribute to the
increased frequency and intensity of extreme weather events
and flooding.
FINGAL COUNTY COUNCIL DRAFT CLIMATE CHANGE ACTION PLAN 25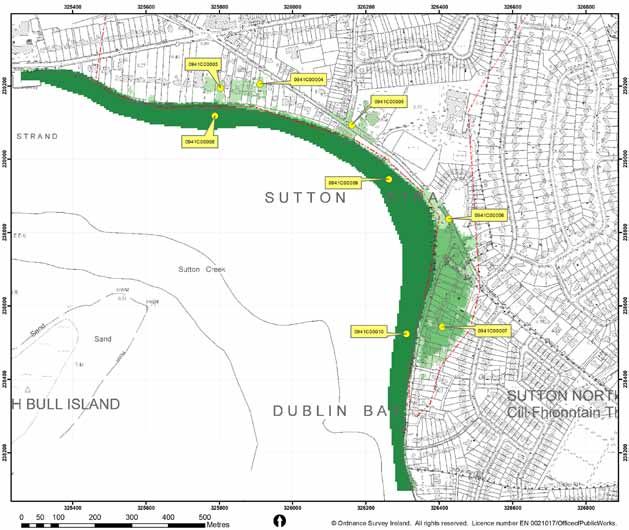
Table 2 Climate Variables Projection: 30 Year Overview

          CLIMATIC EVENTS
                          PARAMETER      OBSERVED                            CONFIDENCE   PROJECTED CHANGES
          & TRENDS

                           Cold Snaps    Increasing average air              Medium       Projections for 2050 indicate an increase in mean
                                         temperatures may result in a                     annual temperature, in the range of 1-1.6 °C. This will
                                         decrease in the frequency of                     result in milder temperatures and a decrease in the
                                         cold snaps                                       frequency of cold snaps

                           Heat Waves    Average air temperatures are        High         Eight heat waves have been recorded in Ireland over
                                         increasing and may result in an                  the last 30 years (more than 5 days at temperatures
                                         increase in the frequency and                    exceeding 25°C). Projections for 2050 predict a mean
                                         intensity of heat waves                          annual temperature increase of 1-1.6°C, which will
                                                                                          intensify the temperature and duration of heat waves

                           Dry Spells    Precipitation is becoming           High         Ireland as a whole will experience drier summers,
          Extreme                        more seasonal and is likely                      with a decrease of up to 20% in summer
          Weather                        to cause drier periods in the                    precipitation under a high emission scenario. This
          Events                         summertime                                       will result in longer periods without rainfall, which
                                                                                          will affect water-sensitive regions and sectors

                           Extreme       The number of days with             Medium       The frequency of extreme rainfall is expected to
                           Rainfall      rainfall greater than 0.2 mm                     keep on increasing over the years, especially in the
                                         and 10 mm has gradually been                     autumn and winter seasons
                                         increasing

                           Wind Speeds   Wind speeds are increasing          Low          Long term trends cannot be determined accurately;
                                         slightly in the winter periods                   although it is anticipated that wind speed will
                                         and decreasing over the                          change in a minor way, the frequency of wind storms
                                         summer time                                      is expected to increase in the winter periods and
                                                                                          decrease in summer

                           Sea Level     Seas and oceans surrounding         High         Future projections indicate a sea level rise of an
                           Rise          Ireland are rising and will keep                 average of 3-4 mm per year worldwide, but a 6-7 mm
                                         doing so                                         rise per year in Dublin Bay was recorded between the
                                                                                          years 2000 and 2016

                           Wave Height   Sea waves and wave height           Medium       Projected changes in wave heights remain uncertain.
                                         are determined by wind speed                     However, significant wave heights (the mean height
                                         and direction. As wind speeds                    of the highest 1/3 of waves) show an increasing trend
                                         and wind storms become more                      of 14 cm per decade
                                         frequent, wave heights also
                                         increase
          Sea Level        Tides         Increasing sea levels are           High         Sea levels will continue to rise and will result in
          Rise                           resulting in record high tides                   increased levels of high tides
                                         (greater than 2.9 metres)

                           Coastal       Rising sea levels and increasing    Medium       20% of Ireland’s coastline is currently eroding, with
                           Erosion       storm surges are likely to                       the east and south coasts being the most vulnerable
                                         increase coastal erosion

                           Storm         Surges can become more              Low          The frequency of intense cyclones and strong winds
                           Surges        frequent as extreme weather                      is expected to rise in the north-east Atlantic. By 2050,
                                         events, such as intense rainfall                 storm surge heights between 50 and 100 cm are
                                         and high wind speeds, become                     likely to increase in frequency
                                         more frequent

                           Coastal &     As both sea level rise and wave     High         A rise in both sea levels and wave heights is
                           Tidal         heights increase, the frequency                  projected to increase, which will lead to an increase
                                         of coastal and tidal flooding                    in coastal flooding
                                         also increases

                           Fluvial       Increased rainfall intensity,       High         Projections show both high tides and the intensity of
                                         high river flows and high tides                  rainfall days are increasing, which, in turn, will result
          Flooding                       contribute to an increase in                     in an increase in fluvial flooding
                                         fluvial flooding

                           Pluvial       Increased rainfall intensity will   Medium       It is predicted that the probability of flood events
                                         likely lead to an increase in                    occurring will increase and the number of heavy
                                         pluvial flooding                                 rainfall days per year is also projected to increase,
                                                                                          resulting in a greater risk of pluvial flooding

26   FINGAL COUNTY COUNCIL DRAFT CLIMATE CHANGE ACTION PLAN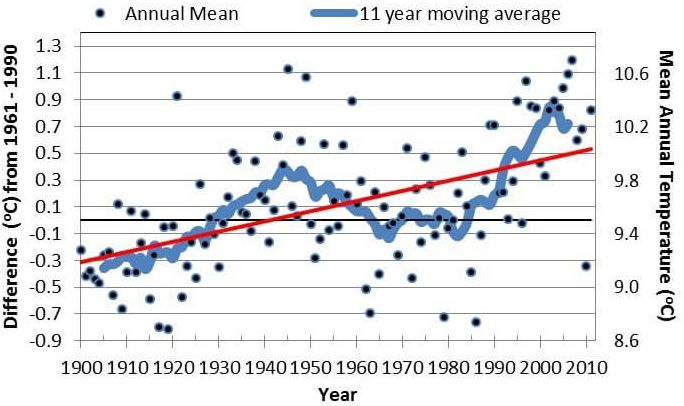
To better understand the impact that future climate risks have on Fingal, five impact areas were identified, which include all
the different sectors in the County. These are:

                                                                                                                                   ADAPTATION BASELINE


 These were chosen to mirror the action areas used throughout this Climate Change Action Plan (Energy and Buildings,
 Transport, Nature-Based Solutions, Resource Management and Flood Resilience), which reflect FCC’s remit.

 The influence of future risks on the impact areas was assessed through the use of risk matrices. Risk matrices calculate
 the overall future risk incurred by the different sectors in Fingal. The projected changes (Table 2) give an overview of the
 future risk that Fingal is likely to face in the coming years. A future risk may be defined as a product of likelihood and
 consequence:

                                        Future Risk = Consequence x Likelihood

 The consequences of the future             The likelihood is the probability        Both the likelihood and consequences
 risks (the level of damage caused          of these future risks occurring,         are given a range of ratings from one
 by a climatic event or trend) range        and these range from almost              to five and the result of their product
 from critical to negligible                certain, likely, possible, unlikely      is the future risk, which can be
 consequences:                              to rare:                                 either high (most urgent to address),
                                                                                     medium or low risk:

    Consequence                     x         Likelihood                      =        Future Risk

    Critical           5                      Almost Certain      5                    High Risk       [15-25]
    Major              4                      Likely              4                    Medium Risk [7-14]
    Moderate           3                      Possible            3                    Low Risk        [1-6]
    Minor              2                      Unlikely            2
    Negligible         1                      Rare                1

 Risk matrices for different climatic events and trends may be found in the risk section of extreme weather events, sea
 level rise and flooding. Further analysis about risk matrices and the method by which they are calculated may be found in
 Appendix I. A more in-depth analysis of these risks and their consequences on the delivery of the local authority’s services
 and functions will be carried out. Future iterations of this Climate Change Action Plan will benefit from this assessment
 and this information may be gathered through the facilitation of climate change risk workshops for the Dublin Local
 Authorities.

                                                                         FINGAL COUNTY COUNCIL DRAFT CLIMATE CHANGE ACTION PLAN   27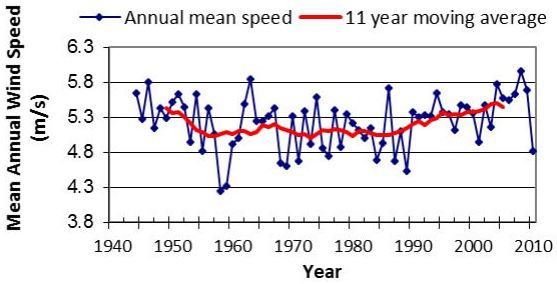
EXTREME WEATHER EVENTS

        The Fingal area has experienced an increase in extreme                            summarised in Table 1 earlier in this chapter. In February
        weather events, and this is evident from the Timeline of                          and March 2018, Dublin experienced its greatest snowfall
        Major Climatic Events (illustrated earlier in this chapter                        since the winter of 1982, with depths of up to 55 cm.
        in Figure 4). While we cannot attribute all these events to                       This was coupled with extreme cold and blizzard-like
        climate change, they are the most evident consequence of                          conditions, as a result of Storm Emma coming from
        climate change.                                                                   the Atlantic, and the ‘Beast from the East’, which also
                                                                                          impacted most of Europe. Met Éireann issued its first-ever
        Their effects are in the form of prolonged periods of                             Status Red warning for snow nationwide, which led to
        extreme cold or heat, which cause snow and heat waves,                            severe disruption to the County for a prolonged period.
        hurricane gusts due to violent winds, and heavy rainfall                          The continuous heavy snowfalls and deep snow drifts
        resulting in flooding.                                                            resulted in the closure of all schools across the country.
                                                                                          Many businesses in Fingal were forced to close, and
        Globally, temperatures are increasing and are expected                            many homes and businesses also experienced power
        to continue increasing during summer times, with                                  outages. High demands were placed on the country’s
        extreme cold spells in the winter months. Meanwhile,                              water network, with as many as 1.2 million households
        average precipitation is expected to decrease during the                          and businesses in and around Dublin affected by water
        summer and autumn period, with extreme rainfalls in the                           outages or curtailments in the days after Storm Emma[15].
        winter time. The frequency of extreme wind conditions,
        particularly during the winter, is also expected to increase.                     Dublin’s rainfall is also changing; in the last decade, the
                                                                                          number of days with rainfall greater than 0.2 mm has been
        BASELINE ASSESSMENT                                                               gradually increasing, as are days with over 10 mm of rain.
                                                                                          This can be seen in Figure 5 below. Furthermore, data from
        The Dublin Region has experienced extreme weather                                 Met Éireann shows that from 1961-2010, there was a 5%
        events within the last 15 years; many of these are                                increase in average yearly rainfall[16,17].

                     Figure 5 Annual Rainfall (1941-2010) (Source: Met Éireann / Dwyer)

28   FINGAL COUNTY COUNCIL DRAFT CLIMATE CHANGE ACTION PLAN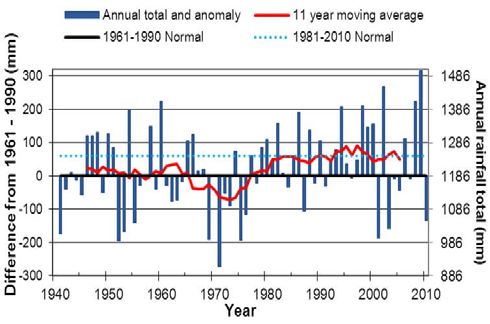
As seen in Figure 6 below, Met Éireann has already identified a 0.5°C increase in temperature, based on available data from
1961-2010, and these temperature rises are set to continue. Based on medium to low emission and high emission scenarios,

                                                                                                                                                   ADAPTATION BASELINE
“Projections indicate an increase of 1–1.6°C in mean annual temperatures, with the largest increases seen in the east of the
country.”[18] This will see new challenges for Fingal in terms of the urban heat island effect and loss of biodiversity. In addition
to surface temperature, sea temperature will also increase, having an adverse effect on the marine environment.

Wind is characterised by speed and direction, which allows us to measure the strength and frequency of weather systems
as they move across Ireland. Consistent wind speed data is only available for the last 15-20 years, due to changes in
measurement equipment and techniques, so long term trends cannot be determined accurately[19].

               Figure 6 Mean Surface Air Temperature (1900-2011) (Source: Met Éireann / Dwyer)

               Figure 7 Dublin Airport Wind Trends (1944-2010) (Source: Met Éireann / Dwyer)

                                                                                         FINGAL COUNTY COUNCIL DRAFT CLIMATE CHANGE ACTION PLAN   29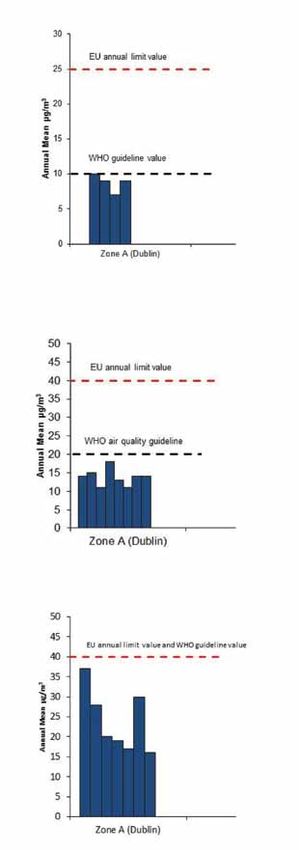
EXTREME WEATHER RISKS                                         FUTURE RISKS

        Fingal’s temperatures are already increasing, and parts       Met Éireann predicts that Ireland as a whole will
        of Fingal experience urban heat island effects due to         experience wetter and milder winters, with a 10-15%
        its physical characteristics (e.g. prevalence of concrete     increase in rainfall, and drier summers[16,17]. “Projections
        buildings retaining heat) and a lack of cooling and shading   suggest average temperatures will continue to increase,
        from natural vegetation. Rising temperatures impact the       with warming across all seasons. A warming climate may
        County’s air quality, which degrades as the concentration     cause stresses to vulnerable populations, such as children
        of pollutants increase. Recently, in the summer of 2018,      and the elderly. Areas to the east are expected to see the
        Ireland experienced extreme temperatures, which caused        strongest increase over the coming decades.”[17] Meanwhile,
        heat wave and drought conditions, and resulted in a           precipitation projections indicate an increase of up to 20%
        hosepipe ban for most of the summer, due to water             in heavy rainfalls during the winter and autumn seasons[17].
        shortages throughout the country.
                                                                      Although no long-term wind speed trend can be

                                                                      accurately determined, it has been projected that extreme
         URBAN HEAT ISLANDS
                                                                      wind speeds will increase during the winter periods[17].
         Urban heat islands occur as a result of the
                                                                      This would greatly affect critical infrastructure such
         high thermal capacity of buildings. Research
                                                                      as communication and transportation, which may be
         has shown that built-up urban areas retain
                                                                      disrupted by the violent winds. Also, this increase in
         heat for longer periods of time than rural
                                                                      extreme wind events, coupled with sea level rise and
         areas; consequently, urban areas are often 5
                                                                      coastal storms, may lead to increased wave heights and
         to 10 degrees warmer than rural areas.
                                                                      could result in habitat loss and damage, due to coastal
                                                                      and soil erosion.
        As shown in the Timeline of Major Climatic Events (Figure
        4), the frequency of extreme cold spells in Ireland has       EXTREME WEATHER ADAPTATION ACTIONS
        increased, and in the Dublin Region there are additional
        risks due to these extreme temperatures. Prolonged            The aim of compiling extreme weather adaptation actions
        periods of cold can result in pipes freezing and then         is to reduce the effects of these events. Some of these
        bursting when temperatures rise, potentially resulting in     adaptation actions are also addressed in other sections
        flooding and disruptions to water supply, as experienced      (Flooding and Sea Level Rise).
        during Storm Emma, where homes in parts of Fingal such
        as Rush, Skerries, Lusk and the Naul were left without        Some of the actions that have been adopted by Fingal
        water.                                                        County Council include:
                                                                      • Communication at national and local level with the
        These extreme weather events pose significant risks to          general public, promoting appropriate behaviour and
        critical assets such as electricity infrastructure. Violent     actions to be taken to limit impacts during extreme
        gusts of wind during Storm Ophelia caused damage                weather events
        to power networks, resulting in 385,000 homes and             • Emergency planning strategies, continually aligned with
        businesses being left without electricity across Ireland.       extreme weather events
        Such strong winds also put Fingal at risk of coastal          • Monitoring and forecasting of extreme weather events,
        flooding, due to sea surges caused by both sea level rise       which include accurate and timely weather-related
        and extreme weather. Due to the characteristics of Fingal,      alerts, real-time time surveillance, evaluating and
        prolonged heavy rainfall events typically result in urban       monitoring
        flooding, which is mainly caused by a lack of pervious        • The use of nature-based solutions (SuDs) to reduce the
        surfaces. Flooding also puts groundwater supplies at risk,      increased risk from heat waves and flooding
        as these can be contaminated due to the high infiltration     • Energy-efficient buildings to ensure preparedness to
        of flood water.                                                 extreme temperatures. All new developments in Ireland
                                                                        have to be energy-efficient, and must comply with
                                                                        nearly Zero Energy Building (nZEB) standards after the
                                                                        31st of December 2020 and public sector bodies must
                                                                        be compliant by the 31st of December 2018 for all new
                                                                        buildings

30   FINGAL COUNTY COUNCIL DRAFT CLIMATE CHANGE ACTION PLAN
RISK MATRIX
ADAPTATION BASELINE
Table 3 Extreme Weather Events Risk Matrix
IMPACT AREAS DESCRIPTION PARAMETER CONSEQUENCE LIKELIHOOD FUTURE RISK
Projected increases in temperature, Cold Snaps 4 3 12
wind speeds, cold snaps and
rainfall will put a stress on the Heat Waves 2 4 8
Critical built environment, particularly
Infrastructure on critical infrastructure (such as
Dry Spells 3 5 15
& the Built electricity and communication
Environment networks) and residential
developments (with the most Extreme Rainfall 4 3 12
vulnerable populations being
particularly at risk) Wind Speeds 5 2 10
Cold Snaps 5 3 15
Increases in wind speeds, cold Heat Waves 2 4 8
snaps and rainfall will put a stress
Transport on transport networks, which may Dry Spells 2 5 10
lead to disruption of transport
services during extreme events Extreme Rainfall 3 3 9
Wind Speeds 4 2 8
Cold Snaps 5 3 15
Projected increases in temperature,
wind speeds, cold snaps and Heat Waves 4 4 16
rainfall will put an increased
Biodiversity stress on biodiversity, by causing Dry Spells 4 5 20
damage, habitat loss and
increasing the prevalence of Extreme Rainfall 3 3 9
invasive species
Wind Speeds 3 2 6
Cold Snaps 2 3 6
Projected increases in temperature, Heat Waves 4 4 16
heat waves and droughts may
Waste
increase the risk of fires in landfill Dry Spells 4 5 20
Management
sites and can also increase the
prevalence of vermin and odour Extreme Rainfall 5 3 15
Wind Speeds 1 2 2
Cold Snaps 5 3 15
Projected increases in temperature,
cold snaps and rainfall will Heat Waves 4 4 16
affect flows and quality of water
Water resources. Temperature increases
Dry Spells 5 5 25
Resources and dry spells will result in a
reduction of water resource
availability, whilst cold snaps can Extreme Rainfall 5 3 15
cause disruption of water services
Wind Speeds 1 2 2
FINGAL COUNTY COUNCIL DRAFT CLIMATE CHANGE ACTION PLAN 31SEA LEVEL RISE
The rise in sea levels in Ireland is mainly due to climate sediments, as is the case along the eastern coast
change, and the seas and oceans surrounding our island (Dublin). Areas at risk in Fingal include Sutton, Baldoyle,
are rising at approximately 35 mm per decade[20]. The main Portmarnock, Malahide, Portrane and Skerries.
cause of sea level rise is an increase in temperatures; as
these temperatures increase, our oceans absorb more BASELINE ASSESSMENT
of this heat and expand. As the oceans become warmer,
glaciers and polar ice caps start to melt and cause sea As a coastal County, Fingal is facing rising sea levels.
levels to rise. Mean Sea Level (MSL) is the average of all the high and
low tides over the course of a year. Over the last 15 years,
Coastal flooding is influenced by sea level rise, and since the Annual Average Sea Level (AASL) in the Dublin Region
Fingal is a coastal County, rises in sea level and coastal has been rising faster than initially projected (Figure 8).
tides would significantly impact the County and its Data collected by Dublin City Council shows the AASL for
infrastructure. Continual rise of sea levels and the increase the years 2014, 2015 and 2016 were 78, 138 and 114 mm
in the frequency, magnitude and intensity of coastal Observed Difference in Mean (ODM) respectively. This
storms will further exacerbate existing complications of compares to values in the period between 2000 and 2004,
flooding, coastal erosion and deposition. which were much closer to 0 mm ODM.
Coastal and estuarine flooding are both very much The highest tide ever was recorded in Dublin City was on
affected by sea level rise. Changes in sea levels will cause the 3rd of January 2014, reaching 3.014 metres at Malin
the extent of estuaries to increase and thus result in the Head. The second highest tide recorded was on the 1st
infiltration of tides further upstream in rivers. This would of February 2002, at 2.950 metres at Malin Head. These
mean that areas along rivers that are already at risk of were the highest tides recorded for the last 400 years, and
flooding will be at increased risk of sea level rise. Rising sea possibly longer for Dublin Bay. To reduce vulnerability
levels also provide a higher base for storm surges, which to sea level rise, a minimum safety of four metres above
increase their intensity. present sea level in the east coast of Ireland has been
recommended by the Royal Irish Academy Irish Committee
Approximately 20% of Ireland’s coastline is eroding[20]. on Climate Change; this accounts for a rise in sea level
These coasts are particularly more susceptible to of 0.5 metres, a storm surge of 2.95 metres, and a safety
erosion, as they are typically made up of unconsolidated margin[21].
Figure 8 Dublin Annual Average Sea Level 2000-2016 (Source: DCC)
32 FINGAL COUNTY COUNCIL DRAFT CLIMATE CHANGE ACTION PLANIt is important to note that sea level rise, while an • Coastal deposition and damage to existing defences
important phenomenon to understand for Fingal, is from increased wave heights at the coastline. This
ADAPTATION BASELINE
only one element that contributes to flooding issues in will greatly affect coastal habitats, with estuaries and
the County. It is also important to understand the other wetlands particularly vulnerable
elements which, when combined with rising sea levels, • Changes in coastal morphology, changes in sea level
contribute to flooding. This includes combinations of with an increase in intensity of coastal storms tend to
extreme tide levels, which are made up of astronomic exacerbate coastal erosion and deposition risk
tides and storm surges (fluctuations in water level due to • Risks to wastewater infrastructure, sea level rise can
atmospheric pressure, wind speed, seiches, etc.) and wave result in overflows from combined drainage systems
action. being unable to function, resulting in increased flood
risk on land. Also as wastewater treatment plants and
SEA LEVEL RISE RISKS sewage pumping stations are often located close to the
coast, these facilities are at particular risk
Current risks associated with sea level rise have been • Damage to critical infrastructure and housing from
published by the OPW, and can be categorised as coastal flooding and sea level rise. This results in
economic, social and environmental risks. Areas that are economic and social risks to the County, especially since
particularly at risk from sea level rise in Fingal include housing and major infrastructure are along the coast
Sutton, Baldoyle, Portmarnock, Malahide, Portrane and • Increased wave heights and high tides, producing
Skerries. The risks associated with sea level rise in Fingal damage further inland and upstream
are:
Figure 9 Areas Currently at Risk of Sea Level Rise in Fingal due to Predicted Sea Level Rise (Source: Adapted from OPW/RPS)
FINGAL COUNTY COUNCIL DRAFT CLIMATE CHANGE ACTION PLAN 33FUTURE RISKS area of economic and environmental importance to the
County.
“In terms of relative land vulnerabilities, Dublin, Louth and
Wexford are at highest risk. Under a projected sea level rise An increase in temperature results in a rise in sea surface
of 6 m, it is estimated that close to 1,200 km2 of land area temperature, which results in the continual increase in sea
would be at risk.”[17] Future projections indicate continued level rise. A rise in sea levels also has a knock-on effect for
sea level rise will be 3-4 mm per year globally[20], but 6-7 other risks, as it increases the intensity of storm activity
mm per year is the recorded average sea level rise in and wave action. Models comparing 1900-1961 data
Dublin Bay for the period between 2000 and 2016. This, show that for the period between 2031-2060, storm surge
coupled with increased wave heights, tides and frequency heights of between 50-100 cm will increase in frequency[17].
of coastal storms, means that coastal communities will This will make Fingal very vulnerable, and would result
face increased economic, social and environmental in increased loss of land, damage to infrastructure and
vulnerabilities. At the same time, intense rainfall will also coastal flooding. The amount of rainfall (specifically in the
see fluvial influences in the tidal area downstream. summer) is expected to decrease as a result of climate
change, and Fingal (especially the agricultural sector in
Figure 9 on the previous page highlights some of the areas the County) will become more reliant on groundwater to
along Fingal’s coastline that are at risk in green; this is an supply freshwater as a result.
RISK MATRIX
Table 4 Sea Level Rise Risk Matrix
IMPACT AREAS DESCRIPTION PARAMETER CONSEQUENCE LIKELIHOOD FUTURE RISK
Increases in sea levels and wave Sea Level Rise 4 5 20
overtopping, along with increased Wave Height 4 3 12
Critical
occurrence of coastal storms, will put
Infrastructure
the built environment at risk. This will Tides 4 4 16
& the Built
include residential housing and critical
Environment Coastal Erosion 3 3 9
infrastructure, which are typically built
along the coast Storm Surges 4 2 8
Sea Level Rise 4 5 20
Projected rises in sea level, wave
heights and occurrence of coastal Wave Height 4 3 12
storms will put transport services (such
Transport Tides 3 4 12
as roads and the DART) that are along
the coast and close to tidal rivers at Coastal Erosion 3 3 9
increased risk
Storm Surges 4 2 8
Sea Level Rise 5 5 25
Rising sea levels, wave heights and Wave Height 4 3 12
occurrence of coastal storms will greatly
Biodiversity Tides 3 4 12
affect coastal habitats, with estuaries
and wetlands being particularly at risk Coastal Erosion 4 3 12
Storm Surges 4 2 8
Sea Level Rise 4 5 20
Increases in sea levels and tides will put Wave Height 4 3 12
Waste pressure on sanitation systems (these
Tides 4 4 16
Management are typically situated at low levels)
located close to the coast Coastal Erosion 2 3 6
Storm Surges 2 2 4
Sea Level Rise 4 5 20
Rising sea levels, wave heights and tides Wave Height 3 3 9
Water put water supply and aquifers at risk.
Tides 4 4 16
Resources Therefore, sea level rise will need to be
constantly managed to avoid flooding Coastal Erosion 2 3 6
Storm Surges 3 2 6
34 FINGAL COUNTY COUNCIL DRAFT CLIMATE CHANGE ACTION PLANSEA LEVEL RISE ADAPTATION ACTIONS • Restoration of wetland ecosystems along the coast, in
order to provide natural protection against flooding and
ADAPTATION BASELINE
The priority of these actions is to reduce and address erosion
the current and future effects of sea level rise. Some of • Policy and planning regulatory measures including the
the solutions that have been adopted by Fingal County control and management of new developments in areas
Council include: at risk. Implementing the OPW Flood Risk Guidelines
• Approaches that reduce coastal flooding and erosion and recommendations of the OPWLocation
flood
Plan :risk studies,
through the addition of artificial sediments, dune such as the Fingal East Meath Flood Risk Assessment
rehabilitation and restoration and Management Studies (FEM FRAMS) and Catchment
• Grey solutions, which include infrastructure such as Flood Risk Assessment and Management studies
seawalls that protect nearby infrastructure from coastal (CFRAMs)
flooding and sea level rise. Infrastructure for adaptation
is designed to best available information and data, and Most rivers in County Dublin are tidal rivers, and as is the
takes into consideration current and projected flood case in the river shown below, as sea levels increase, the
levels risk from storm surges (both upstream and downstream)
EXTENT MAP
Legend:
also increases. 10 % AEP Flood Extent
Fluvial flooding may also occur within the area shown on this (1 in 10 chance in any given year)
map. Please refer to the fluvial flood extent map. 0.5 % AEP Flood Extent
(1 in 200 chance in any given year)
Figure No. SLU/HPW/EXT/CURS/004 0.1 % AEP Flood Extent
Location Plan : (1 in 1000 chance in any given year)
Location Plan :
© Government of Ireland Defended area
OSi permit number EN-002-1006
±
High Confidence (FLOODING
The effects of urbanisation and climate change both capacity
impact and increase the risk of flooding. This is the case • Pluvial flooding from intense and sudden rainfall
for Fingal, which has had an increase in urban areas and running over-ground and exceeding capacity of local
is also a coastal County that has a complex system of drainage systems is a key risk across the whole County
rivers, canals, surface-water sewers, foul sewers and urban • Flooding from dam discharges or breaches
watercourses.
Flooding can have multiple causes, including sea level rise, BASELINE ASSESSMENT
run-off water, heavy rainfall, extreme events, storms and
tidal surges. Fingal experiences several types of flooding, As outlined earlier in Table 1, there are very few records
including: of significant flooding events between the years 1986
• Coastal and tidal flooding resulting from storm surges, and 2000. More extreme weather events have been noted
wave action causing flooding by overtopping flood between the years 2000 and 2002, and from 2008 onwards,
defences or other extreme weather events that cause their frequency increased at a significant rate. This can be
sea levels to rise above the norm and force sea water seen in the Timeline of Major Climatic Events (Figure 4).
onto land
• Fluvial flooding is caused by rainfall (extended or It is important to note that flood risks may not be
extreme), resulting in rivers exceeding their capacity attributed to just one cause and could be due to multiple
• Network flooding resulting from urban drainage factors that result in major flooding.
systems being inundated with water and exceeding their
Figure 11 Historic Flooding Risks in Fingal (Source: Fingal Development Plan)
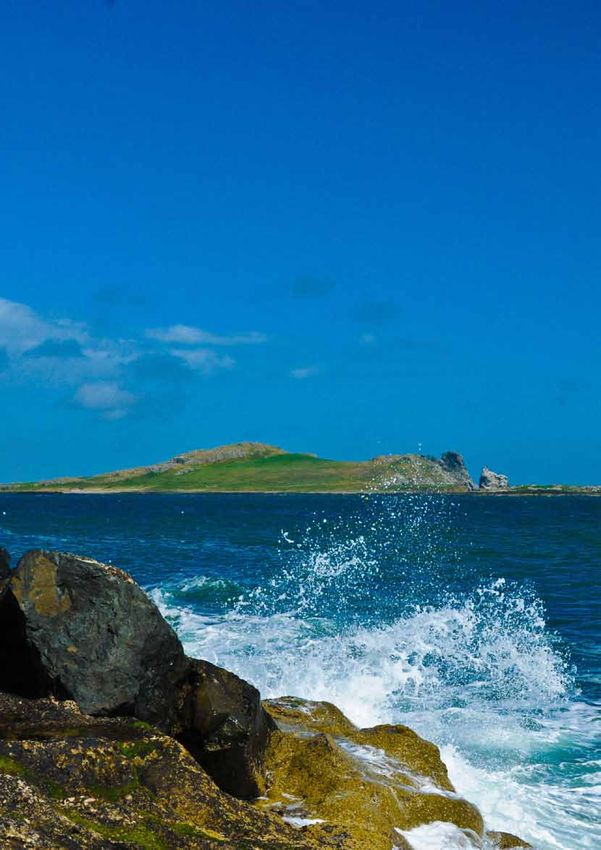
36 FINGAL COUNTY COUNCIL DRAFT CLIMATE CHANGE ACTION PLANFLOOD RISKS Figure 12 below depicts the likely flooding along the
Broadmeadow River.
ADAPTATION BASELINE
There are tidal flooding risks along Fingal’s coasts, whilst
inland there are fluvial risks mainly along the Ward River, Flooding risks are further complicated by riparian rights.
Broadmeadow River, Tolka River, Santry River and the Some property or land-owners who own land that is
River Liffey. These rivers may be seen in Figure 11 on the adjacent to a watercourse, or has a watercourse running
previous page (circles in blue represent historical flooding through it, are riparian owners and have certain legal
locations). responsibilities to maintain the watercourse.
Figure 12 Areas at Risk of Fluvial Flooding - Broadmeadow River (Source: Adapted from OPW)
FINGAL COUNTY COUNCIL DRAFT CLIMATE CHANGE ACTION PLAN 37FUTURE RISKS Future flood risks may be mitigated by urban settlement
patterns, land use and the quality of flood forecasting,
With climate change, it is predicted that the probability of warning and response systems in place. Fingal is especially
flood events occurring will increase. The number of heavy vulnerable to future risks, due to the projected population
rainfall days per year is also projected to rise, resulting in a growth over the coming years. This increased risk of
greater risk of both fluvial and pluvial flooding. flooding will affect Fingal’s already vulnerable systems,
in terms of increased pressure on water and sanitation
Figure 13 below depicts a flood risk assessment carried systems, and damage to critical infrastructure and
out in Fingal and the Annual Event/Exceedance Probability property.
(AEP) is used; this is the chance of an event occurring in a
year, i.e. there is a 1-in-100 chance that a flood will occur.
Location Plan :
© Government of Ireland
OSi permit number EN-002-1006
±
EXTENT MAP
Legend:
10 % AEP Flood E
(1 in 10 chance in
Location Plan :
1 % AEP Flood E
(1 in 100 chance i
0.1 % AEP Flood
(1 in 1000 chance
Defended area
Flooding in this area caused
by overspill from the Ballyboghill river High Confidence (
Medium Confiden
Low Confidence (
High Confidence (
Medium Confiden
6Ta5275
Low Confidence (
6Ta5519
Modelled River Ce
6Ta5016 6Ta4609
EXTENT MAP Node Point
6Ta4822 21Ma237 Node label with le
Legend: 21Ma237 Node level with flo
10 % AEP Flood Extent 6Ta4247 High confidence
(1 in 10 chance in any given year) 6Ta3920 Medium confidence refe
Low confidence
1 % AEP Flood Extent
(1 in 100 chance in any given year)
0.1 % AEP Flood Extent
Location Plan : (1 in 1000 chance in any given year) 6Ta3652 USER NOTE :
USERS OF THESE MAPS SHOULD RE
Defended area 6Ta3273
THEIR DERIVATION, LIMITATIONS
CONDITIONS OF USE PROVIDED AT T
THIS MAP DOES NOT FORM PART OF
USED FOR ANY PURPOSE.
High Confidence (RISK MATRIX
ADAPTATION BASELINE
Table 5 Flooding Risk Matrix
IMPACT AREAS DESCRIPTION PARAMETER CONSEQUENCE LIKELIHOOD FUTURE RISK
Coastal, fluvial and pluvial flooding will Coastal & Tidal 5 5 25
Critical put additional stress and risk on the built
Infrastructure environment. This additional risk will Fluvial 5 5 25
& the Built cause all areas in the built environment
Environment to suffer (businesses, residential, critical
Pluvial 4 4 16
infrastructure, etc.)
Increases in coastal, fluvial and pluvial Coastal & Tidal 5 5 25
flooding will cause road damage, which
Transport Fluvial 5 5 25
can lead to disruptions to all transport
services Pluvial 4 4 16
Coastal & Tidal 4 5 20
Increasing extreme flood events can
Biodiversity cause loss of habitats and damage to Fluvial 3 5 15
ecosystems
Pluvial 2 4 8
Coastal & Tidal 4 5 20
Flooding of landfill sites increases
Waste
the risk of surface and groundwater Fluvial 3 5 15
Management
contamination
Pluvial 4 4 16
Increases in flooding incidents put more Coastal & Tidal 5 5 25
pressure on water systems, which are
Water Fluvial 4 5 20
typically located at the lowest elevation
Resources
possible and are therefore at a greater
risk of flooding Pluvial 4 4 16
FLOODING ADAPTATION ACTIONS • Site-specific measures – this may involve using existing
natural landscapes or existing infrastructure to reduce
The purpose of flooding adaptation actions is to reduce flooding. Examples of this are raised property floor
the effect of flooding events, and they should tackle both levels and limited development in the area
current and future risks from flooding. The objectives of • Generic measures – such as Sustainable urban
flood adaptation actions are: Drainage Systems (SuDS), which is mandatory for
1. Economic – ensure that expenditure for flood risk all new developments. If SuDS cannot be provided
management is based on cost benefit analysis for at the site, then there must be alternative means
2. Social – reduce risk to life and health, while protecting of reducing run-off. To reduce flood risks in new
key infrastructure and ensuring that there is no developments, the Greater Dublin Strategic Drainage
increased risk to other areas Study states that no new development is permitted
3. Environmental and heritage – protect, and enhance if within 10-15 metres on either side of watercourses,
possible, biodiversity and cultural heritage planning applications must include a surcharge risk
assessment and drainage systems must be isolated
Fingal has maintained flood resilience through the use from basements
of spatial planning and infrastructure projects with a • Flood management - the use of The Planning System
preference given to nature-based solutions. Some of these and Flood Risk Management Guidelines from the
adaptive measures include: Office of Public Works (OPW), as a measure for flood
management and adaptation. These guidelines are
• Community and business flood resilience measures
to be properly implemented and included in any
– such as flood forecasting and monitoring systems to
development, planning and flood mitigation/adaptation
forecast coastal surges
measures
FINGAL COUNTY COUNCIL DRAFT CLIMATE CHANGE ACTION PLAN 39Legend:
10 % AEP Flood Extent
(1 in 10 chance in any given year)
0.5 % AEP Flood Extent
(1 in 200 chance in any given year)
0.1 % AEP Flood Extent
Location Plan : (1 in 1000 chance in any given year)
Defended area Location Plan :
© Government of Ireland 6Ta4247
OSi permit number EN-002-1006
High Confidence (AIR POLLUTION AND AIR QUALITY RISKS
ADAPTATION BASELINE
Air pollutants depend greatly on the climate and
characteristics of the area. Dublin’s emissions from the
transport sector, construction industry and the burning of
waste and emissions from industrial activities, all make
the County vulnerable to pollutants.
Air pollution and air quality risks mainly relate to health
and risks to ecosystems. Vulnerable citizens (children,
pregnant women, the elderly and those of ill health) are
the most likely to be at risk. The risk to health may include
worsening respiratory issues and a reduction in lifespan.
Meanwhile, ground level poor air quality may put food Individual Stations
production (e.g. crops) at risk. Excessive pollutants may
result in acid rain from air pollution and eutrophication, Figure 15 Annual Mean PM2.5 (Fine Particulate Matter)
Concentrations at Individual Stations in 2016 (Source: EPA)
which is caused by pollutants being distributed to plants
and rivers from run-off water.
This is also exacerbated by prolonged increases in air
temperatures. Air quality monitors on the national
ambient air quality monitoring network detected elevated
ozone concentrations during the summer 2018 heat wave,
with increased levels of ground level air pollution.
FUTURE RISKS
Existing risks may be further exacerbated in the future,
especially with a projected population growth. As
the County’s population grows, so does the need for
transportation and transport networks, energy, waste
Individual Stations
disposal and housing. Any new technologies (biomass,
etc.) introduced to tackle climate change will need to be
assessed for impacts on air quality. Figure 16 Annual Mean PM10 (Particulate Matter)
Concentrations at Individual Stations in 2016 (Source: EPA)
Emissions of air pollutants, particularly PM10 and NOX
(nitrogen oxide), from road traffic, remain the biggest
threat to air quality in urban areas[25]. Even though the new
standards for car emissions have resulted in cleaner fuels
and reduced emissions, Ireland has still seen an increase
in both the number of cars and their engine sizes. Also,
there has been a shift to diesel engines in recent years,
which are lower in CO2 but are higher in particulate matter.
The Dublin Region has had an increase in construction
and development over recent years, and construction
is projected to grow with the increased demand for
housing from a growing population. As construction and
demolition in Fingal increases, so do airborne emissions
Individual Stations
and dust particles, which further aggravate health issues in
the population.
Figure 17 Annual mean NO2 (Nitrogen Dioxide)
Concentrations at Individual Monitoring Stations in 2016
(Source: EPA)
FINGAL COUNTY COUNCIL DRAFT CLIMATE CHANGE ACTION PLAN 41AIR POLLUTION AND AIR QUALITY ADAPTATION relationship between the various agencies that make up the
ACTIONS front line emergency response. The MEM Framework defines
a major emergency as:
Air pollution and air quality adaptation actions aim to
“Any event which, usually with little or no warning, causes
reduce and monitor the effects from air pollution. This is
or threatens death or injury, serious disruption of essential
done through policy and legislation to regulate pollutants
services or damage to property, the environment or
generated from different energy sectors in Fingal. The two
infrastructure beyond the normal capabilities of the principal
sectors that impact most on air quality are home heating
emergency services in the area in which the event occurs,
and transport. A shift from the burning of solid fuel to
and requires the activation of specific additional procedures
cleaner, more energy efficient methods of home heating
and the mobilisation of additional resources to ensure an
and a move away from the use of private diesel and petrol
effective, co-ordinated response"[26].
powered motor cars to alternative modes of transport
such as walking, cycling and electric vehicles will result in
The MEM Framework enables Principal Response Agencies
cleaner air and a healthier environment for citizens. This is
(PRAs), which are made up of An Garda Síochána, the Health
especially important in our at-risk urban environments. To
Service Executive and local authorities, to prepare and
incentivise and complement these behavioural changes
make a coordinated response to major emergencies. Small-
in the public, it is imperative that Ireland adopts policy
scale events are dealt with by Principal Emergency Services
solutions that can marry the twin issues of ambient air
(PES), which include An Garda Síochána, the Ambulance
quality and climate change mitigation. The government’s
Service, the Fire Service and the Irish Coast Guard. Defence
National Clean Air Strategy, which is due for publication,
Forces, voluntary emergency services, transport companies
should point the way forward in terms of policy solutions for
and affected communities can support PRAs by managing
Ireland in this regard.
major emergencies.
Actions adopted by Fingal County Council include:
• Effective enforcement controls - The Air Pollution Act Figure 18 below shows the national, regional and
1987 to regulate and monitor illegal burning, excessive local structures that have been set up to support the
emissions from industry and dust emissions from the development of the Framework.
construction industry
• Transport policies to reduce pollutants. This includes the
provision of cycle routes, a restriction on heavy goods
vehicles and the expansion of Quality Bus Corridors
(QBCs)
• Control of development whilst giving preference to high
density occupancy developments that are close to public
transport routes and amenities
• Environmental Impact Assessment (EIA) and Statements
required for large developments that apply for planning
permission. EIAs should provide details of impacts that
the development will have on air quality
• Reviewing and updating of emission inventories, urban
air quality modelling and ambient air quality monitoring
EMERGENCY RESPONSE PLANNING
The adaptation baseline has shown that extreme weather
events due to a changing climate are increasing in both
frequency and intensity, and can pose a risk to citizens
and infrastructure. This highlights the need for emergency
planning, with plans that are continually updated in line
with these extreme weather events. The Major Emergency
Figure 18 Structures for Implementation (Source: Major Emergency
Management (MEM) Framework sets out the working Management Framework)
42 FINGAL COUNTY COUNCIL DRAFT CLIMATE CHANGE ACTION PLANEMERGENCY RESPONSE AT A LOCAL AND • Manage, control and coordinate FCC’s overall response
REGIONAL LEVEL to the major emergency
ADAPTATION BASELINE
• Provide support to FCC’s Controller of Operations on site
Fingal County Council is part of the Major Emergency and gain resources from FCC or externally
East Region, and is a Principal Response Agency (PRA). • Liaise with relevant government departments on
The Dublin Fire Brigade is its Principal Emergency Service strategic issues
(PES) and Dublin City Council administers the Dublin Fire • Ensure participation of FCC in the inter-agency
Brigade on behalf of Dún Laoghaire-Rathdown County coordination structures
Council, Fingal County Council and South Dublin County
Council. EMERGENCY RESPONSE SERVICES & RESOURCES
The Major Emergency Plan of Fingal County Council 2011[27] The Dublin Fire Brigade provides the primary response to
includes an ongoing emergency programme that involves emergencies in the County. FCC supports this response by
hazard analysis and risk assessment, response planning, providing, amongst others, the following functions:
recovery planning and involvement in inter-agency • Coordinating the delivery of services from all Council
training, exercises and regional forums. departments
• Making buildings such as leisure and community centres
Each Council department undertakes an appraisal available to people displaced by the emergency
of their current procedures and operational plans, to • Providing a volunteer Civil Defence organisation
ensure compatibility with the major emergency planning • Providing advice and assistance with clean up after
documents. major flooding or pollution
• Assessing structural damage to buildings
When a major emergency is declared, senior management • Coordinating and leading multi-agency meetings to
within the local authority, An Garda Síochána and the plan community recovery
Health Service Executive establish a local coordinating
group. Key roles in this group include a controller of The Dublin Fire Brigade coordinates meetings, activities,
operations, an on-site coordinator and FCC’s Crisis training and support for the FCC Crisis Management Team,
Management Team (CMT). including carrying out a review of the Major Emergency
Plan and Severe Weather Plans.
Sub-Plans for Responding to Severe
Weather & Flood Emergencies
Severe Weather Plans are a sub-plan of the Emergency
Plan, and can be activated in preparation, response
to or recovery of a major emergency. Severe weather
emergencies may pose significant threats to the areas
within the local authorities' boundary, so therefore they
are the lead agency for coordinating the response to
severe weather events in their area. Met Éireann issues
public service severe weather warnings to FCC, with the
target time for issuing a warning being 24 hours before
the start of the event, or up to 48 hours in advance when
confidence is high.
Figure 19 Local Authority Control of Resources (Source: Major Emergency
Plan of Fingal County Council 2011)
FCC has set measures to receive and respond promptly
to public service severe weather warnings issued by
Met Éireann. FCC’s response to flood events is led by the
The CMT is a strategic level management team within FCC Operations Department and Water Services Department
and reports directly to the Chief Executive. The CMT is (on behalf of Irish Water).
assembled during a major emergency, and is responsible
for the following:
FINGAL COUNTY COUNCIL DRAFT CLIMATE CHANGE ACTION PLAN 43You can also read