Added value of diffusion-weighted MRI in assessment of pleural lesions
←
→
Page content transcription
If your browser does not render page correctly, please read the page content below
Sabri et al. Egyptian Journal of Radiology and Nuclear Medicine                  (2021) 52:184
https://doi.org/10.1186/s43055-021-00557-3
                                                                                                                   Egyptian Journal of Radiology
                                                                                                                          and Nuclear Medicine

 RESEARCH                                                                                                                                             Open Access

Added value of diffusion-weighted MRI in
assessment of pleural lesions
Youssriah Yahia Sabri1, Ikram Hamed Mahmoud2, Lamis Tarek El-Gendy3, Mohamed Raafat Abd El-Mageed1 and
Sally Fouad Tadros1*

  Abstract
  Background: There are many causes of pleural disease including variable benign and malignant etiologies. DWI is a
  non-enhanced functional MRI technique that allows qualitative and quantitative characterization of tissues based on
  their water molecules diffusivity. The aim of this study was to evaluate the diagnostic value of DWI-MRI in detection
  and characterization of pleural diseases and its capability in differentiating benign from malignant pleural lesions.
  Results: Conventional MRI was able to discriminate benign from malignant lesions by using morphological features
  (contour and thickness) with sensitivity 89.29%, specificity 76%, positive predictive value 89%, negative predictive
  value 76.92%, and accuracy 85.37%. ADC value as a quantitative parameter of DWI found that ADC values of
  malignant pleural diseases were significantly lower than that of benign lesions (P < 0.001). Hence, we discovered
  that using ADC mean value of 1.68 × 10⁻³ mm2/s as a cutoff value can differentiate malignant from benign pleural
  diseases with sensitivity 89.3%, specificity 100%, positive predictive value 100%, negative predictive value 81.2%, and
  accuracy 92.68% (P < 0.001).
  Conclusion: Although DWI-MRI is unable to differentiate between malignant and benign pleural effusion, its
  combined morphological and functional information provide valid non-invasive method to accurately characterize
  pleural soft tissue diseases differentiating benign from malignant lesions with higher specificity and accuracy than
  conventional MRI.
  Keywords: DWI, Pleural lesions, MRI

Background                                                                                 Routinely, conventional radiography or CT and not
There are many causes of pleural disease including vari-                                 MRI are used to identify pleural diseases [4]. However,
able benign and malignant etiologies [1]. Pleural diseases                               MRI has an additional benefit in particular cases (e.g.,
are generally classified into non-neoplastic and neoplas-                                malignant pleural mesothelioma), being superior to CT
tic diseases. Non-neoplastic diseases include pleural effu-                              and other imaging modalities in depiction of chest wall,
sion and pleural thickening (focal or diffuse), while                                    mediastinum, and diaphragmatic invasion [5].
neoplastic diseases are either benign (e.g., lipoma and                                    MRI has recently enhanced the diagnostic competence
solitary fibrous tumor) or malignant (most commonly                                      of pleural lesions, owing to its ability to combine mor-
malignant pleural mesothelioma and metastasis) [2]. Al-                                  phological and functional information, so it is able to
though the most frequent radiographic findings of                                        differentiate benign from malignant pleural diseases, in
pleural disease are pleural effusion or thickening, etio-                                addition to providing further data in malignant pleural
logical diagnosis is challenging [3].                                                    diseases as regards their prognosis and treatment re-
                                                                                         sponse [4]. Diffusion-weight images (DWI) is not are a
* Correspondence: sallyfouad86@gmail.com                                                 non-enhanced functional MRI technique that allows
1
 Faculty of Medicine, Cairo University, Kasr Al-Ainy Faculty of Medicine,                characterization of tissues based on their water mole-
Al-Manial, Cairo 11559, Egypt
                                                                                         cules diffusivity. DWI analysis is performed by
Full list of author information is available at the end of the article

                                         © The Author(s). 2021 Open Access This article is licensed under a Creative Commons Attribution 4.0 International License,
                                         which permits use, sharing, adaptation, distribution and reproduction in any medium or format, as long as you give
                                         appropriate credit to the original author(s) and the source, provide a link to the Creative Commons licence, and indicate if
                                         changes were made. The images or other third party material in this article are included in the article's Creative Commons
                                         licence, unless indicated otherwise in a credit line to the material. If material is not included in the article's Creative Commons
                                         licence and your intended use is not permitted by statutory regulation or exceeds the permitted use, you will need to obtain
                                         permission directly from the copyright holder. To view a copy of this licence, visit http://creativecommons.org/licenses/by/4.0/.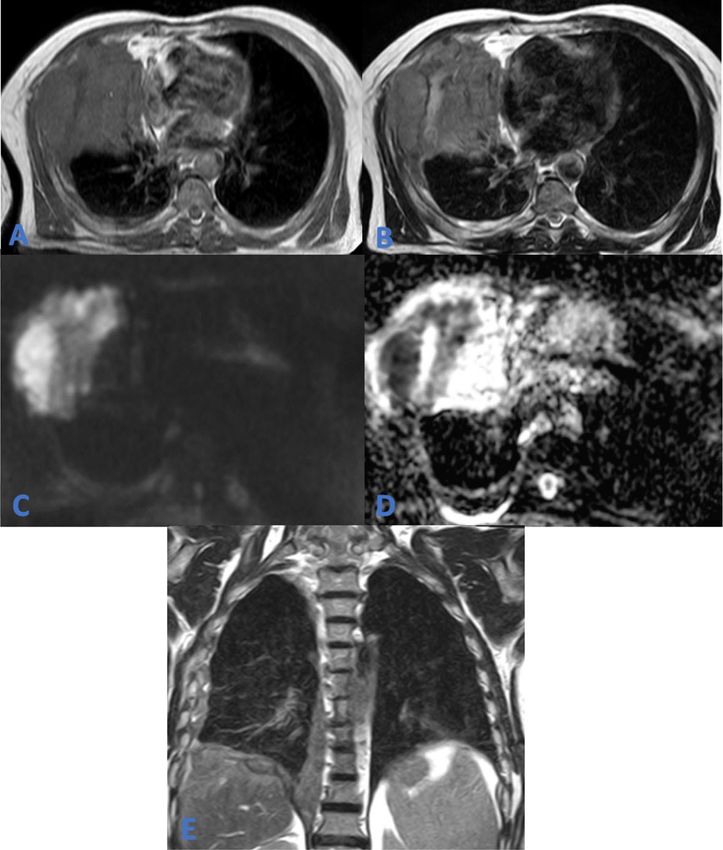
Sabri et al. Egyptian Journal of Radiology and Nuclear Medicine    (2021) 52:184                                          Page 2 of 9

qualitative and quantitative methods [6]. Qualitative (vis-              MRI technique
ual) assessment of DWI is based on the restriction of                    MRI of the chest with DWI was done using a 1.5T unit
water movement in highly cellular tissues, as tumors,                    (Achieva; Philips Medical Systems, Best, The
causing them to appear bright on DWI [7]. Quantitative                   Netherlands) at our Radiology Department.
analysis of DWI is achieved by calculating its apparent
diffusion coefficient (ADC) value which is inversely pro-                Patient preparation
portional to tissue cellularity. Low ADC values are ob-                  Explanation of the procedure to the patient and instruct-
served in highly cellular tissues in which water diffusion               ing them to keep motionless and breathe calmly during
is restricted, while high ADC values reflect free diffusion              the examination time.
of water molecules [8]. The DWI should always be inter-                    If contrast enhanced study was recommend, 0.01 ml/
preted in combination with the ADC maps and the con-                     kg of contrast was injected by an automatic injector into
ventional MRI sequences to prevent diagnostic pitfalls                   a venous catheter placed in a peripheral vein.
[6].
   The aim of this study was to evaluate the diagnostic                  Patient position
value of DWI-MRI in detection and characterization of                    The patients were put in a supine position with the head
pleural diseases and its capability in differentiating be-               directed to the scanner bore.
nign from malignant pleural lesions.
                                                                         Image acquisition
                                                                         A 16-channel phased array torso coil (Sense XL Torso;
Methods                                                                  Philips Healthcare) was used to acquire axial and cor-
Our local institutional review board approved this pro-                  onal T1 WI, axial, axial, coronal and sagittal T2 WI,
spective cross-sectional study, and written informed con-                axial STIR, and DWI. Respiratory gated technique was
sent was obtained from all participants or their                         used. MR imaging parameters are listed in Table 2.
authorized representatives.                                                 The ADC maps were calculated by the MR system via
                                                                         linear regression analysis of the natural log of signal in-
                                                                         tensity using all three b values (0, 500, and 1000 s/mm2).
Study population
This study included 57 patients (36 males and 21 fe-
                                                                         Image analysis
males; their ages ranged from 10 to 81 with mean age of
                                                                         MR images were qualitatively analyzed by visually asses-
48.53 years) referred to the Radiology Department dur-
                                                                         sing of the different pulse sequences and quantitatively
ing the period from March 2019 to November 2020 to
                                                                         assessed by measuring the ADC values of the pleural
undergo DWI-MRI of the chest. The most common pre-
                                                                         lesions.
senting symptoms were chest pain and dyspnea; other
symptoms such as cough and weight loss were less com-
                                                                         Qualitative assessment
mon, as shown in Table 1.
                                                                         Pleural diseases were analyzed for their type (fluid or
                                                                         soft tissue), morphological features (pleural thickening
Inclusion criteria                                                       classified as smooth and nodular), thickness (< 1 cm or
Patients with pleural thickening, pleural effusion, or                   > 1 cm), and extent as well as the relation to the adja-
pleural masses as identified on CT.                                      cent structures.
                                                                            Mediastinal and hilar lymph nodes > 10 mm in short-
                                                                         axis diameter were considered enlarged.
Exclusion criteria                                                          Each lesion signal intensity was judged on the T1, T2,
Patients having a contra-indication to MRI, e.g., pace-                  and STIR WI relative to muscles in the same pulse se-
makers, claustrophobia, cochlear implants, metallic for-                 quence. Qualitative assessment on DWI and ADC maps
eign bodies, or aneurysm clips.                                          was carried out by evaluating their signal intensity on
                                                                         the high b value (b = 1000 s/mm2) DWI and comparing
Table 1 Numbers and percentages of presenting clinical                   it to that on the corresponding ADC map.
symptoms                                                                    Documentation of any associated MR imaging findings
Symptoms                Number of patients                 Percentage    was also done.
Chest pain              27                                 47.4%
Dyspnea                 33                                 57.9%         Quantitative assessment
Cough                   12                                 21.1%
                                                                         To measure the ADC values, the ROI (region of interest)
                                                                         was placed in the center of the tumor or effusion being
Weight loss             8                                  14.1%
                                                                         kept as large as possible. In case of soft tissue lesions,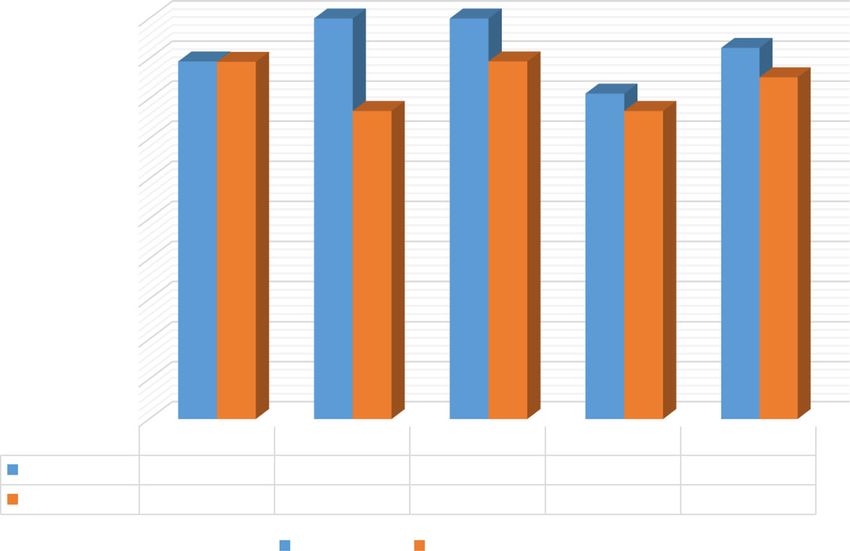
Sabri et al. Egyptian Journal of Radiology and Nuclear Medicine               (2021) 52:184                                                               Page 3 of 9

Table 2 MR imaging parameters
Sequence                              RT/ET         Direction of frequency               Section thickness          Slice gap          Field of view         Matrix
                                      (ms)          encoding                             (mm)                       (mm)               (mm)
Axial T1 WI (TSE)                     10/4.6        AP                                   9                          2                  420 × 325 × 306       212 ×
                                                                                                                                                             179
Coronal T1 WI (TSE)                   10/4.6        R/L                                  9                          1.5                425 × 425 × 208       284 ×
                                                                                                                                                             246
Axial T2 WI (TSE)                     738/100       AP                                   9                          2                  420 × 325 × 306       248 ×
                                                                                                                                                             167
Coronal T2 WI (TSE)                   738/100       R/L                                  9                          1.5                425 × 425 × 208       284 ×
                                                                                                                                                             246
Sagittal T2 WI (TSE)                  738/100       AP                                   8.5                        1                  400 × 299 × 284       268 ×
                                                                                                                                                             195
Axial STIR WI                         1788.3/20     AP                                   10                         2                  450 × 333 × 334       216 ×
                                                                                                                                                             161
DWI (SS-SE-EPI-with fat               Acquired in a transverse plane, using three b values; low (0–50 s/mm2), intermediate (500 s/mm2), and high b value
suppression)                          (1000 s/mm2)
                                      1407/66.5     AP                                   9                          2                  420 × 324 × 306       140 ×
                                                                                                                                                             107
TR repetition time, TE echo time, WI weighted image, TSE turbo spin echo, STIR short tau inversion recovery, R/L right to left, A/P antero-posterior, SS-SE-EPI single-
shot spin-echo echo-planar imaging

the ROI was placed within the most restricted areas.                                  unilateral effusion; 21 (52.5%) on the right side and 15
While in case of effusion, the ROI was positioned in the                              (37%.5) on the left side.
center of the effusion to avoid the possible magnetic sus-                               According to the cytology results, 14 (40%) patients
ceptibility artifacts from lung-fluid interfaces.                                     were diagnosed with malignant pleural effusion, while
                                                                                      the other 26 (60%) patients had benign pleural effusion.
Histopathological diagnosis                                                              Morphological assessment of pleural effusion was clas-
Our reference for diagnosis in all patients was histo-                                sified according to cross-sectional imaging into either
pathological analysis of ultrasound or CT-guided tissue                               free or encysted, where 20 (50%) patients showed free ef-
biopsies or aspiration cytology.                                                      fusion and 20 (50%) patients showed encysted effusion.
                                                                                         On correlating the morphological assessment with the
                                                                                      cytology results, 10 (50%) of the 20 patients showing
Statistical analysis                                                                  encysted effusion were found to have malignant effusion
Data were coded and entered using the statistical pack-                               and 10 (50%) had benign effusion. On the other hand,
age SPSS (Statistical Package for the Social Sciences)                                from the 20 patient with free effusion, 14 (70%) were be-
version 26 (IBM Corp., Armonk, NY, USA). Data was                                     nign and 6 (30%) were malignant (Fig. 1).
summarized using mean, standard deviation, median,                                       According to signal intensity analysis, in 39 (97.5%)
minimum, and maximum in quantitative data and using                                   patients, the fluid displayed low T1, bright T2, and STIR
frequency (count) and relative frequency (percentage)                                 signal intensities, while in the remaining one (2.5%) pa-
for categorical data. Comparisons between quantitative                                tient which had hemothorax, the fluid displayed high T1
variables were done using the non-parametric Mann-                                    and low T2 and STIR signals (Fig. 2).
Whitney test. ROC curve was constructed with area                                        Qualitative assessment of the DWI and ADC maps re-
under curve analysis performed to detect best cutoff                                  vealed that 39 (97.5%) patients with pleural effusion
value of ADC for detection of malignancy. P value less                                showed no evidence of diffusion restriction, whereas the
than 0.05 was considered as statistically significant.                                one (2.5%) patient diagnosed with empyema showed dif-
                                                                                      fusion restriction being bright on DWI with correspond-
Results                                                                               ing dark area on the ADC map (Fig. 3).
Thirty-six out of the 57 (63.2%) patients were males and                                 Pleural effusion ADC mean values ranged from 0.82 ×
21 (36.8%) were females. The encountered pleural diseases                             10−3 mm2/s to 4.83 × 10⁻³ mm2/s with average 3.35 ±
were subdivided according to lesions types based on their                             0.78× 10⁻³ mm2/s.
imaging findings; 40 patients showed pleural effusion and                                Malignant effusion ADC mean values ranged from
41 showed pleural thickening and neoplastic lesions.                                  2.09 × 10⁻³ mm2/s to 3.96 × 10⁻³ mm2/s with average
  From the 40 patients with pleural effusion, 4 (10%)                                 3.08 ± 0.55 × 10⁻³ mm2/s, while, benign effusion ADC
had bilateral effusion and 36 (90%) patients had
Sabri et al. Egyptian Journal of Radiology and Nuclear Medicine (2021) 52:184 Page 4 of 9 Fig. 1 a Axial T1 WI and b axial T2 WI showing right moderate pleural effusion eliciting low T1 and high T2 signal intensities. c DWI and d ADC map showing no evidence of diffusion restriction being bright on DWI and ADC map (ADC mean = 3.14 × 10⁻³ mm2/s). Ultrasound-guided aspiration cytology revealed malignant pleural effusion mean values were between 0.82 × 10⁻³ mm2/s and 4.83 From the 41 patients showing pleural thickening and × 10−3 mm2/s with average 3.5 ± 0.82 × 10⁻³ mm2/s. neoplastic lesions, 40 (97.6%) had unilateral lesions; 21 Hence, the ADC mean values of malignant pleural ef- (51.2%) on the right side and 19 (46.3%) on the left side. fusion were not significantly different from benign Patients were grouped according to histopathological pleural effusion (P = 0.09) making MRI unable to differ- diagnosis into benign pleural lesions and malignant entiate between them. pleural lesions. Fig. 2 a Axial T1 WI and b axial T2 WI showing left encysted pleural effusion displaying high T1 and T2 signal intensities. Associated finding of aortic intramural hematoma is noted eliciting high T1 and low T2 signal intensities. c DWI and d ADC map showing no evidence of diffusion restriction being bright on ADC map (ADC mean = 2.08 × 10⁻³ mm2/s). Ultrasound-guided aspiration cytology revealed blood cells (hemothorax)
Sabri et al. Egyptian Journal of Radiology and Nuclear Medicine    (2021) 52:184                                                     Page 5 of 9

 Fig. 3 a Axial T1 WI and b axial T2 WI showing a well-defined thick-walled multi-locular cystic lesion displaying low T1 and high T2 signal
 intensities. c DWI and d ADC map showing restricted diffusion, with the predominant bright areas on DWI corresponding to dark areas on the
 ADC map (ADC mean = 0.82 × 10⁻³ mm2/s). Ultrasound-guided aspiration cytology revealed pus cells (empyema)

  Thirteen (31.7%) out of the 41 patients had benign                        Comparing the imaging morphology of the pleural le-
pleural lesions; 1 (7.7%) patient had pleural lipoma, 2                   sions with their histopathological results, MRI was found
(15.4%) had calcified pleural plaques, and 10 (76.9) had                  to be able to discriminate benign from malignant lesions
benign pleural thickening, while 28 (68.3%) patients had                  by using morphological features (contour and thickness)
malignant pleural lesions; 7 (25%) patients were diag-                    with sensitivity 89.29%, specificity 76%, positive predict-
nosed with malignant pleural mesothelioma (Fig. 4) and                    ive value 89%, negative predictive value 76.92%, and ac-
21 (75%) with pleural metastasis (Fig. 5).                                curacy 85.37%.
  According to imaging findings, lesions were character-                    According to MRI signal intensity, 40 (97.6%) lesions
ized by morphology and signal intensity in conventional                   displayed low T1, while the remaining fat containing le-
sequences in addition to quantitative and qualitative as-                 sion (2.4%) showed high T1 signal.
sessment in DWI and ADC maps.                                               In the T2 sequence, 29 (70.7%) lesions elicited high
  Morphological assessment of the pleural lesions was                     signal and the other 12 (29.3%) lesions showed low sig-
based on their thickness (> 1 cm or < 1 cm) and contour                   nal, while in the STIR sequence, 28 (68.3%) lesions dis-
(smooth or nodular).                                                      played high signal and 13 (31.7%) showed low signal.
  Regarding pleural thickness, 28 (68.3%) lesions were >                    Qualitative assessment of the DWI and ADC maps
1 cm in maximum thickness and 13 (31.7%) lesions were                     identified 28 (68.3%) lesions showing diffusion restric-
< 1 cm.                                                                   tion being bright on DWI with corresponding dark area
  Nodular contour was also depicted in 28 (68.3%) le-                     on the ADC map, while 13 (31.7%) lesions did not show
sions, while 13 (31.7%) lesions showed smooth contour.                    restricted signal in DWI.
  Correlation between histopathological diagnosis and                       All 28 lesions with diffusion restriction were found to
imaging findings revealed that 10 (76.9%) lesions out of                  be malignant after reviewing their histopathology results,
the 13 lesions with thickness < 1 cm were found to be                     while the other 13 lesions which showed non-restricted
benign and 3 (23.1%) lesions were malignant. On the                       signal in DWI were benign.
other hand, from the 28 lesions with thickness > 1 cm,                      Pleural lesions ADC mean values ranged from 0.45 ×
25 (89.3%) were malignant and 3 (10.7%) were benign.                      10-3 mm2/s to 3.18 × 10⁻³ mm2/s with average 1.45 ±
  Similarly, 10 lesions out of the 13 (76.9%) lesions with                0.71× 10⁻³ mm2/s.
smooth countour were found to be benign in nature and                       The malignant pleural lesions showed ADC mean
3 (23.1%) lesions were malignant, while from the 28 le-                   values ranging from 0.45 × 10⁻³ mm2/s to 2.84 × 10⁻³
sions with nodular contour, 25 (89.3%) were malignant                     mm2/s with average 1.10 ± 0.53× 10⁻³ mm2/s, while be-
and 3 (10.7%) were benign.                                                nign lesions ADC mean values were between 1.80 × 10⁻³
Sabri et al. Egyptian Journal of Radiology and Nuclear Medicine (2021) 52:184 Page 6 of 9
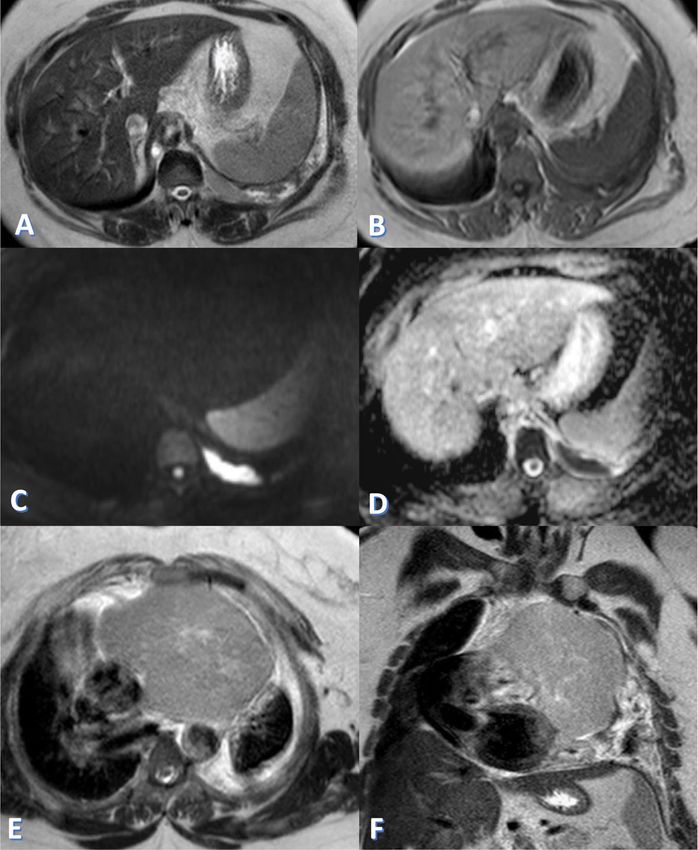
Fig. 4 a Axial T1 WI, b axial T2 WI, and e coronal T2 WI showing right circumferential nodular pleural thickening mounting to mass formation
eliciting heterogeneous predominately low T1 and high T2 signal intensities with evidence of chest wall and diaphragmatic invasion (white
arrows). c DWI and d ADC map showing restricted diffusion, with the bright signal on the DWI corresponding to dark signal on the ADC map
(ADC mean = 0.45 × 10⁻³ mm2/s). CT-guided biopsy revealed malignant pleural mesothelioma
mm2/s to 3.18 × 10⁻³ mm2/s with average 2.19 ± 0.42× The results of morphological and functional assess-
10−3 mm2/s. ment to differentiate benign from malignant pleural le-
The ADC mean values in patients diagnosed as malignant sions were compared and illustrated in details in Fig. 6.
pleural mesothelioma ranged from 0.45 × 10⁻³ mm2/s to Evaluating the associated lymph nodes in patients with
1.17 × 10⁻³ mm2/s with average 0.84 ± 0.22 × 10⁻³ mm2/s. malignant pleural mesothelioma showed that 5 patients
In patients diagnosed with pleural metastasis, the ADC had intra-thoracic lymph nodes; in 2 (40%) of them, the
mean values ranged from 0.50 × 10⁻³ mm2/s to 2.84 × lymph nodes were > 1 cm, while in the other 3 (60%),
10−3 mm2/s with average 1.19 ± 0.58 × 10⁻³ mm2/s. the lymph nodes were ≤ 1 cm and were considered as
Therefore, this study found that the ADC values of ma- reactive lymph nodes and not metastatic.
lignant pleural diseases were significantly lower than that However, all lymph nodes ≤ 1 cm and > 1 cm showed
of benign lesions (P < 0.001). However, the ADC mean restricted signal in DWI.
values of malignant pleural mesothelioma were not signifi- From the 7 patients diagnosed with malignant pleural
cantly different from that of pleural metastasis (P = 0.090). mesothelioma, associated osseous erosions were depicted
ROC curve analysis revealed that ADC mean value of in 2 patients, chest wall invasion in 3 patients and vascu-
1.68 × 10⁻³ mm2/s as a cutoff value can differentiate ma- lar invasion in 1 patient.
lignant from benign pleural diseases with sensitivity
89.3%, specificity 100%, positive predictive value 100%, Discussion
negative predictive value 81.2%, and accuracy 92.68% Functional MRI of the chest can differentiate malignant
with P value < 0.001 indicating high statistical from benign conditions by using ADC value as quantita-
significance. tive parameter of DWI [5]. One of the primarySabri et al. Egyptian Journal of Radiology and Nuclear Medicine (2021) 52:184 Page 7 of 9 Fig. 5 a Axial T2 WI and b axial T1 WI showing left focal nodular pleural thickening (red arrows) eliciting low T1 and high T2 signal intensities with left moderate pleural effusion eliciting heterogeneous low T1 and high T2 signal. c DWI and d ADC map showing restricted diffusion of the pleural thickening with the bright areas on the DWI corresponding to dark areas on the ADC map (red arrows), while the pleural effusion was non-restricted (pleural thickening and effusion showed ADC mean = 0.54 × 10⁻³ mm2/s and 3.07 × 10⁻³ mm2/s respectively). e Axial T2 and f coronal T2 WI, showed anterior mediastinal lesion. CT-guided biopsy revealed pleural metastasis from invasive thymoma and malignant pleural effusion advantages of DWI is the short examination time and typically elicits low T1 signal intensity and high T2 sig- the lack of need of contrast injection, so it can be added nal intensity, mirroring its water content. to the routine MRI sequences without a notable increase Regarding qualitative assessment of DWI, almost all in the exam duration [5]. We subdivided pleural lesions fluid showed no evidence of diffusion restriction with according to lesions type into either pleural effusion or average ADC mean value of 3.35 ± 0.78 × 10⁻³ mm2/s, pleural thickening and masses. We evaluated the con- which agrees with Usuda et al.’s [9] study where pleural ventional and functional MRI imaging findings of pleural effusion showed average ADC mean value of 3.76 ± 0.62 lesions and correlated them to their histopathological × 10−3 mm2/s. results. Also, quantitative assessment of the DWI and ADC Hallifax et al. [3] stated that various benign and malig- map recognized no significant difference between ADC nant conditions can involve the pleura with malignant mean values of malignant and benign effusion. In diseases being more common than benign; this matches consistency with our study, Usuda et al. [9] stated that the results of our study, where malignant lesions repre- there is no significant difference in ADC mean values of sented more than three quarters of the encountered fluid associated with malignant pleural mesothelioma, pleural lesions. pleural metastasis, and benign pleural effusion. Similarly, According to signal intensity, almost all the fluid dis- Karatag et al. [10] found no statistically significant re- played low T1, bright T2, and STIR signal intensities; sults to differentiate between inflammatory/infectious ef- likewise, Coolen et al. [4] established that pleural fluid fusion and malignant effusion.
Sabri et al. Egyptian Journal of Radiology and Nuclear Medicine     (2021) 52:184                                                     Page 8 of 9

 Fig. 6 A chart comparing the results of morphological and functional MRI assessment to differentiate benign from malignant pleural lesions

  Wherefore, both conventional and functional MRI                          to differentiate benign from malignant pleural diseases
could not differentiate between malignant and benign                       as they were the most common factors encountered in
effusion.                                                                  literature. Our study results advocated that morpho-
  In this study, only one patient was diagnosed with em-                   logical assessment using MRI can reliably discriminate
pyema where the fluid showed diffusion restriction being                   benign from malignant pleural lesions, with sensitivity
low on ADC map with ADC mean value of 0.82 × 10⁻³                          89.29%, specificity 76%, and accuracy 85.37%. In agree-
mm2/s which is much lower than ADC values of fluid                         ment with our study, Coolen et al. [11] used pleural
with either benign or malignant pleural effusion; this can                 thickening on MRI to discriminate benign from malig-
be explained by hyper-viscous pus content which hinder                     nant pleural lesions with sensitivity 81%, specificity 73%,
the diffusivity of water molecules. Due to limited num-                    and accuracy 78%.
ber of empyemas in our study, we could not repeat the                         All malignant lesions in our study showed diffusion re-
results from Usuda et al.’s [9] study which declared that                  striction, denoting their high cellularity with significantly
the ADC mean value of pleural fluid in empyema was                         lower average ADC mean value than benign lesions.
significantly lower than that in malignant pleural meso-                   Similarly, Inan et al. [14] found that the average ADC
thelioma (P = 0.0023), pleural metastasis (P = 0.0286),                    mean value of malignant pleural thickening to be signifi-
and benign pleural effusions (P = 0.0009).                                 cantly lower than benign thickening. Moreover, Koç
  Malignant pleural lesions were classified into malig-                    et al. [15] showed significant difference between the
nant pleural mesothelioma and pleural metastasis with                      average ADC mean value of benign and malignant
the latter being more common; this was compatible with                     pleural thickening.
Carter et al. [5] who claimed that the most common                            We noticed no significant difference between the aver-
cause of pleural malignancy is metastatic diseases                         age ADC mean value in patients with malignant pleural
followed by primary pleural tumors (e.g., malignant                        mesothelioma and in patients with pleural metastasis.
pleural mesothelioma).                                                     This was concordant with Usuda et al.’s [9] results.
  Regarding the morphological assessment of the pleural                       Coolen et al. [16] adopted ADC mean value of 1.52
lesions, Pena et al., Coolen et al., Hierholzer et al., and                ×10−3 mm2/s as a threshold to differentiate benign from
Leung et al. [1, 11–13] described several factors that can                 malignant pleural diseases, and showed sensitivity, speci-
help in differentiating benign from malignant pleural                      ficity, and accuracy of 71.4%, 100%, and 87.1%, respect-
diseases including pleural thickness, pleural contour, vol-                ively. Our results were more or less similar to this study,
ume of the involved hemi-thorax, and mediastinal or                        where an ADC mean value of 1.68 × 10⁻³ mm2/s was
diaphragmatic infiltration.                                                used as a cutoff value to differentiate malignant from be-
  In this study, pleural thickness (> 1 cm or < 1 cm) and                  nign pleural diseases with higher sensitivity 89.3% and
contour (smooth or nodular) were the two factors used                      accuracy 92.68% and similar specificity 100%.
Sabri et al. Egyptian Journal of Radiology and Nuclear Medicine                (2021) 52:184                                                             Page 9 of 9

   Consequently, adding DWI and ADC map to conven-                                   Author details
                                                                                     1
tional MRI sequences results in higher specificity and ac-                            Faculty of Medicine, Cairo University, Kasr Al-Ainy Faculty of Medicine,
                                                                                     Al-Manial, Cairo 11559, Egypt. 2National Cancer Institute, Kasr Al-Ainy Street,
curacy, yet with no difference regarding the sensitivity.                            Fom El-Kalig, Cairo 11796, Egypt. 3National Institute of Diabetes and
   Kruse et al. and Usuda et al. [2, 9] acknowledged one                             Endocrinology, 16 Kasr Al-Ainy Street, El-Sayeda Zainab, Cairo 11783, Egypt.
of the pitfalls of functional imaging being the false posi-
                                                                                     Received: 17 February 2021 Accepted: 8 July 2021
tive results in inflammatory processes, as it can be mis-
diagnosed as malignant pathology. Correspondingly, the
case of empyema in our study showed low ADC value of                                 References
                                                                                     1. Pena E, Ojiaku M, Inacio JR, Gupta A, Macdonald DB, Shabana W, Seely JM,
0.82 × 10⁻³ mm2/s which matched the ADC values of                                        Rybicki FJ, Dennie C, Thornhill RE (2017) Can CT and MR shape and textural
malignant lesions, yet it was diagnosed correctly by its                                 features differentiate benign versus malignant pleural lesions? Acad Radiol
morphology on the conventional MRI images.                                               24(10):1277–1287. https://doi.org/10.1016/j.acra.2017.03.006
                                                                                     2. Kruse M, Sherry SJ, Paidpally V, Mercier G, Subramaniam RM (2013) FDG
   Our study limitation is the relatively small number of                                PET/CT in the management of primary pleural tumors and pleural
cases, so we recommend further research on a larger                                      metastases. Am J Roentgenol 201(2):W215–W226. https://doi.org/10.2214/A
population to confirm our results.                                                       JR.13.10572
                                                                                     3. Hallifax RJ, Talwar A, Wrightson JM, Edey A, Gleeson FV (2017) State-of-the-
                                                                                         art: radiological investigation of pleural disease. Respir Med 124:88–99.
Conclusion                                                                               https://doi.org/10.1016/j.rmed.2017.02.013
                                                                                     4. Coolen J, Verschakelen J, De Wever W (2015) MRI of pleural diseases. Curr
In conclusion, although DWI-MRI is unable to differen-                                   Opin Pulm Med 21(4):399–406. https://doi.org/10.1097/MCP.
tiate between malignant and benign pleural effusion, its                                 0000000000000177
combined morphological and functional information                                    5. Carter BW, Betancourt SL, Shroff GS, Lichtenberger JP (2018) MR imaging of
                                                                                         pleural neoplasms. Top Magn Reson Imaging 27(2):73–82. https://doi.org/1
provide valid non-invasive method to accurately                                          0.1097/RMR.0000000000000162
characterize pleural soft tissue diseases differentiating                            6. Dhanda S, Thakur M, Kerkar R, Jagmohan P (2014) Diffusion-weighted
benign from malignant lesions with higher specificity                                    imaging of gynecologic tumors: diagnostic pearls and potential pitfalls.
                                                                                         Radiographics 34(5):1393–1416. https://doi.org/10.1148/rg.345130131
and accuracy than conventional MRI.                                                  7. Qayyum A (2009) Diffusion-weighted imaging in the abdomen and pelvis:
                                                                                         concepts and applications. Radiographics 29(6):1797–1810. https://doi.org/1
Abbreviations                                                                            0.1148/rg.296095521
ADC: Apparent diffusion coefficient; DWI: Diffusion-weighted images;                 8. Subhawong TK, Jacobs MA, Fayad LM (2014) Diffusion-weighted MR
ROI: Region of interest                                                                  imaging for characterizing musculoskeletal lesions. Radiographics 34(5):
                                                                                         1163–1177. https://doi.org/10.1148/rg.345140190
Acknowledgements                                                                     9. Usuda K, Iwai S, Funasaki A, Sekimura A, Motono N, Matoba M, Doai M,
Not applicable.                                                                          Yamada S, Ueda Y, Uramoto H (2019) Diffusion-weighted imaging can
                                                                                         differentiate between malignant and benign pleural diseases. Cancers 11(6):
Authors’ contributions                                                                   811. https://doi.org/10.3390/cancers11060811
LTE and MRA reviewed the images. YYS, LTE, and IHM analyzed and                      10. Karatag O, Alar T, Kosar S, Ocakoglu G, Yildiz Y, Gedik E, Gonlugur U,
interpreted the patient data. SFT wrote the manuscript and YYS reviewed it.              Ozdemir H (2015) Can diffusion weighted magnetic resonance imaging
All authors have read and approved the manuscript.                                       differentiate between inflammatory-infectious and malignant pleural
                                                                                         effusions? JBR–BTR 98(2):63–67
                                                                                     11. Coolen J, De Keyzer F, Nafteux P, De Wever W, Dooms C, Vansteenkiste J,
Funding                                                                                  Derweduwen A, Roebben I, Verbeken E, De Leyn P, Van Raemdonck D
The authors state that this work has not received any funding.                           (2015) Malignant pleural mesothelioma: visual assessment by using pleural
                                                                                         pointillism at diffusion-weighted MR imaging. Radiology 274(2):576–584.
Availability of data and materials                                                       https://doi.org/10.1148/radiol.14132111
The datasets used and/or analyzed during the current study are available             12. Hierholzer J, Luo L, Bittner RC, Stroszczynski C, Schoenfeld N, Dorow P,
from the corresponding author on reasonable request.                                     Loddenkemper R, Grassot A (2000) MRI and CT in the differential diagnosis
                                                                                         of pleural disease. Chest 118(3):604–609. https://doi.org/10.1378/chest.118.3.
Declarations                                                                             604
                                                                                     13. Leung AN, Müller NL, Miller RR (1990) CT in differential diagnosis of diffuse
Ethics approval and consent to participate                                               pleural disease. AJR 154(3):487–492. https://doi.org/10.2214/ajr.154.3.2106209
Approval of the ethical committee of the “Radiology department, Faculty of           14. İnan N, Arslan A, Akansel G, Arslan Z, Eleman L, Demirci A (2009) Diffusion-
Medicine, Cairo University” was granted before conducting this prospective               weighted MRI in the characterization of pleural effusions. Diagn Interv
study; reference number: not applicable.                                                 Radiol 15(1):13–18
Local institutional review board approval was granted before conducting this         15. Koç M, Poyraz AK (2017) The role of diffusion-weighted MR imaging in
cross sectional study, and written informed consent was obtained from all                detecting malignant and benign pleural thickening in asbestos-related
patients.                                                                                pleural diseases. Erciyes Med J/Erciyes Tip Dergisi 39(2):44–47
                                                                                     16. Coolen J, De Keyzer F, Nafteux P, De Wever W, Dooms C, Vansteenkiste J,
Consent for publication                                                                  Roebben I, Verbeken E, De Leyn P, Van Raemdonck D, Nackaerts K (2012)
All patients included in this research gave written informed consent to                  Malignant pleural disease: diagnosis by using diffusion-weighted and
publish the data contained within this study. If the patients were less than             dynamic contrast-enhanced MR imaging—initial experience. Radiology
16 years old, deceased, or unconscious when consent for publication was                  263(3):884–892. https://doi.org/10.1148/radiol.12110872
requested, written informed consent for the publication of this data was
given by their parents or legal guardians.                                           Publisher’s Note
                                                                                     Springer Nature remains neutral with regard to jurisdictional claims in
Competing interests                                                                  published maps and institutional affiliations.
The authors declare that they have no competing interests.
You can also read