ADVANCED TRACTOR-TRAILER EFFICIENCY TECHNOLOGY POTENTIAL IN THE 2020-2030 TIMEFRAME
←
→
Page content transcription
If your browser does not render page correctly, please read the page content below
WHITE PAPER                                             APRIL 2015

ADVANCED TRACTOR-TRAILER
EFFICIENCY TECHNOLOGY POTENTIAL
IN THE 2020-2030 TIMEFRAME
OSCAR DELGADO, NIC LUTSEY

                                                      www.theicct.org

                                           communications@theicct.org

  BERLIN    |   BRUSSELS    |   SAN FRANCISCO    |   WA S H I N G T O N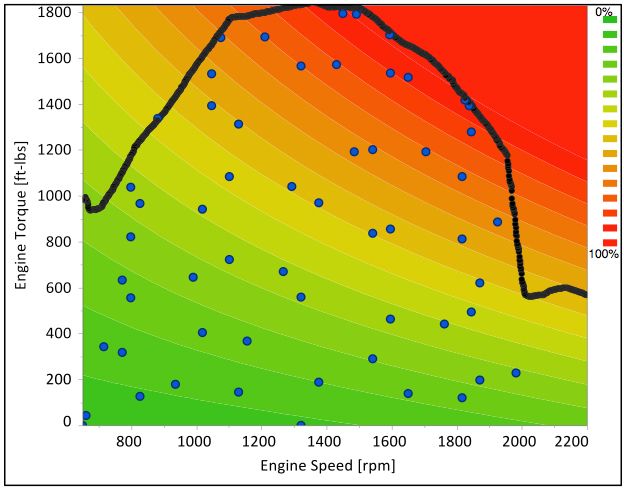
ACKNOWLEDGEMENTS
This project was supported by the ClimateWorks Foundation and the Energy Foundation.
The authors thank Arvind Thiruvengadam, Pragalath Thiruvengadam, Saroj Pradhan,
Marc Besch, and Daniel Carder at West Virginia University for their contributions to diesel
engine testing utilized in this project. The authors also thank Arvind Thiruvengadam, Marc
Besch, Nigel Clark, Ronald Graves, Rachel Muncrief, Ben Sharpe, Fanta Kamakaté, and
Drew Kodjak for their critical input and reviews of the report.

© 2014 International Council on Clean Transportation

1225 I Street NW, Suite 900, Washington DC 20005

www.theicct.org | communications@theicct.org
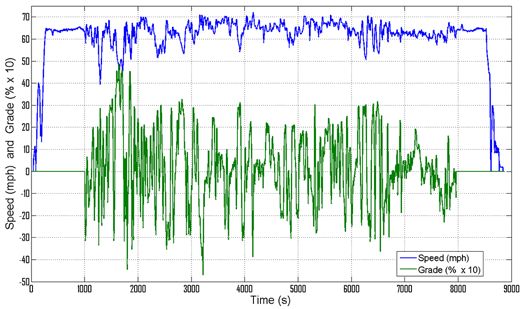
TABLE OF CONTENTS

Executive Summary.....................................................................................................................1

I. Introduction ............................................................................................................................4
    Background................................................................................................................................................. 4
    Overview...................................................................................................................................................... 8

II. Vehicle simulation modeling development..................................................................... 10
    Engine data and modeling.................................................................................................................. 10
           Engine fuel consumption maps ............................................................................................... 10
           Engine energy audit.......................................................................................................................12
    Autonomie-based tractor-trailer modeling...................................................................................15
           Engine technology..........................................................................................................................17
           Engine technology packages......................................................................................................21
           Transmission technology.............................................................................................................22
           Tractor-trailer technology...........................................................................................................24
           Summary calibration of baseline engine and tractor-trailer .........................................25
           Summary calibration of 2017 compliant engine and tractor-trailer ...........................29
    Advanced Truck Technology Efficiency Simulation Tool (ATTEST).....................................31
           Lumped parameter modeling development.........................................................................31
           Incorporation of individual technologies...............................................................................36
           Modeling technology package synergies .............................................................................37

III. Analysis of technology potential.....................................................................................42
    Individual technologies .......................................................................................................................42
    Technology package results.............................................................................................................. 44

IV. Conclusions ..........................................................................................................................51
    Tractor-trailer simulation modeling..................................................................................................51
    Advanced efficiency technology findings.....................................................................................52
    Policy discussion and recommendations......................................................................................55

References ................................................................................................................................58

                                                                                                                                                                 i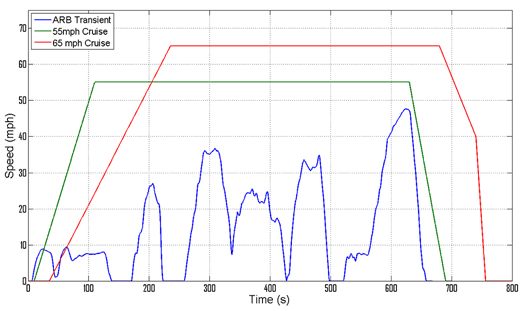
ICCT WHITE PAPER

LIST OF FIGURES
Figure ES-1. Potential fuel consumption reduction from selected tractor-trailer
efficiency technologies in the 2020-2030 timeframe over the HHDDT65 cycle.................... 2

Figure 1. Distribution of certified model year 2012-2014 heavy-duty on-road
diesel engines brake thermal efficiency (Based on US EPA, 2014a)............................................ 5

Figure 2. Average SmartWay carrier fuel economy (Based on US EPA, 2014b).................... 6

Figure 3. Stakeholder workshop findings regarding technologies’ percent
fuel consumption benefits in representative line-haul Class 8 trucks. ....................................... 8

Figure 4. Illustration of the relative fuel consumption rate for reference
2010 engine (Thiruvengadam et al, 2014) .............................................................................................11

Figure 5. Engine energy flows, fuel input, and brake-specific fuel efficiency.........................13

Figure 6. Energy distribution of reference and efficient engines over the SET cycle ........15

Figure 7. Vehicle propulsion architecture for Class 8 tractor-trailer in Autonomie..............16

Figure 8. Energy losses and loads for tractor-trailer from various sources............................29

Figure 9. Tractor-trailer duty cycles modeled in ATTEST and Autonomie.............................32

Figure 10. Percent energy audit of baseline tractor-trailer by ten energy
loss categories................................................................................................................................................33

Figure 11. Illustration of ATTEST model, highlighting structure, inputs, and outputs.........35

Figure 12. Comparison of technology packages in Autonomie and ATTEST........................38

Figure 13. Illustration of operational locus shift for tractor-trailer on three
drive cycles without and with engine downspeeding ................................................................... 40

Figure 14. Fuel consumption reduction as a function of vehicle, transmission,
and engine parameters (HHDDT65 cycle) ......................................................................................... 44

Figure 15. Braking losses as a percent of total fuel energy for different vehicle
road load reduction packages................................................................................................................. 49

Figure 16. Potential fuel consumption reduction from tractor-trailer efficiency
technologies in the 2020-2030 timeframe over the HHDDT65 cycle.......................................53

Figure 17. Potential fuel consumption reduction from tractor-trailer efficiency
technologies in the 2020-2030 timeframe over the real world highway cycle
with grade.........................................................................................................................................................53

Figure 18. Engine and non-engine related technology contribution to selected
tractor-trailer efficiency packages over the HHDDT65 cycle...................................................... 54

  ii
ADVANCED TRACTOR-TRAILER EFFICIENCY TECHNOLOGY POTENTIAL IN THE 2020-2030 TIMEFRAME

   LIST OF TABLES
   Table 1. Comparison of baseline tractor-trailers for this study and the US regulation...... 27

   Table 2. Comparison of 2017 tractor-trailers for this study and the US regulation............30

   Table 3. Performance criteria for tractor-trailer technology packages.................................... 41

   Table 4. Percent fuel consumption from efficiency technologies for 2015-2030
   Class 8 line-haul applications from 2010 baseline........................................................................... 42

   Table 5. Definitions for engine, transmission, and road load reduction technologies
   applied in efficiency technology packages........................................................................................ 45

   Table 6. Technology package fuel consumption results...............................................................46

   Table 7. Maximum feasible engine downsizing level for combinations of road
   load reduction and downspeeding levels. ..........................................................................................48

                                                                                                                                    iii
ICCT WHITE PAPER EXECUTIVE SUMMARY In the United States, combination tractor-trailers’ average fuel economy has remained at approximately six miles per gallon for nearly two decades. These tractor-trailers, though less than 2% of US vehicles, represent about 20% of on-road transportation oil use and climate emissions. The first phase of heavy-duty vehicle efficiency standards, adopted in 2011, require relatively modest improvements in tractor-trailer efficiency by model year 2017. With the US government set to establish new heavy-duty vehicle standards for 2020 and beyond, this research targets an improved understanding of how available and emerging advanced technologies might increase tractor-trailer efficiency for 2020 and beyond. The original research described in this report contributes to the dialogue on tractor-trailer efficiency in several ways. Foremost, this research incorporates a new 2010-emissions-compliant engine map and its detailed energy audit as the basis for the modeling of tractor-trailer technology. This work utilizes new engine map input data to augment the state-of-the-art Autonomie vehicle simulation model to assess how various efficiency technologies separately and cumulatively interact to impact tractor-trailer efficiency in line-haul applications. The modeling also evaluates emerging advanced integrated powertrain technologies that manufacturers and suppliers are developing, for example, engine downspeeding and downsizing with automated transmissions. Finally, this work also includes an evaluation of additional efficiency gains and interactions related to advanced vehicle load reduction technologies like aerodynamics, tires, and weight reduction. The findings indicate that there is the potential to substantially increase tractor-trailer efficiency. Figure ES-1 summarizes results on the efficiency potential of tractor-trailer technology packages in the 2020-2030 timeframe. The results shown in the figure are for the fuel consumption (in gallons of diesel fuel per ton of payload per 1000 miles traveled) in a Class 8 line-haul tractor-trailer with 19 tons of payload over the heavy heavy-duty diesel truck 65 miles-per-hour (HHDDT65) cycle. As shown, the reference 2010 tractor-trailer with 9.5 gal/1000 ton-mi, and 5.5 miles per gallon (mpg), could see substantially reduced fuel consumption. In descending order in the figure is a progres- sion of efficiency technology packages with increasingly advanced technology and reduced fuel consumption. Going beyond compliance with the adopted 2017 standards, integrated transmission technologies could increase efficiency to about 7 mpg. Load- reduction technologies—like mass reduction, aerodynamic and tire efficiency improve- ments in trailers—and integrated powertrains with downspeeding could further increase efficiency to about 8 mpg. Additional tractor-trailer load reduction, engine downsizing, and engine waste heat recovery could increase fuel efficiency well above 9 mpg. Long- term improvements in engine and vehicle, plus hybridization or road load management could increase tractor-trailer efficiency to above 11 mpg. 1
ADVANCED TRACTOR-TRAILER EFFICIENCY TECHNOLOGY POTENTIAL IN THE 2020-2030 TIMEFRAME

       5.5 mpg                                                    Reference 2010 tractor-trailer

                                                                  + Incremental engine efficiency
            6.0 mpg
                                                                    (2017 engine compliance)
                                                                  + Tractor road load technology
                  6.7 mpg
                                                                    (2017 tractor compliance)
                                                                  + Moderate integrated powertrain
                   6.9 mpg
                                                                    (Automated manual, 6x2)
                                                                  + Moderate tractor-trailer road load technology
                      7.3 mpg
                                                                    (-20% Cd aerodynamics, -16% Crr tires, -7% mass)
                                                                  + Advanced integrated powertrain
                          8.0 mpg
                                                                    ( 2020+ engine (48% BTE), dual-clutch)
                                                                  + Advanced tractor-trailer road load technology
                                8.9 mpg
                                                                    (-30% Cd aerodynamics, -30% Crr tires, -14% mass)
                                                                  + Engine downsizing
                                9.1 mpg
                                                                    (10%)
                                                                  + Engine waste heat recovery
                                 9.5 mpg
                                                                    (52% BTE)
                                                                  + Long-term tractor-trailer road load technology
                                       11.1 mpg
                                                                    (-50% Cd aerodynamics, -35% Crr tires, -17% mass)
                                                                  + Long-term engine technology
                                          12.0 mpg
                                                                    (55% BTE)
                                                                  + Hybrid system
                                          12.3 mpg
                                                                    (60% braking regeneration efficiency)
  10    9     8       7     6      5      4       3   2   1   0
            Fuel consumption (gal/1000 ton-mi)

   Figure ES-1. Potential fuel consumption reduction from selected tractor-trailer efficiency
   technologies in the 2020-2030 timeframe over the HHDDT65 cycle

   The findings from this analysis, in turn, point to several policy implications for the in-
   development US heavy-duty vehicle greenhouse gas emission and efficiency standards
   for 2020 and beyond.
   (1) Technology potential in the mid-term—The findings indicate that available tractor-
       trailer efficiency technologies can reduce fuel use per ton-mile by 39% from the
       baseline 2010 technology, and by 27% from 2017, the final year of the already
       adopted standards. Achieving these efficiency levels by 2024 would amount to over
       4%-per-year fuel consumption improvement for new tractor-trailers from 2017-2024.
   (2) Technology potential in the long-term—The findings indicate that technology
       packages with emerging load-reduction and powertrain technologies can achieve
       at least a 50% reduction from baseline 2010 technology, or about a 40% reduction
       from 2017, in the 2025-2030 timeframe. For the regulation to be technology-forcing,
       it would need to ensure these levels of fuel consumption reduction and it would
       be important that standards provide sufficiently long lead-time to promote all the
       promising advanced efficiency technologies, increase investment security, and help
       drive technology innovation.
   (3) Diverse technology approaches—Technology packages with advanced load-
       reduction and engine energy recovery approaches can achieve similar efficiency
       results, but do so with varying relative contributions from aerodynamic, powertrain,
       and other improvements. Regulations and the regulatory structure would ideally
       ensure that all available technologies from engines to trailers that are cost-effective
       are strongly promoted.

                                                                                                                       2
ICCT WHITE PAPER
(4) Engine efficiency potential—The analysis of technology packages indicates that
about one-third to one-half of the overall potential tractor-trailer efficiency benefits
come from engine efficiency improvements (from baseline 2010 technology).
Specifically looking at expected technology improvements from 2018-2030, the
analysis indicates that engine efficiency improvements would amount to up to a 13%
fuel consumption reduction by 2024 and 16% fuel consumption reduction over the
long term. Without sufficient engine-specific regulatory requirements, these engine
efficiency technologies appear unlikely to be commercialized in the 2030 timeframe.
(5) Regulatory procedure changes—The work suggests that several regulatory procedure
changes are warranted. For example, direct use of engine map data in regulatory
accounting of engine efficiency in integrated full-vehicle simulation is critical to ap-
propriately evaluate real-world tractor-trailer efficiency technologies. Also, inclusion of
grade in test cycles that better reflect real-world driving, streamlined procedures that
promote emerging integrated engine-powertrain options, and requirements for trailer
efficiency will all help promote applicable and promising technologies according to
their real-world benefits. Moreover, some accessory loads are not measured over the
engine dynamometer procedure. It is important that the simulation model provides
ways to promote technologies that reduce these accessory loads.
A number of research questions remains beyond the scope of this research. The research
is focused on efficiency advancement from a particular tractor-trailer in particular condi-
tions, but the methodology could flexibly be used to model technology improvements
from other baseline vehicle models, whole fleets of vehicles, and other duty cycles.
Another key question is how the modeling of the technology potential for tractor-trailers
would differ for other major vehicle markets that are on the verge of future standards, as
this would involve tailoring the work to their particular baseline fleet vehicle character-
istics. Another unexplored question relates to how the technology modeling approach
could be applied to other vehicle segments (e.g., delivery vans, medium-duty work
trucks, and buses). Also, this investigation of advanced efficiency technologies does
not assess the potential to simultaneously reduce local air pollutant emissions. Finally,
other questions that are beyond the scope of this work include assessment of the cost,
payback period, and relative cost-effectiveness of the various individual technologies.
The implications of the work are more widespread than the immediate US dialogue
toward 2020-and-beyond heavy-duty vehicle standards. Many countries are actively
investigating heavy-duty vehicle efficiency policy for their fleets. Similar to the US,
Japan, Canada, and China have already adopted some form of fuel efficiency or green-
house gas standard for heavy-duty vehicles and are working toward the next phase of
their regulations. Other areas, such as India, Brazil, Mexico, South Korea, and the Euro-
pean Union are also investigating new heavy-duty vehicle efficiency policies. The US is
poised to potentially stake a policy and technology leadership position on tractor-trailer
efficiency. Technology assessments like this that utilize state-of-the-art modeling tools
are a key input to these processes, helping to inform on the potential efficiency gains in
heavy-duty vehicles.
3ADVANCED TRACTOR-TRAILER EFFICIENCY TECHNOLOGY POTENTIAL IN THE 2020-2030 TIMEFRAME
I. INTRODUCTION
Diesel-fueled combination tractor-trailers are the prime freight movers for manufactured
goods throughout world economies. These vehicles have made many technical advances
over the years in safety and air quality-related emissions. However, until recent efficiency
regulations, relatively little had been done to increase their fuel economy. In the United
States tractor-trailers’ average fuel economy has remained at approximately six miles
per gallon (mpg) diesel for nearly two decades (Davis et al, 2013). Combination tractor-
trailers represent a relatively small count of vehicles (i.e., less than 2% of overall US
on-road vehicle sales and stock), but represent about 20% of all on-road transportation
oil use and climate emissions (US EIA, 2013). Tractor-trailers’ overall fuel consumption
was about 2 million barrels per day (mbd) in 2013 and is projected to grow to over 2.4
mbd by 2030, representing over two-thirds of heavy-duty vehicle fuel consumption (US
EIA, 2013). Tractor-trailers’ substantial contribution to oil use, their associated carbon
emissions, and their potential to increase efficiency with advanced technology each
make them a prime target for increased efficiency.
The 2011 adoption of heavy-duty vehicle efficiency and greenhouse gas (GHG) emission
standards by the US Environmental Protection Agency (US EPA) and the National
Highway Traffic Safety Administration (NHTSA) placed significant new requirements
on engine and truck manufacturers to increase the efficiency of their products through
2018. The initial standards provide a foundation and regulatory framework to categorize
vehicle types and account for varied technology improvements through a combination
of direct testing of engines and vehicle simulation modeling to account for the myriad of
vehicle permutations. Building on this first phase of standards, the federal government
has initiated proceedings for a proposed second phase of heavy-duty vehicle efficiency
standards for 2019 and beyond; the established rulemaking timetable includes proposed
standards in 2015 and finalized regulations in 2016 (White House, 2014).
Among the more critical questions for the “Phase 2” regulations are what emerging
efficiency technologies are available in the rule’s timeframe, how would the technologies
interact as integrated technology packages to deliver future efficiency gains, and how
adequately can the current test procedures account for their effectiveness. Another key
question is how much technology potential is available across the various component
parts of the tractor-trailer. For example, efficiency improvements from the engine,
transmission, low rolling resistance tires, and trailer aerodynamics could all potentially
play an important role in future trucks. This assessment seeks to help inform on technol-
ogy availability, technology effectiveness, and the relative impacts from tractor-trailer
areas using state-of-the-art vehicle simulation modeling. This study does not include
analysis regarding cost.
BACKGROUND
Leading up to the original US heavy-duty efficiency rulemaking, a number of technical
analyses informed on applicable technologies and their potential to reduce fuel con-
sumption in engines and vehicles. Most prominently, there were three studies—NESCCAF
(Cooper et al., 2009); TIAX (Kromer et al., 2009); and National Research Council (NRC,
2010)—that provided technology descriptions, estimations of technology-specific fuel
consumption reduction, and expert assessments on the viability of heavy-duty vehicle
technologies that could increase efficiency. These studies highlighted engine, transmis-
sion, and road load reduction technologies that were available and emerging primarily in
4ICCT WHITE PAPER
the 2010-2020 timeframe. Generally, these studies show how the Class 8 tractor-trailer
segment has the largest potential efficiency improvements among the heavy-duty
vehicle classes. The studies tend to show that Class 8 tractor-trailers have high potential,
of up to 30-40% fuel consumption reduction, from available low-cost technologies with
relatively quick payback periods.
The regulatory assessment by US EPA and NHTSA toward the 2014-2018 standards built
upon the technical work of the NESCCAF, TIAX, and NRC work with extensive com-
munication with vehicle manufacturers and technology suppliers. Ultimately, the new
standards would require a 6% reduction in heavy-duty diesel engine fuel use and an ap-
proximate overall 9-23% fuel consumption reduction from Class 7 and 8 tractor-trailers
(ICCT, 2012). The US EPA and NHTSA regulatory assessment indicates that probable
technology paths for compliance include the deployment of engine friction reduction,
combustion optimization, turbocharging system improvements, tractor aerodynamic
drag improvements, tractor tire rolling resistance improvements, a small amount of
tractor weight reduction, and idle reduction technology (US EPA and NHTSA, 2011b).
Although efficiency technologies were identified in areas of trailer aerodynamics, trailer
tires, advanced transmissions, and hybridization, the agencies did not target specific
reductions in these areas within the regulation.
Since the adoption of the first phase of standards, newly available data help provide the
full vehicle context on the baseline, fleet distribution, and trends in diesel engine and
tractor-trailer efficiency. Figure 1 shows the distribution of the brake thermal efficiency
(BTE) as evaluated at peak torque for certified diesel engines from model years 2012-
2014 of at least 400 horsepower. Diesel engines in long haul duty cycles tend to exhibit
relatively high efficiency due to sustained higher operational loads (e.g., consistent high-
way speeds of 60-65 miles per hour, with limited braking and acceleration). The peak
efficiency of heavy-duty engines in converting diesel fuel energy to engine brake power
is generally reported as approximately 42% (See, e.g., NRC, 2008, 2012). Recent diesel
engine certification data from US EPA indicates that diesel engines are incrementally
getting more efficient. As shown in the figure, the engine certification data, although not
sales-weighted, shifts from 2012, when the most prevalent engines achieved 41% BTE,
to 2014, when most engines are 43-44% BTE (based on US EPA, 2014a). Although the
efficiency data are shown for peak torque, highway driving torque demands are usually
lower than peak torque so actual operational BTE could be several percentage points
lower than BTE at peak torque.
60%
Percent of engines
40%
20%
0%
46%
MY2012 MY2013 MY2014
Figure 1. Distribution of certified model year 2012-2014 heavy-duty on-road diesel engines brake
thermal efficiency (Based on US EPA, 2014a)
5ADVANCED TRACTOR-TRAILER EFFICIENCY TECHNOLOGY POTENTIAL IN THE 2020-2030 TIMEFRAME
Along with the variation in diesel engine efficiency technology, there are also some
available data regarding the fuel efficiency of heavy-duty vehicles in the fleet. As cited
above from (Davis et al., 2013), the reported aggregated fuel economy of heavy-duty
vehicles is approximately 6 mpg. Data from US EPA (2014b) on SmartWay carriers’
fleets indicates the same approximate fleet-wide heavy-duty vehicle fuel economy,
and also shows the approximate range. Figure 2 shows the distribution of the average
company fuel economy for 2,393 participating SmartWay carrier companies. The data
shown in the figure excludes SmartWay’s multi-modal, logistics, expedited, and pack-
age delivery trucks in order to best approximate the US heavy-duty fleet as applicable
to this assessment on heavy-duty tractor-trailers. The harmonic average of the com-
panies’ average fuel economy is 6.0 mpg, and 93% of carriers are averaging between
5.2 and 6.8 mpg. Other corresponding average attributes for the same dataset on
companies’ carriers include 1,705 grams CO2 emissions per mile (gCO2/mile), average
payload of 18.4 tons, and 9.1 gallons of diesel consumed per 1000 ton-miles of freight
movement (gal/1,000 ton-mile). The fuel consumption metric (gal/1,000 ton-mile)
is more relevant for freight-moving vehicles due to its inclusion of payload in the
denominator, yet fuel economy in miles per gallon is reported in parallel in many places
in this report due its more common usage. These data, although they include a mix of
new and old trucks, provides broader context for real-world variation of heavy-duty
vehicle fuel efficiency in fleet operation.
800
Number of companies
600
400
200
0
4.4 4.8 5.2 5.6ICCT WHITE PAPER technologies are beginning to be commercialized (Bloch-Rubin and Gallo, 2014). Moreover, particular to trailer technologies, the adoption of technologies like those within the US SmartWay and California’s tractor-trailer GHG rule for aerodynamics and tire improvement have the potential to increase efficiency by 10-12% (Sharpe et al., 2014a). Simulation work for the Department of Energy on its SuperTruck technologies indicates the potential to deliver tractor-trailers that achieve over 10 miles per gallon (TA Engineering, 2011). In 2013-2014, the discussions among industry leaders have further improved the understanding about which technologies are available, which technologies are already being widely deployed or planned to be deployed within the next several years (i.e., within the 2014-2018 timeframe), and which technologies might have the greatest potential for widespread deployment for 2020 and later. A summary report to a recent industry and stakeholder workshop “Emerging Technologies for Heavy-Duty Vehicle Fuel Efficiency” highlighted the technologies, their estimated low and high fuel consumption potential in line-haul applications, and their expected applicability in the 2020-2030 timeframe. The workshop included presentations from Daimler, Volvo, Cummins, Eaton, Wabash, and SmartTruck and a presentation from US EPA and NHTSA on their approach to evaluate technologies in their regulatory development. A summary of the presentations and the technical exchange between the various suppliers, original equipment manufacturers, government officials, non-government organizations, and research groups provides an update on the “conventional wisdom” on potential tractor-trailer technologies (Lutsey et al., 2014). Figure 3 shows a summary of the findings from the July 2014 heavy-duty vehicle stakeholder workshop regarding potential fuel consumption reduction (from a 2010 baseline) for various efficiency technologies. The low and high error bars indicate the range of values from data sources and survey respondents. As shown in the figure, there are many technologies throughout the engine, transmission, and vehicle areas that offer substantial efficiency gains. Due to systems’ interactions, the fuel consump- tion benefits are not directly additive when more than one technology is applied. This study uses the technology list as a starting point for the modeling of tractor-trailer technologies. Also shown in the figure are expectations on technology timing. Ef- ficiency technologies that are expected to largely phase into the new heavy-duty fleet at greater than 50% penetration within Phase 1 (i.e., within the model year 2018 timeframe) are delineated in the chart from those with greater 2020-2030 potential (i.e., post 2018 potential). 7
ADVANCED TRACTOR-TRAILER EFFICIENCY TECHNOLOGY POTENTIAL IN THE 2020-2030 TIMEFRAME

                                                                Fuel consumption reduction in representative
                                                                   real-world line-haul highway operation

                                                           0%      2%       4%       6%      8%       10%      12%
                              Engine friction reduction
                               On-demand accessories
                             Combustion optimization
                                  Turbo improvements
   Engine

                                       Engine controls
                           Aftertreatment improvement
                                    Engine downsizing
                                   Turbocompounding
                                  Waste heat recovery
                                Transmission efficiency
   Transmission

                                 Single drive axle (6x2)
                     Automated manual (downspeeding)
                                             Stop-start
                       Dual clutch (adv. downspeeding)
                                                 Hybrid
                                      Tractor LRR tires
                                 Tractor aerodynamics
   Tractor-trailer

                                Automatic tire inflation
                                       Trailer LRR tires
                                     Weight reduction
                          Driver feedback/optimization
                              Idle reduction technology
                                  Trailer aerodynamics

                                                                High pre-2018 deployment       Post-2018 potential

    Figure 3. Stakeholder workshop findings regarding technologies’ percent fuel consumption benefits
    in representative line-haul Class 8 trucks.

    The stakeholder workshop reveals that, going beyond the Phase 1 US regulatory require-
    ments, fuel consumption reduction by as much as 15% from advanced engine technol-
    ogy, 8% from integrated engine-transmission approaches with downspeeding, and
    10-15% from trailer technologies appeared to be feasible in the 2020-2030 timeframe.
    One industry presenter remarked, “Our vehicle work and the engine work have given
    us a good foundation as we look to future efficiency improvements. When we think of
    future technologies, SuperTruck is our baseline.” One of the key workshop summary
    conclusions related to the importance of analyzing the technologies’ combined impact,
    as technology packages over relevant duty cycles, to better understand their interac-
    tions and synergies.

    OVERVIEW
    The primary objective of this report is to inform on the emerging technologies that are
    expected to be available to increase tractor-trailer efficiency in the new 2020-2030
    fleet. The scope of the work is to analyze diesel engine, transmission, aerodynamic, tire,
    and rolling resistance technologies that impact fuel consumption in line-haul heavy-duty
    Class 8 tractor-trailer applications and can potentially be promoted within US regulatory
    standards. Therefore, technologies introduced above are the primary focus, whereas
    technologies and fleet practices that relate to tractor-trailer driver behavior, operations,
    and logistics improvements are excluded. This study does not include analysis of the
    associated costs of the efficiency technologies.

                                                                                                                     8
ICCT WHITE PAPER This report is organized as follows. Following this introductory section, Section II describes the tractor-trailer simulation methodology, the data inputs, and the calibra- tion steps in the development of the tractor-trailer model. Section III builds from the development of the vehicle model to analyze the available and emerging technologies, including individually and as integrated to technology packages within tractor-trailers, and summarizes the results. Finally Section IV concludes with a summary of the findings, their potential implications, and policy recommendations. 9
ADVANCED TRACTOR-TRAILER EFFICIENCY TECHNOLOGY POTENTIAL IN THE 2020-2030 TIMEFRAME

   II. VEHICLE SIMULATION MODELING DEVELOPMENT
   This project entails the use of new engine dynamometer test data and tractor-trailer
   technology inputs to assess emerging efficiency improvements in a full vehicle simula-
   tion model. Vehicle simulation has become a dominant tool to design, engineer, analyze
   technology permutations, and now regulate heavy-duty vehicles. Vehicle simulation models
   like Powertrain Systems Analysis Toolkit (PSAT) and Autonomie (ANL, 2014) have been
   developed and used by university and industry research groups to assess diverse vehicle
   types on various drive cycles, as well as to estimate the effects of vehicle modifications on
   efficiency and emissions. These types of physics-based full-vehicle simulation modeling are
   widely recognized for their high value in assessing future technologies and their ability to
   incorporate complex technology interactions (see, e.g., NRC, 2010). Governments directly
   utilize heavy-duty vehicle simulation models in the development of regulations, and also as
   direct compliance tools within the regulations. Examples of government heavy-duty vehicle
   models are the US-based Greenhouse gas emission Model (GEM) and Europe’s Vehicle
   Energy Consumption calculation Tool (VECTO) (US EPA, 2011; Fontaras, 2013; JRC, 2014).

   This section describes the methodology, the data inputs, and the calibration steps in the
   development of a novel tractor-trailer simulation model. The section is separated into
   three parts: (1) engine data, maps, and modeling; (2) full-vehicle simulation modeling
   of tractor-trailer efficiency technologies with Autonomie; and (3) tractor-trailer fuel
   consumption with the ICCT’s Advanced Truck Technology Efficiency Simulation Tool
   (ATTEST), a lumped parameter tool.

   ENGINE DATA AND MODELING
   A fundamental energy input to a tractor-trailer simulation model is the engine fuel
   consumption data. The primary way that such engine data is summarized is in the form
   of “engine maps” that, generally, include tens (up to hundreds) of unique data points for
   engine fuel consumption rates (amount of fuel mass per unit time) across various op-
   erating points (i.e., varying engine torque and speed). Such fuel consumption rates are
   usually measured at steady-state conditions, so the maps may not accurately represent
   transient efficiency. The critical importance of these engine maps to understand and
   quantify the performance of various companies’ diesel engine technologies generally
   makes them proprietary and difficult to obtain.

   Few detailed data are publicly available to characterize modern diesel engine maps for
   line-haul tractor-trailer applications. The Autonomie vehicle simulation model (ANL,
   2014) has several illustrative diesel engine maps for its heavy-duty vehicle models that
   are based on pre-2010 model year (i.e. without selective catalytic reduction (SCR)
   systems) Caterpillar and Detroit Diesel engine data. The US EPA created the Greenhouse
   gas Emission Model (GEM) as a regulatory tool, and the model includes a generic
   default engine map, based on data from several engines, that represents a 15-liter, 455
   horsepower (hp) vehicle engine that complies with US model year 2010 engine emission
   standards (US EPA, 2012). In addition, there are proprietary engine models and engine
   maps that engineering consulting firms utilize in their research.

   Engine fuel consumption maps
   In order to better characterize a modern diesel engine map and its energy losses, the
   ICCT partnered with West Virginia University (WVU). This ICCT assessment utilizes the
   associated diesel engine data collection and engine mapping analysis that is reported

                                                                                             10
ICCT WHITE PAPER in the recent WVU report, Heavy-Duty Vehicle Diesel Engine Efficiency Evaluation and Energy Audit, by Thiruvengadam et al. (2014). That WVU work includes novel laboratory testing, data collection, and engine mapping of a model year 2011, 12.8-liter Mack MP-8 engine, rated at 505 horsepower. The 12.8-liter engine was the most applicable available engine and is broadly representative of new heavy-duty vehicle engines. The engine is in compliance with modern US 2010 criteria pollutant emission standards and therefore is consistent with the reference engine utilized for US EPA and NHTSA regulatory development for the model year 2014-2018 efficiency standards. In addition, the engine is a popular and representative Class 8 engine, based on Polk calendar year 2012 data (R.L. Polk & Co., 2012). The 12.8-liter engine is nearly equivalent to the median engine size of 13.0 liters for all engines in new US Class 8 vehicle registrations in calendar year 2012. The Mack MP-8 and the closely related Volvo D13 engine are the fifth and seventh most popular engines in all of Class 8 trucks. In addition the Volvo D13 is the dominant engine in the Volvo VNL, which is the Class 8 tractor with the second highest 2012 registrations. The MP-8 is the dominant engine in Mack’s highest-selling Class 8, the CXU600. The engine mapping testing procedure was performed on a 1065 CFR federal regulation- compliant engine dynamometer. In order to establish a reference engine with modern engine controls, exhaust gas recirculation, and aftertreatment systems, this research utilizes an engine that complies with model year 2010 US emission regulations. The after- treatment systems were installed and fully operational during testing. Figure 4 depicts the relative fuel consumption rate (fuel mass per unit time) at given engine torque and speed operating points of the 12.8-liter diesel engine. This figure shows the 53 data points from the laboratory testing under the darker maximum engine torque curve. The map illustrates the shape of the fuel consumption map through the various engine torque-speed points through a relative scale in which 100% (red) and 0% (green) represent maximum and minimum fuel consumption rate in grams per second units, respectively. Figure 4. Illustration of the relative fuel consumption rate for reference 2010 engine (Thiruvengadam et al, 2014) 11
ADVANCED TRACTOR-TRAILER EFFICIENCY TECHNOLOGY POTENTIAL IN THE 2020-2030 TIMEFRAME

   Engine energy audit
   Along with the reference 2010 engine fuel map, this study also utilizes the WVU Thiru-
   vengadam et al. (2014) analysis of the underlying energy flows and loss mechanisms
   across its full range of operation. The WVU work includes the collection of in-cylinder
   pressure data to estimate indicated power, motoring tests to measure engine friction,
   flow and temperature measurements of relevant streams including intake air, coolant,
   exhaust, fuel, turbocharging system, charge air cooler (CAC) and exhaust gas recircula-
   tion (EGR) cooler. Analysis of these engine data was utilized to provide a detailed
   breakdown of the energy loss mechanisms of the engine over various torque and speed
   operating points.

   Based upon WVU’s analysis of the various energy flows and losses through the engine,
   an “energy audit” was developed across the full engine map. Figure 5 shows the energy
   audit results in units of power (kW). Graphically these illustrate how the various energy
   loss mechanisms vary with respect to engine speed and torque output. As shown, brake
   work, exhaust enthalpy, cooling system, and pumping losses increase non-linearly with
   engine speed and torque. Engine friction and parasitic losses are found to increase with
   speed (but less so with torque). Ambient heat transfer is the only variable not analyzed
   directly, as it is based on the remaining loss mechanisms and the fuel energy input. Fuel
   energy input represents the steady-state fuel consumed at the various engine operating
   points, based on a lower heating value of 42.8 megajoule per kilogram diesel (MJ/kg)
   and a fuel density of 0.849 kilogram per liter (kg/L).

   As shown in Figure 5, the tested engine brake thermal efficiency (i.e., the bottom right
   panel), defined as brake power divided by fuel energy input, varies from approximately
   10-25% at low engine speeds and low torque, and up to 40% efficiency in its optimal
   operating region of engine speeds above 1000 rpm and torques above 1200 Nm.

                                                                                          12
ICCT WHITE PAPER
Brake Work Exhaust Enthalpy
600 500
400
400
Power (kW)
Power (kW)
300
200
200
100
0 0
2500 2500
2000 2000 2000 2000
1500 1500 1500 1500
1000 1000
1000 500 1000 500
500 0 500 0
Speed (RPM) Torque (N.m) Speed (RPM) Torque (N.m)
Cooling System Ambient Heat Transfer
300 80
60
200
Power (kW)
Power (kW)
40
20
100
0
0 -20
2500 2500
2000 2000 2000 2000
1500 1500 1500 1500
1000 1000
1000 500 1000 500
500 0 500 0
Speed (RPM) Torque (N.m) Speed (RPM) Torque (N.m)
Pumping Losses Friction and Parasitics
25 80
20
60
Power (kW)
Power (kW)
15
40
10
20
5
0 0
2500 2500
2000 2000 2000 2000
1500 1500 1500 1500
1000 1000
1000 500 1000 500
500 0 500 0
Speed (RPM) Torque (N.m) Speed (RPM) Torque (N.m)
Fuel Input Brake Thermal Efficiency
1500 50
40
1000
Power (kW)
30
BTE (%)
20
500
10
0 0
2500 2500
2000 2000 2000 2000
1500 1500 1500 1500
1000 1000
1000 1000 500
500
500 0 500 0
Speed (RPM) Torque (N.m) Speed (RPM) Torque (N.m)
Figure 5. Engine energy flows, fuel input, and brake-specific fuel efficiency
In addition to collecting detailed data on the reference diesel engine, the WVU study
assesses the potential for future engine technologies to reduce the energy losses
within the various energy loss mechanisms. Figure 6 illustrates the results from the
WVU reference 2010 engine and three other estimated advanced technology engines.
Examining the energy audit over the regulatory Supplemental Emissions Test (SET)
cycle, the reference heavy-duty diesel engine converts 39% of its fuel energy to brake
power, and it loses 36% as exhaust enthalpy, 17% through the cooling system (i.e.,
13ADVANCED TRACTOR-TRAILER EFFICIENCY TECHNOLOGY POTENTIAL IN THE 2020-2030 TIMEFRAME
coolant and intercooler), 3% as heat to the surrounding ambient air, 3% to friction of
engine components and parasitic loads, and 2% to engine pumping. WVU identified
several engine technologies and estimated their potential effects in the different
engine loss mechanisms. The “2017 engine” deploys several technologies to meet
the heavy-duty vehicle GHG engine standards and the “2020+ engine” utilizes more
advanced engine technologies. For further fuel consumption reduction, the effects of
a waste heat recovery (WHR) system were evaluated in the “2020+ with WHR” engine
map. The WVU engine estimations utilize a thermodynamic approach to project fuel
consumption of future engine technologies by reducing individual loss categories
by magnitudes identified by given technology pathways from the research literature.
The emerging technologies to achieve the increased efficiency include improvements
to combustion from increased compression ratio and peak in-cylinder pressures;
reduction in pumping losses through low-pressure drop aftertreatment systems, low
pressure drop EGR loops; reduced EGR; and improved turbocharging technology. The
reduction in frictional parasitic losses is from advanced lubricants, engine material
coatings that lower friction, and variable speed water and oil pumps. Finally, the
“2020+ engine with WHR” includes a simulation of an Organic Rankine Cycle (ORC)
WHR system. The aforementioned technologies were implemented by customizing the
reference 2010 map by scaling down the energy audit loss mechanisms using factors
from the available literature regarding their efficiency gains within each energy loss
mechanism. The process of scaling a base engine map to reflect improvements from
particular technologies differs from the actual engine calibration process in which the
fueling optimization is performed locally, rather than uniformly across the engines
speed and load domain. More sophisticated tools such as GT-Power can generate
higher fidelity maps and are being used by others (See, e.g., Reinhart, 2014). In this
work, the modeling and analysis here was designed to most closely match how
engine map data might be integrated into a potential regulatory engine testing-and-
simulation protocol (See further discussion from Sharpe et al, 2014b).
14ICCT WHITE PAPER
200
Heat Transfer to Ambient
Intercooler Energy Out
Energy distribution (kW-hr)
150 Friction and Pumping
Coolant Energy
Exhaust Enthalpy
100
50 Brake work
0
Mack MP8 2017 2020+ 2020+ with
reference WHR
Figure 6. Energy distribution of reference and efficient engines over the SET cycle
The advanced engine efficiency packages indicate significant reductions in energy
use over the SET cycle, as shown in Figure 6. The estimated 2017 engine technology
achieves a 7.9% fuel consumption reduction, the more advanced 2020+ engine achieves
18.3%, and the 2020+ with WHR achieves 21.5% fuel consumption reduction in compari-
son to the reference heavy-duty engine. The measured peak BTE of the 2010 engine
was 40%, while that of 2017 engine technology was projected to be about 44%, and that
of the 2020+ without waste heat recovery was projected to be about 49%. The waste
heat recovery simulation improved the BTE of the 2020+ technology to about 52%.
These average engine characteristics are noted here; the associated detailed engine fuel
consumption maps and energy audits across engine speed and torque for each engine
are utilized in the vehicle simulation modeling as described below.
AUTONOMIE-BASED TRACTOR-TRAILER MODELING
This research utilizes the Autonomie vehicle simulation platform to incorporate the
abovementioned reference engine data, to upgrade the model for modern heavy-duty
tractor-trailer characteristics, and to augment it to simulate additional efficiency tech-
nologies over various duty cycles. Many similar vehicle simulation models (e.g., PSAT,
CRUISE, ADVISOR, GT-Drive) have been developed. This work utilizes Autonomie (ANL,
2014), which was developed by Argonne National Laboratory, because it is state-of-the-
art as a vehicle modeling tool, has the necessary structure and features to rigorously
simulate emerging tractor-trailer efficiency technologies, is widely used by industry
and researchers, is commercially available, and is readily modifiable for researchers.
15ADVANCED TRACTOR-TRAILER EFFICIENCY TECHNOLOGY POTENTIAL IN THE 2020-2030 TIMEFRAME
Researchers have similarly demonstrated the suitability of Autonomie for modeling
heavy-duty vehicles (see Rousseau et al 2010; Delorme et al, 2010). In addition, the
Autonomie platform was chosen because it can be modified to closely align with the
technologies, options, and features of regulatory heavy-duty vehicle simulation models
like the US-based GEM (US EPA, 2011).
The overall Autonomie architecture involves a simulated driver model (which attempts
to follow a prescribed vehicle speed-time trace), the environment (that includes the
interface of the vehicle with atmospheric conditions), and a Vehicle Propulsion Control-
ler. The Vehicle Propulsion Controller handles the high-level control over the vehicle’s
shifting, propulsion and braking based on the speed and power demands imposed
by the test cycle. The vehicle architecture includes the powertrain systems and their
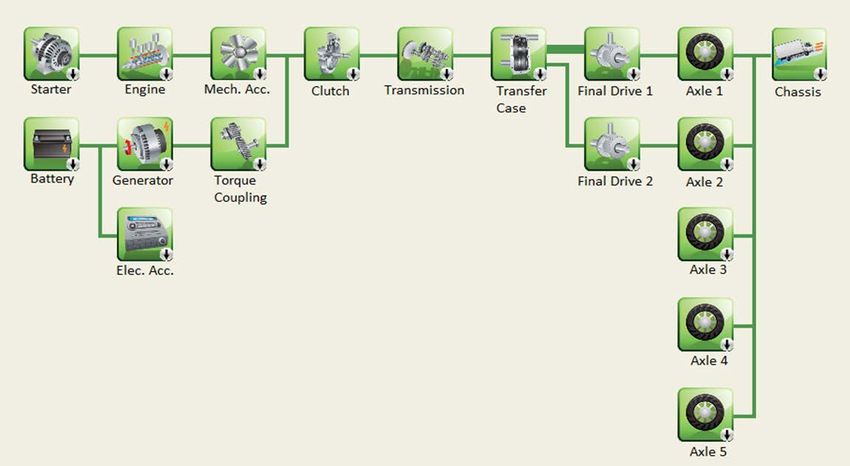
low-level controllers. Figure 7 shows the vehicle propulsion architecture for the Class 8
tractor-trailer selected for this study. As shown, the architecture includes modules for
the starter, the engine, mechanical accessories, electrical accessories, clutch, transmis-
sion, transfer case, and drive axles. The connections between components that are
shown depict the energy transfer interactions between the simulated components. For
further general details on the specific characteristics of the Autonomie model, please
refer to ANL (2014).
Figure 7. Vehicle propulsion architecture for Class 8 tractor-trailer in Autonomie
The Autonomie-based modeling effort for this project consists of augmenting the data
for many of the fundamental technology parameters that define tractor-trailers. No
structural changes to the architecture of the model or the driver parameters were made.
The “look-ahead” driver incorporates the future speed demand to determine the current
power demand to more closely follow the speed-time trace. The engine, transmis-
sion, driveline, aerodynamic load, tire rolling resistance, and vehicle mass areas were
supplemented and modified in order to model the baseline tractor-trailer. The following
sections describe these changes to define an updated reference tractor-trailer and ad-
ditional efficiency technologies that are modeled, compare the reference tractor-trailer
to other sources, and summarize baseline 2010 and 2017 tractor-trailer characteristics.
16ICCT WHITE PAPER Engine technology The first step in augmenting the Autonomie simulation model, to accommodate current and future tractor-trailer technologies for this project as introduced above, involves the introduction of a new reference engine. The default Autonomie model has several illustrative diesel engine maps for its heavy-duty vehicle models that are based on pre- 2010 model year from various engine manufacturers. Because of the fundamental engine and aftertreatment modifications required to meet model year 2010 and later US EPA emissions regulations, utilizing an updated EPA 2010-compliant engine for an engine map and its underlying energy loss mechanisms was deemed critical. From the WVU (i.e., Thiruvengadam et al., 2014) data collection on the model year 2011, 12.8-liter Mack MP-8 engine, an engine map was developed, processed, and introduced as a new engine option in Autonomie. Autonomie modeling tools were utilized to make the engine scalable in several dimensions. Recognizing the range in baseline BTE of heavy-duty diesel engines (i.e., generally from 41-44% for 2012-2014 engines, per US EPA [2014a] and Figure 1 above), the overall engine map fuel consumption was developed to be adaptable by the user. A scaling factor that shifts the engine’s fuel consumption several percent in either direction is seen as a valuable flexibility to tailor the baseline engine and any follow-on technology assessment (e.g., engine model-, model year-, company-, country-specific variations). In addition, the overall engine sizing can flexibly be modified for larger or smaller overall torque requirements allowing the analysis of engine downsizing effects. For this assessment of the efficiency potential for US tractor-trailers, we define the reference 2010 engine to have a 42.8% peak BTE for several reasons. Our general interest is in having the most relevant, post-2010 (i.e., with modern NOx and particulate controls) and pre-2014 GHG regulation baseline for new engine certification. This scaling indexes our reference engine to multiple sources. First, the scaling matches the 2012- 2014 certification baseline data mentioned above (US EPA, 2014a). Second, in regulatory documents in the initial GHG rulemaking, peak and cruise BTE values are approximately 42-44% (US EPA, 2011b). US DOE‘s 21st Century Truck and SuperTruck programs utilize 42% as a baseline (NRC, 2012; Delgado and Lutsey, 2014). Stanton (2013) indicates that a Cummins 15-liter engine operated at about 44% BTE at cruise. Based on all these engine data, the fuel consumption map from the WVU engine data is scaled, such that the peak BTE increases from 40.2% to 42.8%. The WVU laboratory data collection was performed on an engine with over 200,000 miles; the effects of age (e.g., engine, aftertreatment, heat exchanger), the exact fuel specifications, and other factors on the WVU results as compared to new certification engine data, are unknown. There is also further discussion of the baseline engine and tractor-trailer in the “Summary calibration of baseline engine and tractor-trailer” section (and in Table 1) below. In addition to introducing a new reference engine, many options for enhanced efficiency features are introduced into this study’s enhancements of the Autonomie model. The technologies are defined to match the most common understanding and common version of the technologies as described in other analyses and stakeholder discussions (e.g., US EPA and NHTSA, 2011b; NRC, 2010; Lutsey et al., 2014). Descriptions of the engine efficiency technologies, their energy loss mechanisms, and how they are handled in ICCT’s Autonomie modeling, are provided below. Engine friction reduction. Engine efficiency is affected by friction losses and lubricant oil churning in bearings, valve-trains, and piston-to-cylinder interfaces. As illustrated in 17
ADVANCED TRACTOR-TRAILER EFFICIENCY TECHNOLOGY POTENTIAL IN THE 2020-2030 TIMEFRAME

   Figure 5, friction losses increase with engine speed and, to a lesser degree, with cylinder
   pressure (i.e. torque). Lubricant oil viscosity is a key factor since it should guarantee
   proper lubrication and engine protection (durability) without sacrificing fuel economy.
   Friction reduction provides direct brake work gains. Since friction losses leave the
   engine in the form of heat, friction reduction also reduces the amount of heat dissipated
   through the cooling system. Available and emerging efficiency technologies to reduce
   these losses include piston ring designs, low viscosity lubricants, and low friction coat-
   ings and surface finish. Based on the stakeholder workshop input and research literature,
   this technology can reduce fuel consumption by 0.5% to 2% in line-haul applications.
   This technology is incorporated into Autonomie with customized engine maps, where
   engine friction energy loss is reduced by factor of 15% and 25% (based on Thiruveng-
   adam et al., 2014).

   On-demand engine accessories. Engine and vehicle accessories including the water
   pump, oil pump, fuel injection pump, air compressor, power steering, cooling fan,
   alternator, and air conditioning compressor are traditionally gear- or belt-driven by the
   engine. These “parasitic” losses, or auxiliary loads tend to increase with engine speed.
   Decoupling the accessories from the engine when their operation is not needed, and
   operating them at optimal speeds (i.e. exactly matching engine operational require-
   ments) can reduce these loads. Moreover, vehicle inertia (e.g., when going downhill) can
   be used to operate these devices and save fuel. Potential technologies include clutches
   to engage/disengage the accessories, variable speed electric motors, and variable flow
   pumps. Based on the stakeholder workshop input and research literature, this technol-
   ogy can reduce fuel consumption by 0.5% to 4% in line-haul applications. To incorporate
   this technology, customized engine maps are used, where the engine accessory loads
   are reduced by a constant factor of up to 10% (based on Thiruvengadam et al., 2014).
   Only oil and water pumps were part of the engine dynamometer setup, so the engine
   map only includes these two accessories. The unloaded air compressor was also part
   of the test and its losses were included in the engine friction loss mechanism. Other
   vehicle accessories can be separately incorporated in Autonomie as either electric or
   mechanical accessories. Inclusion of accessory loads in regulatory tests or simulations
   is necessary in order to appropriately recognize and promote fuel savings through
   accessory load reduction. For reference, Kies et al. (2013) analyzed options for integrat-
   ing fuel-saving technologies, including auxiliary systems such as engine cooling fan,
   air compressor, alternator, and steering pump, into the European Union CO2 reporting
   simulation tool VECTO. As discussed further below, the operation of accessory loads in
   regulatory tests, simulations, and the real world can differ and are an important aspect
   of evaluating the potential for fuel savings through accessory load reduction.

   Combustion system optimization. Optimization of diesel fuel combustion, with improved
   injection and high-pressure systems, is in active development. Most of the losses within
   an engine correspond to the combustion process and are reflected in high exhaust
   enthalpy and heat transfer to the cooling system. Combustion optimization improves
   the work extraction from the combustion process and thus reduces the exhaust and
   heat transfer losses. Potential technologies include optimized fuel injection (e.g., with
   higher pressures, injection rate shaping, better atomization and distribution within the
   cylinder), increased compression ratios, optimized combustion chambers, insulation of
   ports and manifolds, increased coolant operational temperature, and improved thermal
   management. Based on the stakeholder workshop input and research literature, this
   technology can reduce fuel consumption by 2% to 4% in line-haul applications. An ORNL

                                                                                           18
You can also read