AMYRIS, INC. INVESTOR PRESENTATION - March 2021 - Seeking Alpha
←
→
Page content transcription
If your browser does not render page correctly, please read the page content below
AMYRIS, INC.

INVESTOR PRESENTATION

March 2021
Investor Presentation | March 2021

         Forward-Looking Statements
         This presentation and oral statements accompanying this presentation contain forward-looking statements, and any statements other than statements of
         historical fact could be deemed to be forward-looking statements. These forward-looking statements include, among other things, statements regarding 2021
         financial guidance and outlook, goals and strategic priorities; and Amyris’s expectations regarding its development pipeline, planned product launches new
         markets and industries; and other future milestones such as pending and future strategic transactions, planned investments, expansion into other markets and
         industries, and the timing thereof. These statements are based on management’s current expectations and actual results and future events may differ
         materially due to risks and uncertainties, including risks related to Amyris’s liquidity and ability to fund operating and capital expenses, risks related to potential
         delays or failures in development, regulatory approval, production, launch and commercialization of products and brands, risks related to Amyris's reliance on
         third parties, and other risks detailed from time to time in filings Amyris makes with the Securities and Exchange Commission, including Annual Reports on
         Form 10-K, Quarterly Reports on Form 10-Q and Current Reports on Form 8-K. Amyris disclaims any obligation to update information contained in these
         forward-looking statements, whether as a result of new information, future events, or otherwise.

         NON-GAAP FINANCIAL INFORMATION
         To supplement Amyris’s financial results and guidance presented in accordance with U.S. generally accepted accounting principles (GAAP), Amyris uses non-
         GAAP financial measures that Amyris believes are helpful in understanding our financial results. These non-GAAP financial measures are among the factors
         management uses in planning and forecasting future periods. These non-GAAP financial measures also facilitate management’s internal comparisons to
         Amyris’s historical performance as well as comparisons to the operating results of other companies. Management believes these non-GAAP financial
         measures, when considered together with financial information prepared in accordance with GAAP, can enhance investors’ and analysts’ abilities to
         meaningfully compare our results from period to period, identify operating trends in our business, and track and model our financial performance. In addition,
         management believes that these non-GAAP financial measures allow for greater transparency into the indicators used by management to understand and
         evaluate Amyris’s business and make operating decisions. Non-GAAP financial information is not prepared under a comprehensive set of accounting rules, and
         therefore, should only be read in conjunction with financial information reported under GAAP in order to understand Amyris’s operating performance. A
         reconciliation of the non-GAAP financial measures in this presentation to the most directly comparable GAAP financial measure, is provided in the tables
         attached to this presentation.

         Totals in this presentation may not foot due to rounding.

© 2021 Amyris, Inc. All Rights Reserved.                                                                                                                                           | Page 2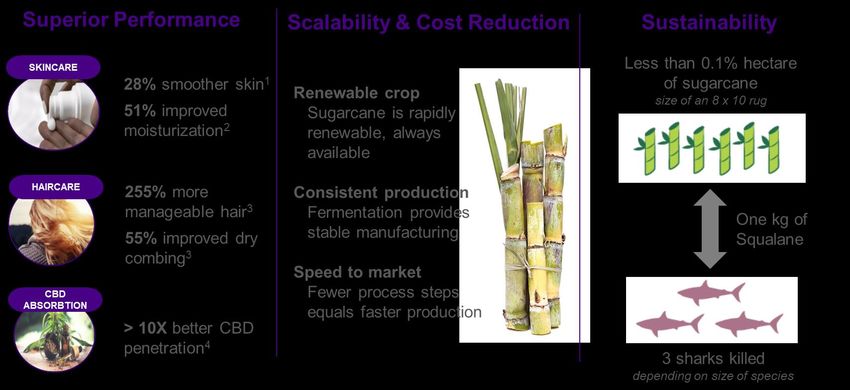
Investor Presentation | March 2021

        Agenda
                                           John Melo
                                           President and Chief Executive Officer

      1               Amyris Overview

      2               Business Model
                                           Han Kieftenbeld
                                           Chief Financial Officer

      3               2021 Outlook

      4               Q&A

© 2021 Amyris, Inc. All Rights Reserved.                                                                    | Page 3
Investor Presentation | March 2021

        We Are Delivering On The Promise of Synthetic Biology

Our proprietary Lab-to-Market              Our Ingredients Pipeline delivers   Our Consumer Brands deliver on
operating system delivers                  unique natural, sustainably         the No Compromise® promise for
predictable commercialization,             sourced, platform molecules that    health, clean beauty and personal
significant cost reduction and fast        disrupt markets and enable the      care products that make people
time-to-market                             ESG agenda of industry leaders      and our planet healthier

© 2021 Amyris, Inc. All Rights Reserved.                                                                           | Page 4
Investor Presentation | March 2021

      2020: Year of Execution and Transformation

        • Accelerated product revenue growth with 3 consecutive quarters of record revenue. Delivered
              ~200% Consumer revenue growth with enhanced product gross margins

        • Achieved positive Q4 adjusted EBITDA

        • Delivered 6 new ingredients at scale versus target of 2-3

        • Successfully completed $200m equity financing

        • Reduced debt from $297m to below $150m as of March 1, 2021

        • Announced strategic transactions in Q4 evidencing value of technology platform and creating
              clear path to self-sustaining cash flow. Closed first strategic transaction in Q4 2020

© 2021 Amyris, Inc. All Rights Reserved.                                                          Page 5
                                                                                                                          | Page 5
Investor Presentation | March 2021

       Industry-Leading Growth Driven By Consumer Megatrends

          FY Underlying Sales Revenue                              High growth, wholly-owned consumer brands
                 by Category
                                                                                                                                    Q4 YoY       FY YoY
                             13%                                                                                                    Growth       Growth

                                                                                                                                    +161%     +197%
                              Sales             40%                Clean skincare
                                                                    Biossance®
                                                                                     Baby & Personal care
                                                                                          Pipette®
                                                                                                            Alternative Sweetener
                                                                                                                 Purecane™
                             Revenue1
                    47%                                            Functional natural ingredients delivering performance and sustainability

                                                                                                                                     Q4 YoY      FY YoY
                  Consumer                                                                                                           Growth      Growth
                  Ingredients
                  Collaboration & Grants
                                                                       Flavors &
                                                                     Fragrance for
                                                                                         Alternative
                                                                                        Sweetener for
                                                                                                            Clean Beauty for
                                                                                                               Cosmetics
                                                                                                                                    +29%       +26%
                                                                       Home and        Food & Beverage
   1Based on preliminary unaudited FY 2020 performance excluding     Personal Care
   one-off & Lavvan

© 2021 Amyris, Inc. All Rights Reserved.                                                                                                       Page 6
                                                                                                                                                                       | Page 6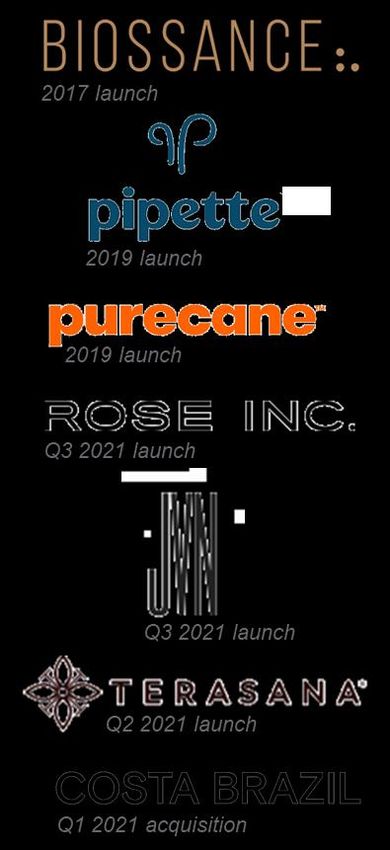
Virtual Investor Mini-Series | December 15, 2020
    Investor Presentation | March 2021

                                                              Automated
                                                                Strain
                                                              Engineering

                                                                                             High-
                                            Automated
                                                                                          throughput
                                             Design
  Our proprietary                                                                          screening

  Lab-to-Market operating system
  optimizes learning cycles,                                 Data capture,
                                                           machine learning,
  accelerates our time to market,                          human intelligence
  improves our predictive success
  and reduces cost                           Process
                                           development/                                  Fermentation
                                           Manufacturing

                                                               Analytics

©
© 2020
  2021 Amyris,
       Amyris, Inc.
               Inc. All
                    All Rights
                        Rights Reserved.
                               Reserved.                                                                               | Page 7
Investor Presentation | March 2021

      Digitized Development Accelerates Time to Market

                                                                       >2
                   2012 vs 2020            1 strain constructed     Ingredients
                   Performance             every 42 seconds       commercialized
                                                                     per year
            90% Lower average
       product development cost

                                           100x throughput
              80% decreased                                              915 US and
                                             increase from
        average time to market                                          foreign patents
                                              automated
                                                                          issued and
                                            sample handling
             500% higher R&D                                             applications
                                               and data
                    productivity                                            pending
                                              processing

© 2021 Amyris, Inc. All Rights Reserved.                                                                           | Page 8
Investor Presentation | March 2021

       Our Proprietary Lab-to-Market Process Disrupts and Delivers
       Leading synthetic biology platform delivering unique ingredients from most sustainable sources

                          5                     8       10                                    8                8-10

                   2010-2015
                                            2016-2020
                                                        2021-2023
                     Clean Beauty
                     Health & Wellness
                     Flavor & Fragrance
                     Various End-markets                                         2024-2025                      Discovery

                           13 ingredients in market           18 ingredients in development

© 2021 Amyris, Inc. All Rights Reserved.                                                                                   | Page 9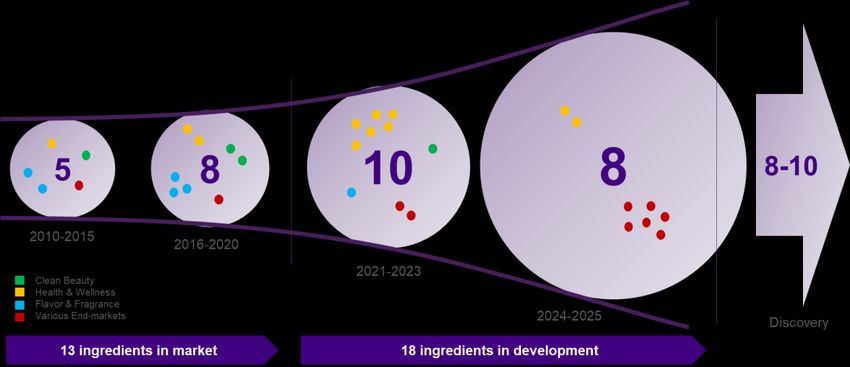
Investor Presentation | March 2021

      Global Beauty And Personal Care Market Growing >7% Per Year

                                                                                                                                                 Share of Global Market:
            Beauty and Personal
                                                                                                                                                  U.S. 20%, China 13%
             Care Market Value
                Worldwide

                                                                                                        North America                                  Western
                                                                                                             24%                                       Europe
                                                                                                                                                        19%

  $420B
           2018
                                           $716B
                                                  2025                                                                                                                     Asia Pacific
                                                                                                                                                  Africa                      46%
                                                                                                                                                   3%
                                                                                                                     Latin
                                                                                                                    America
                                                                                                                      8%

                                           >7%           Sources: Reuters (2019), L’Oreal (2020), Statista (2020), Forbes (2019), Euromonitor (2017)
© 2021 Amyris, Inc. All Rights Reserved.                                                                                                                         Page 10
                                           CAGR                                                                                                                                          | Page 10
Investor Presentation | March 2021
Amyris Products Target 80% of Global Beauty and Personal Care Market
Global Beauty and Personal Care
By Category Clean skincare
2017 launch
20%
Clean baby & family care
30%
2019 launch
Skincare
2% Clean Beauty is
Haircare
Color cosmetics
growing at nearly
Clean color cosmetics
4% Bath & shower Q3 2021 launch
Babycare double the rate of the
Suncare
10% Other rest of beauty
Clean haircare
18%
16% Q3 2021 launch
Acne and other treatment
Q2 2021 launch focused skincare
Sources: Reuters (2019), L’Oreal (2020), Statista (2020), Forbes (2019), Euromonitor (2017), Clean luxury skincare
McKinsey & Company (2019) Q1 2021 acquisition
Clean Beauty CAGR from Brandessence Market Research (2021)
© 2021 Amyris, Inc. All Rights Reserved. Page 11
CAGR | Page 11Investor Presentation | March 2021
Our No Compromise® Natural Ingredients are Powering our Brands
High growth wholly-
owned consumer brands Our ingredients
are building
Alternative Sweetener Clean skincare Baby & Mothercare blocks for our
PurecaneTM Biossance® Pipette®
consumer brands
formulations
Functional natural
ingredients delivering
performance and
sustainability
Flavors & Alternative Clean Beauty for
Fragrance for Sweetener for Cosmetics
Home and Food & Beverage
Personal Care
© 2021 Amyris, Inc. All Rights Reserved. | Page 12Investor Presentation | March 2021
Squalane: Superior Moisturizer and Carrier
Traditionally sourced Makes formulations perform better
from shark liver
Millions of sharks killed
annually
1. After 4 weeks compared to control formulation. Clinical study performed on 30 women, ages 40-60
2. 1 hour after application. Clinical study performed on 30 women ages 40-60
3. Compared to control formulation
© 2021 Amyris, Inc. All Rights Reserved. 4. Better than Jojoba, Sunflower, CCT, and Hemp Seed Oil. Using 1% CBD EpiSkin -24 hours | Page 13Investor Presentation | March 2021
Consumer Portfolio Growth Opportunities
The Amyris Brand • New brand launches: color cosmetics with Rose Inc., haircare with JVN,
Differentiator treatment focused skincare with Terasana, and luxury skincare with Costa
Brazil. Each of these brands are scheduled to be launched in 2021
• Product line extensions: adding new and novel formulations to existing
Leading science-to-consumer brands on an ongoing basis. Addressing real-time issues such as “maskne”
capability
• Channel expansion: continue to expand consumer outreach in both offline
(brick and mortar) and online (ecommerce) channels
High performing products • Geographic expansion: extending global reach in UK, Europe, Middle East,
Asia Pacific and Latin America. Strategic partnership with SuperOrdinary to
enter China market
Natural ingredients,
sustainably sourced $1 Importance of Beauty and Personal Care products that are clean 1 0.2 5
$1
$1 0.2
$1
$1 0.1 5
90%
$1
$0
72% 83% 71%
0.1
$0
$0
64% 56% 0.0 5
$0
$0 0
Global USA UK France Germany China
1 Source: AlixPartners Global Health and Wellness study (2018) Page 14
© 2021 Amyris, Inc. All Rights Reserved. | Page 14Investor Presentation | March 2021
Q4 2020 and Full Year Key Financials
Underlying Total Gross Margin $m Cash Operating Expense $m Adjusted EBITDA $m
Sales Revenue1 $m GM% 56% 66% 56% 56% Positive
$20 ,000
EBITDA 0.2 5
$14 0,000
+51% 0.2 5
$12 0,000 0.2 5
$20 0,000
-1%
0.2 5
1 +8%
+13% $18 0,000 $0
$12 0,000
$10 0,000 0.2
0.2
0.2
$16 0,000 0.2
($20,0 00)
(25)
$10 0,000
$14 0,000
$80 ,000
0.1 5
0.1 5 ($40,0 00)
0.1 5 $12 0,000 0.1 5
$80 ,000
$60 ,000
+134% $10 0,000
(103) (95)
128 182 181 ($60,0 00)
96
$60 ,000
0.1
+58% 0.1
86
0.1
$80 ,000 0.1
$40 ,000
+10%
$40 ,000
85 $60 ,000
($80,0 00)
0.0 5
$20 ,000
53 0.0 5
$40 ,000 0.0 5
0.0 5
40
($100, 000)
50
$20 ,000
25 23 $20 ,000
46
($120, 000) 0
$0 0
$0 0 $0 0
Q4 2019 Q4 2020 Total Yr Total Yr Q4 2019 Q4 2020 Total Yr Total Yr Q4 2019 Q4 2020 Total Yr Total Yr Q4 2019 Q4 2020 Total Yr Total Yr
2019 2020 2019 2020 2019 2020 2019 2020
1 Underlying total sales revenue as defined on previous page
Full Year 2020 Sales Revenue Gross Margin Operating Expense Adjusted EBITDA Total Debt
Takeaways UP UP DOWN UP DOWN
© 2021 Amyris, Inc. All Rights Reserved. | Page 15Investor Presentation | March 2021
2021 Full Year Outlook
• Underlying total revenue (Product, Collaboration & Grants) expected to be in the $240m range.
Reported total revenue expected to be around $400m when including potential strategic transactions
• Phasing of Underlying total revenue expected to be 35% H1 and 65% H2 to reflect a continued
quarter-on-quarter growth trajectory and the addition of new brands
• Debt per end of 2020 of $171m reduced below $150m by March 1, 2021. Expected to reduce further to
below $100m by Q3 2021
• Strategic transactions expected to be mostly accretive to revenue and earnings resulting in positive
full year adjusted EBITDA. The company may update its full year 2021 outlook following completion
of the strategic transactions
2021 Outlook as of Q4 and FY 2020 earnings call on March 2, 2021
© 2021 Amyris, Inc. All Rights Reserved. Page 16
| Page 16Investor Presentation | March 2021
We Deliver on The Promise of Synthetic Biology
• Leading Synthetic Biology platform: fast, cost-effective and
sustainable approach using innovative and disruptive chemistry
to commercialize products
• Delivering industry-leading growth: in fast-growing and
attractive Health, Beauty and Wellness markets driven by
consumer preferences for clean, safe and sustainable
• Investing in the future: balancing continued growth and
optimization of portfolio with new science-driven opportunities to
make our planet healthier
• Long-term approach to shareholder value: establishing the
foundation for profitable growth, cash generation and self-
funding
© 2021 Amyris, Inc. All Rights Reserved. | Page 17Investor Presentation | March 2021
Q4 and FY 2020 GAAP to Non-GAAP Reconciliations
Sales Revenue Breakdown GAAP to Non-GAAP Gross Profit and Gross Margin
Three Months Ended Twelve Months Ended Three Months Ended
December 31, December 31, December 31, Year Ended December 31,
(In millions) 2020 2019 2020 2019 (In thousands) 2020 2019 2020 2019
Revenue: Revenue (GAAP and non-GAAP) $ 79,744 $ 40,536 $ 173,137 $ 152,557
Renewable products $ 33.7 $ 18.5 $ 104.3 $ 59.9
Licenses and royalties 41.3 10.7 51.0 54.0 Cost of products sold (GAAP) $ 27,102 $ 22,703 $ 87,812 $ 76,185
Grants and collaborations 4.7 11.4 17.8 38.6 Other costs/provisions (1,190) (1,972) (10,128) (5,895)
Total revenue $ 79.7 $ 40.5 $ 173.1 $ 152.6 Inventory lower-of-cost-or-net realizable value adjustment
1,556 (2,872) 1,182 (1,476)
Excess capacity (284) 275 (855) (1,155)
Stock-based compensation expense (61) - (112) -
Depreciation and amortization (393) (258) (1,239) (753)
Three Months Ended Twelve Months Ended
Cost of products sold (non-GAAP) $ 26,730 $ 17,876 $ 76,660 $ 66,906
December 31, December 31,
(In millions) 2020 2019 2020 2019
Adjusted gross profit (non-GAAP) $ 53,014 $ 22,660 $ 96,477 $ 85,651
Consumer 17.3 6.6 51.6 17.4
Ingredients 17.7 13.8 60.0 47.5 Gross margin % 66% 56% 56% 56%
Product $ 35.0 $ 20.4 $ 111.6 $ 64.9
Collaborations & Grants 4.7 4.8 16.7 20.3
Underlying Total $ 39.7 $ 25.2 $ 128.3 $ 85.2
1
Other -- 15.4 44.8 67.4
Reported Total $ 79.7 $ 40.5 $ 173.1 $ 152.6
1 Incl one-off Vitamin E transaction & 2019 Lavvan collaboration revenue
© 2021 Amyris, Inc. All Rights Reserved. | Page 19Investor Presentation | March 2021
Q4 and FY 2020 GAAP to Non-GAAP Reconciliations
GAAP to Non-GAAP Net Income (Loss) and EPS
Three Months Ended
December 31, Year Ended December 31,
(In thousands, except per share data) 2020 2019 2020 2019
Net loss attributable to Amyris, Inc. common stockholders - Basic (GAAP) $ (108,759) $ (77,433) $ (382,311) $ (270,351)
Non-GAAP adjustments:
Stock-based compensation expense 3,888 2,493 13,743 12,554
(Gain) loss from change in fair value of derivative instruments 4,864 (5,214) 11,362 (2,777)
GAAP to Non-GAAP Operating Expense (Gain) loss from change in fair value of debt
Loss upon extinguishment of debt
92,735
-
740
35,612
89,827
51,954
19,369
44,208
Three Months Ended Income attributable to noncontrolling interest 356 - 4,165 -
December 31, Year Ended December 31, Deemed dividend upon conversion of Series E preferred stock into common stock - - 67,151 -
2020 2019 2020 2019 Deemed dividend to preferred stockholder on issuance and modification of common
(In thousands)
stock warrants - - - 34,964
Loss allocated to participating securities (858) (1,441) (15,879) (7,380)
Research and development expense (GAAP) $ 19,388 $ 15,367 $ 71,676 $ 71,460 Contract asset credit loss reserve - - 8,399 -
Stock-based compensation expense (1,096) (898) (3,871) (2,900) Inventory lower-of-cost-or-net realizable value adjustment (1,556) 2,872 (1,182) 1,476
Depreciation and amortization (1,279) (1,330) (5,042) (2,670) Other (income) expense, net, and loss from investment in affiliate 2,459 1,703 2,065 783
Research and development expense (non-GAAP) $ 17,013 $ 13,139 $ 62,763 $ 65,890 Adjusted net loss attributable to Amyris, Inc. common stockholders - Basic
(non-GAAP) $ (6,871) $ (40,668) $ (150,706) $ (167,154)
Sales, general and administrative expense (GAAP) $ 36,233 $ 34,130 $ 137,071 $ 126,586 Weighted-average shares outstanding:
Stock-based compensation expense (2,731) (1,595) (9,760) (9,654) Weighted-average shares of common stock outstanding used in computing loss per
Depreciation and amortization (251) (303) (942) (1,157) share attributable to common stockholders, basic 246,401,175 118,652,121 203,598,673 101,370,632
Contract asset credit loss reserve - - (8,399) -
Loss per share attributable to Amyris, Inc. common stockholders - Basic
Sales, general and administrative expense (non-GAAP) $ 33,251 $ 32,232 $ 117,970 $ 115,775
(GAAP) $ (0.44) $ (0.65) $ (1.88) $ (2.67)
Non-GAAP adjustments:
Cash operating expense $ 50,264 $ 45,371 $ 180,733 $ 181,665 Stock-based compensation expense 0.02 0.02 0.07 0.12
(Gain) loss from change in fair value of derivative instruments 0.02 (0.04) 0.06 (0.03)
(Gain) loss from change in fair value of debt 0.38 0.01 0.44 0.19
Loss upon extinguishment of debt - 0.30 0.26 0.44
Income attributable to noncontrolling interest 0.00 - 0.02 -
Deemed dividend upon conversion of Series E preferred stock into common stock - - 0.33 -
Deemed dividend to preferred stockholder on issuance and modification of common
stock warrants - - - 0.34
Loss allocated to participating securities (0.00) (0.01) (0.08) (0.07)
Contract asset credit loss reserve - - 0.04 -
Inventory lower-of-cost-or-net realizable value adjustment (0.01) 0.02 (0.01) 0.01
Other (income) expense, net, and loss from investment in affiliate 0.01 0.01 0.01 0.01
Adjusted net loss per share attributable to Amyris, Inc. common stockholders -
Basic (non-GAAP)(1) $ (0.03) $ (0.34) $ (0.74) $ (1.65)
(1)
Amounts may not sum due to rounding. - - - -
© 2021 Amyris, Inc. All Rights Reserved. | Page 20Investor Presentation | March 2021
Q4 and FY 2020 GAAP to Non-GAAP Reconciliations
GAAP to Non-GAAP Net Income (Loss) to EBITDA and Adjusted EBITDA
Three Months Ended
December 31 Year Ended December 31,
(In thousands) 2020 2019 2020 2019
Net loss attributable to Amyris, Inc. common stockholders, basic $ (108,759) $ (77,433) $ (382,311) $ (270,351)
Interest Expense/Gain(loss) from Change in FV of Derivatives & Debt/ Other Expenses $ - $ - $ - $ -
Interest on Convertible Debt $ - $ - $ - $ -
Adjustment to earnings and Loss allocated to participating securities $ (858) $ (1,441) $ (15,879) $ (7,380)
Dividend to preferred stockholder on issuance and modification of common stock warrants $ - $ - $ - $ 34,964
Dividend to preferred stockholders on conversion of preferred stock $ - $ - $ 67,151 $ -
Income attributable to non-controlling interest in Aprinnova $ - $ - $ - $ -
Interest Exp, Income Tax, $ 6,224 $ 14,153 $ 48,244 $ 59,294
Depreciation/Amortization $ 1,923 $ 1,890 $ 7,223 $ 4,581
EBITDA $ (101,470) $ (62,831) $ (275,572) $ (178,892)
Interest & Other income (expense), net $ 95,194 $ 38,055 $ 143,846 $ 64,360
Gain (loss) from change in fair value of derivative instruments $ 4,864 $ (5,214) $ 11,362 $ (2,777)
Less: income attributable to noncontrolling interest $ 356 $ - $ 4,165 $ -
Less Lower Cost to Market Adjustment $ (1,556) $ 2,872 $ (1,182) $ 1,476
Lavvan & Impairments $ - $ - $ 8,399 $ -
Stock Compensation $ 3,888 $ 2,493 $ 13,743 $ 12,554
Adjusted EBITDA $ 1,276 $ (24,625) $ (95,239) $ (103,279)
© 2021 Amyris, Inc. All Rights Reserved. | Page 21You can also read