An underground, wireless, open-source, low-cost system for monitoring oxygen, temperature, and soil moisture
←
→
Page content transcription
If your browser does not render page correctly, please read the page content below
SOIL, 8, 85–97, 2022

                                                                                                       SOIL
https://doi.org/10.5194/soil-8-85-2022
© Author(s) 2022. This work is distributed under
the Creative Commons Attribution 4.0 License.

       An underground, wireless, open-source, low-cost system
        for monitoring oxygen, temperature, and soil moisture
             Elad Levintal1 , Yonatan Ganot2 , Gail Taylor3 , Peter Freer-Smith3,4 , Kosana Suvocarev1 , and
                                                   Helen E. Dahlke1
              1 Department  of Land, Air and Water Resources, University of California, Davis, 95616 CA, USA
                 2 Department  of Geography and Environment, Bar-Ilan University, Ramat-Gan 52900, Israel
                       3 Department of Plant Sciences, University of California, Davis, 95616 CA, USA
                            4 Forest Research, Alice Holt Lodge, Farnham, Surrey, GU10 4LH, UK

                                  Correspondence: Elad Levintal (elevintal@ucdavis.edu)

                                     Received: 13 July 2021 – Discussion started: 23 July 2021
                        Revised: 29 November 2021 – Accepted: 5 January 2022 – Published: 8 February 2022

       Abstract. The use of wireless sensor networks to measure soil parameters eliminates the need to remove sensors
       for field operations, such as tillage, thus allowing long-term measurements without multiple disturbances to soil
       structure. Wireless sensors also reduce above-ground cables and the risk of undesired equipment damage and
       potential data loss. However, implementing wireless sensor networks in field studies usually requires advanced
       and costly engineering knowledge. This study presents a new underground, wireless, open-source, low-cost
       system for monitoring soil oxygen, temperature, and soil moisture. The process of system design, assembly,
       programming, deployment, and power management is presented. The system can be left underground for several
       years without the need to change the battery. Emphasis was given on modularity so that it can be easily duplicated
       or changed if needed and deployed without previous engineering knowledge. Data from this type of system have
       a wide range of applications, including precision agriculture and high-resolution modelling.

1   Introduction                                                   can solve these issues (Cardell-Oliver et al., 2019; Zhang et
                                                                   al., 2017).
                                                                      While above-ground wireless sensor networks (WSNs)
                                                                   have been readily studied and implemented (DeBell et al.,
A remaining challenge in vadose zone monitoring is the mea-        2019; García et al., 2021), the use of WUSNs is still in its
surement of soil parameters, such as water content, without        early stages (Hardie and Hoyle, 2019; Wan et al., 2017). A
the need to remove sensors between field operations, such          WUSN is defined as a system in which all sensors and com-
as tillage, which often causes damage to wires connecting          munication components are buried underground (node) while
below-ground sensors to above-ground data loggers. In ad-          wirelessly transmitting data through the soil to an above-
dition, the standard setting of using cables to connect under-     ground hub (also referred to in the literature as a gateway)
ground sensors to an above-ground data logger and power            (Huang et al., 2020). The definition of an underground node
source can change soil structure by causing macro-pores            is study-dependent: here a node is defined as a single trans-
and fractures. The altered structure can potentially cause         mitting system located at a single depth; different sensors
unwanted experimental artifacts, such as preferential wa-          can be connected to one node via underground cables. The
ter flow or higher aeration rates. Also, above-ground cables       most basic WUSN configuration includes a single under-
can be subject to undesired damage resulting from weather          ground node and an above-ground hub. Advanced WUSNs
events, agricultural machinery, pests, and animals (Hardie         can consist of several underground nodes connected to a sin-
and Hoyle, 2019; Vuran et al., 2018). The use of wireless          gle above-ground hub (Liedmann and Wietfeld, 2017; Tiusa-
underground sensor networks (WUSNs), instead of cables,

Published by Copernicus Publications on behalf of the European Geosciences Union.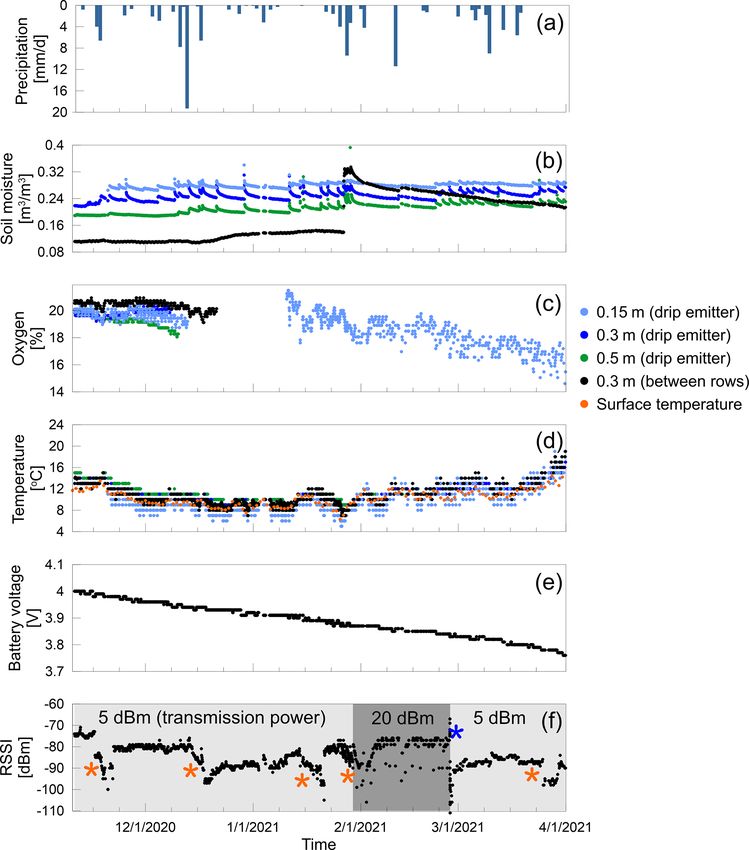
86                                                E. Levintal et al.: An underground, wireless, open-source, low-cost system

nen, 2013) or a wide-area network combining multiple un-          ing negative dBm units, closer to zero means greater sig-
derground nodes with multiple above-ground hubs (Froiz-           nal strength) and signal-to-noise ratio (SNR; positive val-
Míguez et al., 2020).                                             ues indicate more signal than noise), primarily depend on
   Ritsema et al. (2009) were the first to monitor soil mois-     the transmitter operating frequency, burial depth, transmit-
ture in a golf course over several square kilometres using a      ter power, distance between the underground node and the
WUSN consisting of multiple locations. They used a com-           above-ground hub, antenna type, data rate, soil moisture, and
plex array of 18 underground nodes, each installed at 0.1 m       to a lesser extent soil texture and electrical conductivity (Bo-
below the soil surface, and a single above-ground hub. To         gena et al., 2009; Hardie and Hoyle, 2019). The limit of ac-
bridge the distance between underground nodes and the sin-        ceptable RSSI for wireless communication is subjective and
gle above-ground hub, they installed 24 additional above-         determined based on experimental needs and the RSSI-to-
ground nodes. Private engineering companies provided the          SNR ratio (Hardie and Hoyle, 2019).
network architecture (hardware and software), and no fur-            Alongside the advances made in IoT-related wireless com-
ther information was provided to allow reproducibility. More      munication, open-source hardware is an additional emerg-
recently, Zhang et al. (2017) presented the Thoreau network       ing field of interest in environmental research (Concialdi
as the first long-term WUSN for agricultural and environ-         et al., 2020; Fisher and Gould, 2012; Froiz-Míguez et al.,
mental sensing. The network consists of a single hub in-          2020). Open-source hardware consists of electronics that
stalled at 41 m above ground, which receives data from 27         can be freely replicated or assembled using openly avail-
underground nodes. Each node was buried at ∼ 0.3 m while          able instructions, such as schematics, drawings, and layouts
connected to soil moisture and water potential sensors. Us-       (Chan et al., 2020). Arduino microcontrollers and Raspberry
ing a wireless network named Sigfox (902 MHz radio band),         Pi microcomputers, with their software platforms, are per-
they successfully covered an urban area of 2.5 km2 . Although     haps the most common examples of open-source hardware.
some details on network architecture and power management         The widespread adoption of open-source hardware is led by
were provided, there was no detailed description of their cus-    hobbyists and the public and to a lesser extent by the aca-
tomized hardware and software.                                    demic community (e.g. the OPEnS Lab, Oregon State Uni-
   The extensive development of Internet of Things (IoT)          versity). However, the available online information of tutori-
hardware and IoT-related wireless communication protocols         als, forums, and ongoing developments minimizes the learn-
provides new opportunities for implementing communica-            ing curve and can help bridge the gap toward a higher im-
tion solutions for WUSNs (Salam and Raza, 2020). Gar-             plementation rate of open-source hardware in academic re-
cía et al. (2020) and Vuran et al. (2018) present a com-          search (e.g. Levintal et al., 2020, 2021b; Reck et al., 2019;
prehensive review of the most utilized wireless communi-          Weissman et al., 2020). Additional benefits of utilizing open-
cation protocols, including Bluetooth, cellular, Wi-Fi, Sig-      source hardware are no prior experience with electronics or
fox, and ZigBee. Out of these, one of the most suitable for       coding being needed, though it can help (Chan et al., 2020),
WUSNs is the low-power long-range (LoRa) network proto-           lower costs than existing commercial hardware (Levintal et
col (referred to here as LoRa-WUSN). LoRa is a relatively         al., 2021a), and the option for customized solutions. Specif-
new, open technology designed for small data rates up to          ically, harnessing open-source hardware for LoRa-WUSN
50 kbps (Abrardo and Pozzebon, 2019; García et al., 2020)         lowers such sensor networks’ cost and complexity, thus mak-
over above-ground distances of 10+ km assuming a clear line       ing them accessible for researchers.
of sight (Sanchez-Iborra et al., 2018). LoRa-based networks          The use of LoRa-WUSN in soil studies has not been com-
have recently attracted increasing attention from academia        prehensively investigated (Hardie and Hoyle, 2019). The ma-
and industry (Fraga-Lamas et al., 2019; Froiz-Míguez et al.,      jority of studies on LoRa-WUSN can be found in engineering
2020), yet most studies and implementations were done for         disciplines and focus on in-soil signal propagation (Wan et
above-ground LoRa networks, and LoRa-WUSN is consid-              al., 2017) and antenna optimization (Salam and Raza, 2020),
ered an innovative field of research (Liedmann and Wietfeld,      making it challenging to adapt their conclusions to other
2017) with scarce literature support to date.                     disciplines, such as hydrology and soil science. Moreover,
   Radio signal attenuation is a primary consideration for any    there is a lack of studies showing the performance of LoRa-
type of WUSN, with the total attenuation strongly dependent       WUSN for long-term measurements (Cardell-Oliver et al.,
on the length of the signal path in the soil (Bogena et al.,      2019). Most studies previously published on LoRa-WUSN
2009). According to Tiusanen (2013), there are four com-          are either proof-of-concept studies or short-lived laboratory
ponents affecting the signal attenuation between an under-        experiments (e.g. Huang et al., 2020; Wan et al., 2017). In
ground node and an above-ground hub: signal loss due to soil      addition, to the best of our knowledge, there is only one
medium attenuation, due to partial reflection from the soil       study published to date that tested and presented results from
surface, due to angular defocusing, and free air path loss. The   LoRa-WUSN for soil measurements (Cardell-Oliver et al.,
first two components are associated with the soil medium          2019). None of the aforementioned studies, however, focused
and the latter two with the air above. Signal quality, defined    on providing step-by-step instructions for the design, assem-
by the received signal strength index (RSSI; expressed us-        bly, and installation of WUSN by the end-user. Despite the

SOIL, 8, 85–97, 2022                                                                    https://doi.org/10.5194/soil-8-85-2022
E. Levintal et al.: An underground, wireless, open-source, low-cost system                                                    87

rapid technological advancement of WUSNs, it seems the            (named FeatherWings) that can be mounted on the Feather,
technology itself (assembly, programming) remains a major         thus providing versatile capabilities, such as data logging,
challenge to utilizing WUSNs more widely in environmental         without additional hardware complexity.
and academic research. By sharing detailed instructions on           The underground node (Fig. 1c) included a LoRa-Feather
the design, assembly, and installation of WUSNs, we think         connected to an external omnidirectional antenna (900 Mhz
these systems can be more widely used by other scientists         Antenna Kit, Adafruit, USA) and a battery (lithium-ion
and adapted to individual research needs.                         cylindrical battery – 3.7 V, 2200 mAh, Adafruit, USA).
   The aim of this study is to present a new open-source, low-    A power relay extension board was mounted on the
cost, LoRa-WUSN system for measuring soil moisture and            LoRa-Feather to optimize the sensors’ power consumption
oxygen levels at multiple depths in an agricultural soil and to   (Adafruit Non-Latching Mini Relay FeatherWing, Adafruit,
provide in detail the technical information for the system de-    USA). The relay provides power to four digital soil moisture
sign, assembly, programming, deployment, power manage-            sensors (5TM, METER Group, USA) and to an analogue-
ment, and data analysis so that other researchers can adapt       to-digital converter (ADC) (ADS1015 12 bit ADC, Adafruit,
the system to their needs. Emphasis is placed on modular-         USA). The ADC was used to convert the data from four
ity to allow the end-user to duplicate or change, if needed,      analogue oxygen sensors (KE-25 Figaro Engineering Inc.,
and deploy without previous engineering knowledge. There-         Japan). We choose the Decagon 5TM combined soil mois-
fore, hardware was limited to readily available components        ture and temperature sensor and the Figaro KE-25 oxygen
only. Eight sensors consisting of four digital soil moisture      sensor due to their low power requirements (5TM – 0.03 and
sensors and four analogue oxygen sensors were connected to        3 mA during sleep mode and measurement, respectively; KE-
an underground open-source LoRa transmitter node, and an          25 – no external power supply required for sensor operation),
above-ground LoRa hub logged the received data. For vali-         low cost, and long-term use in soil monitoring (Oroza et al.,
dation, the system was deployed in a field planted with young     2018; Turcu et al., 2005; Weitzman and Kaye, 2017). All
poplar trees (Populus trichocarpa) for 5 months.                  components, excluding the antenna and sensors, were placed
                                                                  in a waterproof enclosure and sealed using rubber coating
                                                                  (Performix 12213, Plasti Dip International, USA) to protect
2     Materials and methods
                                                                  against expected soil water (Fig. 1c).
2.1    Hardware
                                                                     Underground nodes for WUSNs need to be highly energy-
                                                                  efficient because the battery cannot be recharged without
Hardware was limited to readily purchasable products in or-       excavation (Hardie and Hoyle, 2019). To reduce the under-
der to assemble a low-cost LoRa-WUSN that can be eas-             ground node’s power consumption, which in our case mea-
ily replicated. The LoRa-WUSN installed in the field in-          sured and transmitted sensor data every 1 or 2 h, depend-
cluded two segments: a single underground node (to which          ing on the scenario tested, we used two independent meth-
the sensors were connected via underground cables) and            ods simultaneously. The first method was putting the LoRa-
a single above-ground hub combined with a data logger             Feather into a low-power consumption sleep mode. During
(Fig. 1). Table 1 summarizes the details of each sub-segment      the sleep mode, tested power requirements were reduced
component. The core of the LoRa-WUSN is the Adafruit              from ∼ 40 mA during normal active mode or ∼ 120 mA dur-
Feather M0 with RFM95 LoRa Radio (Adafruit, USA), here-           ing peak transmission to ∼ 0.035 mA, which translates to
after called LoRa-Feather, which utilized a non-licensed          about 7 years of LoRa-Feather operation using a 2200 mAh
900 MHz radio band (or 433 MHz in Europe). This is an             battery. However, this is a theoretical calculation because the
open-source microcontroller with an embedded LoRa radio           sleep mode is deactivated during sensor measurements and
module, which is light and affordable (USD ∼ 35). It also         data transmission and reception. The second method utilized
has multiple general-purpose input–output (GPIO) ports en-        the power relay to eliminate the standby power draw from
abling connections to analogue and digital sensors and low        the four soil moisture sensors and the ADC (to which the
power requirements (∼ 0.7 mA standby, ∼ 120 mA peak dur-          four oxygen sensors were connected). The relay was closed
ing 20 dBm transmission) (DeBell et al., 2019). The LoRa-         (i.e. no power) during sleep mode and transmission/reception
Feather transmission power ranges between 5 and 20 dBm            and turned on in each cycle for 5 s to allow sensor readings.
depending on the user choice; dBm (decibel milliwatts) is            The above-ground hub (Fig. 1b) includes a LoRa-Feather
the unit used for measuring transmission power output (Parri      connected to an external omnidirectional antenna (900 Mhz
et al., 2019). We chose this model over other available LoRa-     Antenna Kit, Adafruit, USA) and a battery (lithium-ion poly-
based microcontrollers for three reasons: (1) LoRa-Feather        mer battery – 3.7 V, 1200 mAh, Adafruit, USA). Received
has a large set of free online tutorials and supporting infor-    data were logged on an SD card using an extension board
mation, making the development and integration relatively         mounted on the LoRa-Feather (Adalogger FeatherWing –
easy, (2) LoRa-Feather was previously validated in above-         RTC + SD, Adafruit, USA). The lithium battery can support
ground LoRa-based experiments (DeBell et al., 2019), and          only several days of continuous hub operation. Therefore, an
(3) the Feather microcontroller has multiple extension boards     external solar panel and a 12 V battery were connected to the

https://doi.org/10.5194/soil-8-85-2022                                                                   SOIL, 8, 85–97, 2022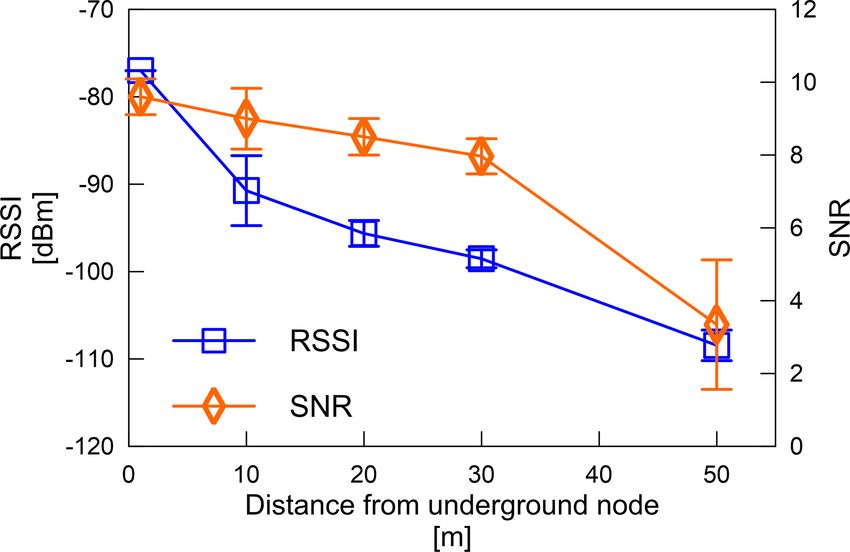
88                                                E. Levintal et al.: An underground, wireless, open-source, low-cost system

built-in lithium battery charging module in the LoRa-Feather.     ground hub will send a reply to the underground node with
Because the battery provided 12 V, a voltage converter to 5 V     instructions on the new measurement interval or new trans-
was used between the 12 V battery and LoRa-Feather (UBEC          mission power before data packets are written onto the SD
DC/DC step-down converter, Adafruit, USA). All compo-             card, together with the RSSI, SNR, and a timestamp. If no re-
nents, excluding the antenna and solar panel, were placed in      ply was sent from the above-ground hub to the underground
a waterproof enclosure (Fig. 1b).                                 node, then the node will use its current measurement interval
   The total cost of the system, apart from the sensors           and transmission power for the next cycle.
and solar panel, was USD 150 (Table 1). The sensors’ cost
amounted to USD ∼ 1050 for the four 5TM and four KE-25            2.3   Field deployment
sensors, yet this can vary depending on the number of sen-
sors needed. In general, there is no limitation on the num-       A field experiment was conducted to validate the proposed
ber of sensors connected to one underground node because          LoRa-WUSN (Fig. 1a). The system was installed in a poplar
the modular nature of open-source hardware allows the addi-       orchard irrigated with surface drip located near Davis, CA,
tion of hardware according to the user’s needs. For example,      USA. The soil type at the site is a reiff very fine sandy loam
adding four oxygen sensors can be achieved by adding a sec-       (SoilWeb, 2021), and the climate is Mediterranean with a
ond ADC (USD 10; see Table 1) to the underground LoRa-            total annual precipitation of about 500 mm and a mean an-
Feather. However, more sensors will, of course, affect the        nual temperature of 16.9 ◦ C (Kourakos et al., 2019). The un-
battery life.                                                     derground node was buried at 0.3 m below the soil surface
   Detailed assembly instructions for the underground node,       between two tree rows with the antenna in a horizontal ori-
sensors, and above-ground hub are provided in the Supple-         entation and pointed toward the above-ground hub, located
ment (Sect. S1).                                                  on a nearby poplar tree at 1 m above ground (Fig. 1c). The
                                                                  horizontal distance between the underground node and the
2.2   Software
                                                                  above-ground hub was 2 m. The soil moisture and oxygen
                                                                  sensors were combined into four pairs. Three oxygen–soil
The LoRa-Feather microcontrollers were programmed us-             moisture pairs were installed below one of the surface drip
ing C++ in the commonly used open-source Arduino in-              emitters at 0.15, 0.3, and 0.5 m and the fourth pair at 0.3 m
tegrated development environment (Chan et al., 2020). Ex-         between the tree rows outside of the drip emitter’s effective
isting Arduino-compatible libraries were utilized and com-        area. All sensors were connected to the underground node via
bined to configure and program the overall set-up. The            underground cables buried at 0.3 m. The system was installed
complete codes, with libraries and open license conditions,       and tested throughout the winter season (November 2020 to
are described in the Supplement (Sect. S2) and on Github          March 2021). During this season, the soil has elevated soil
at https://github.com/levintal/LoRaSystemForSoils, last ac-       moisture resulting from winter precipitation, which increases
cess: 10 November 2021. Figure 2a and b present the algo-         radio signal attenuation. Therefore, the wetter winter season,
rithm flow chart for the underground node and above-ground        which is considered more challenging than the drier summer
hub, respectively.                                                season when using the LoRa-WUSN, was chosen for this
   Every measurement cycle conducted by the underground           study. Atmospheric measurements were taken from meteo-
node included 5 s of sensor readings followed by the trans-       rological station number 6 of the California Irrigation Man-
mission of four data packets. Splitting the data into four        agement Information System (CIMIS), situated 1300 m from
packets was necessary because each packet is constrained to       the site.
20 chars (a char is a data type used in C++). The four pack-         To test the performance of the LoRa-WUSN, three ex-
ets included the measured data from the four oxygen and four      perimental scenarios with different sleep modes and signal
soil moisture sensors and the node’s measured battery volt-       strengths during data transmission were tested in sequence
age. An identifier value was assigned at the start of each data   between 11 November 2020 and 31 March 2021. The three
packet to mark its packet index (i.e. 1, 2, 3, or 4). After the   scenarios include (1) 2 h measurement intervals and low
transmission of the four data packets, the underground node       transmission power of 5 dBm (2 h, low transmission power)
waits for instructions from the above-ground hub on a new         (10 November 2020–7 January 2021 and 27 February–
measurement interval or transmission power for the node’s         31 March 2021), (2) 1 h measurement intervals and low trans-
next measurement cycle. If such a reply was received, then        mission power of 5 dBm (1 h, low transmission power) (8–
the node parameters were adjusted accordingly, e.g. increas-      28 January 2021), and (3) 2 h measurement intervals and
ing the next cycle transmission power from 5 to 20 dBm for        high transmission power of 20 dBm (2 h, high transmission
cases in which stronger transmission power is needed. After       power) (29 January–25 February 2021). In addition to these
each cycle, the underground node is set back to sleep mode.       three scenarios, we also tested a 1 min measurement interval
   The above-ground hub stays constantly in the receiver          and high transmission power of 20 dBm (26 February 2021)
mode. At the end of a receiving cycle, once the four data         to assess the effect of the distance between the above-ground
packets from the underground node are received, the above-        hub and the underground node on the wireless communi-

SOIL, 8, 85–97, 2022                                                                   https://doi.org/10.5194/soil-8-85-2022
E. Levintal et al.: An underground, wireless, open-source, low-cost system 89
Table 1. Summary of hardware components and materials used in this study.
Component Cost (USD) Source of materials Comments
Underground node
Adafruit Feather M0 with RFM95 LoRa Radio – 34.95 Adafruit Depending on the local regulation, use the 900 MHz
900 MHz – RadioFruit (e.g. USA) or 433 MHz radio version (e.g. Europe) –
both versions have similar capabilities and prices.
Header Kit for Feather – 12-pin and 16-pin 0.95 Adafruit
Female Header Set
900 Mhz Antenna Kit – for LoPy, LoRa, etc. 12.75 Adafruit
uFL SMT Antenna Connector 0.75 Adafruit
Adafruit Non-Latching Mini Power Relay FeatherWing 7.95 Adafruit
ADS1015 12 bit ADC – four-channel with pro- 9.95 Adafruit For the four oxygen sensors
grammable
gain amplifier
Short Feather Male Headers – 12-pin and 16-pin Male 0.5 Adafruit
Header Set
Lithium-ion cylindrical battery – 3.7 V 2200 mAh 9.95 Adafruit
LeMotech Waterproof Dustproof IP65 ABS Plastic 6.99 Amazon
Junction Box Universal Electric Project Enclosure
Pale Gray 3.9 × 2.7 × 2 in. (100 × 68 × 50 mm)
Sensors
KE-25 (oxygen sensor) ∼ 60 per sensor Figaro Four sensors were used (USD 240).
50 mL conical centrifuge tubes ∼ 1 per unit Common lab equipment Used to protect the KE-25 sensors
5TM (soil moisture sensor) ∼ 200 per sensor METER Four sensors were used (USD 800)
Stereo jack to pigtail probe adapter, brown and orange ∼ 7 per unit METER For the 5TM sensors
Above-ground hub
Adafruit Feather M0 with RFM95 LoRa Radio – 34.95 Adafruit Depending on the local regulation, use the 900 MHz
900 MHz – RadioFruit (e.g. USA) or 433 MHz radio version (e.g. Europe) –
both versions have similar capabilities and prices.
Header Kit for Feather – 12-pin and 16-pin Female 0.95 Adafruit
Header Set
900 Mhz Antenna Kit – for LoPy, LoRa, etc. 12.75 Adafruit
uFL SMT Antenna Connector 0.75 Adafruit
Adalogger FeatherWing – RTC + SD add-on for all 8.95 Adafruit
Feather boards
CR1220 12 mm diameter – 3 V lithium coin cell battery 0.95 Adafruit For the RTC of the Adalogger
– CR1220
SD/MicroSD memory card (8 GB SDHC) 9.95 Adafruit
Short Feather Male Headers – 12-pin and 16-pin Male 0.5 Adafruit
Header Set
Lithium-ion polymer battery – 3.7 V 1200 mAh 9.95 Adafruit
UBEC DC/DC step-down (buck) converter – 9.95 Adafruit
5 V 3 A output
LeMotech Waterproof Dustproof IP65 ABS Plastic 6.99 Amazon
Junction Box Universal Electric Project Enclosure Pale
Gray 3.9 × 2.7 × 2 in. (100 × 68 × 50 mm)
12 V waterproof solar panel 59.95 Amazon The solar panel and battery used in this study were
used for different experiments simultaneously, and they
provided more power than was needed for the LoRa-
WUSN. Cheaper options with instructions can be found
on the Adafruit web page.
12 V battery 18.99 Amazon
https://doi.org/10.5194/soil-8-85-2022 SOIL, 8, 85–97, 202290 E. Levintal et al.: An underground, wireless, open-source, low-cost system
Figure 1. Scheme of the LoRa-WUSN experimental set-up in the field (a), the components of the above-ground hub (b), and the underground
node before coating (c).
cation signal strength. In this scenario, the above-ground date performance aspects of the LoRa-WUSN and to stimu-
hub was positioned at different distances from the under- late possible future applications.
ground node ranging from 1, 10, 20, 30, to 50 m. At each
distance, the above-ground hub measured for 10 min (1 min 3.1 System performance
intervals) at a constant height of 2 m above ground with
the same antenna orientation. RSSI and SNR values from Soil moisture below the drip emitter (measured with the
each location were used to assess communication strength. LoRa-WUSN) increased following each precipitation event
During the scenarios, the default LoRa-Feather parameters and then after the irrigation was restarted on 22 Febru-
were used (bandwidth = 125 kHz, coding rate = 4/5, spread- ary 2021 (Fig. 3b, color lines). Soil moisture between tree
ing factor = 128 chips/symbol, and CRC on) – additional in- rows increased only after major precipitation events in mid-
formation regarding these parameters can be found in the December and at the end of January (Fig. 3b, black line).
readme file link embedded within the code on GitHub. Oxygen concentrations in the soil were approximately 2 %–
5 % lower than atmospheric concentrations with higher con-
centrations observed in the dry area between the tree rows
3 Results and discussion than below the drip emitter (Fig. 3c). A general decrease
trend in soil oxygen was observed during periods when soil
Because the focus of this study is on the design and perfor- moisture increased. All four oxygen sensors transmitted very
mance of an open-source LoRa-WUSN for measuring soil low voltages (1–2 mV) corresponding to 0 % soil oxygen
parameters, our results and discussion will mainly concen- content after several weeks of operation. This was likely due
trate on the LoRa-WUSN’s capabilities, such as battery and to clogging of the sensors’ membranes, yet it was unexpected
wireless communication performance, and not on the inter- as we used a common sensor type (Kallestad et al., 2008;
pretation of the actual soil data collected in the field. The field Turcu et al., 2005). The problem was solved by embedding
data shown in Fig. 3 are mainly used to highlight and vali- the sensor in a customized enclosure that contained an ad-
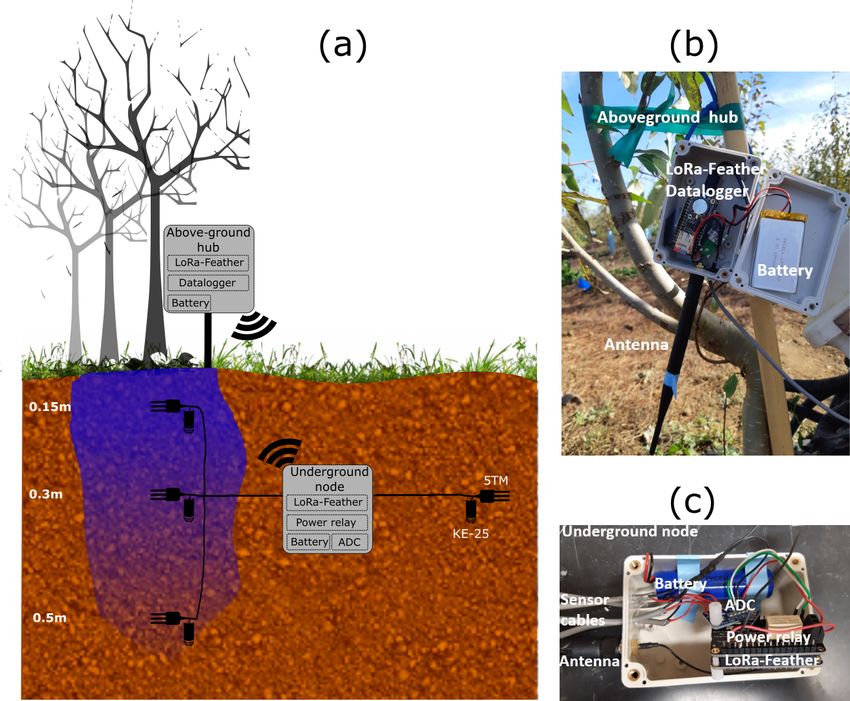
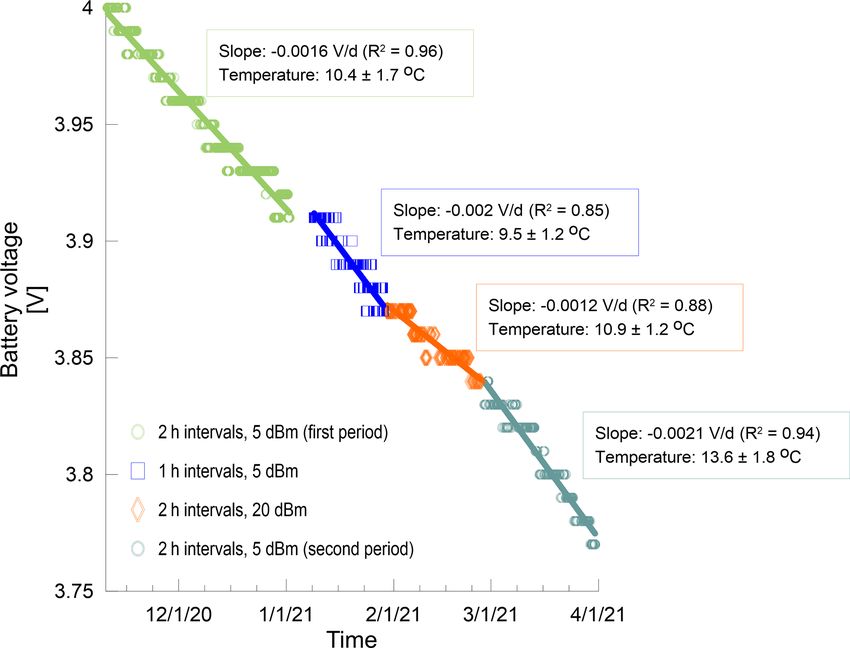
SOIL, 8, 85–97, 2022 https://doi.org/10.5194/soil-8-85-2022E. Levintal et al.: An underground, wireless, open-source, low-cost system 91 Figure 2. Flow chart for underground node (a) and above-ground hub (b). A description for each step is given within the code (Supplement, Sect. S2). ditional hydrophobic membrane (polytetrafluoroethylene – The underground node’s battery voltage was 4 V at the PTFE – type). The added membrane blocked the water while start of the field experiment and decreased to 3.77 V after 5 still allowing gas exchange with the surrounding soil (see the months of continuous operation (Fig. 3e). The battery decline enclosure design in the Supplement, Fig. S5). We note that rate was linear but varied depending on the measurement in- only the oxygen sensor at 0.15 m below the drip emitter was terval and transmission power used. Figure 4 presents the replaced with a new oxygen sensor and enclosure (10 Jan- battery decrease rates for the three main tested scenarios: 2 h uary 2021) due to limited sensor availability; the clogged between measurements with 5 dBm transmission power, 1 h sensors were not reused due to the uncertainty regarding their with 5 dBm transmission, and 2 h with 20 dBm transmission. performance and accuracy after clogging. Soil temperatures Unexpectedly, the fastest voltage decrease rate was during measured at the shallow depths (0.15 and 0.30 m) showed a the 2 h intervals with 5 dBm transmission (−0.0021 V d−1 ) typical diel pattern as well as a seasonal trend of decreasing and not during the 1 h intervals or higher transmission power temperatures until the end of January (Fig. 3d). Temperatures of 20 dBm (−0.002 and −0.0012 V d−1 , respectively). This were stable during February, followed by a sharp increase of was most likely due to the increase in soil temperature at ∼ 4 ◦ C during March at all measured depths. 0.3 m below the soil surface during this measurement period https://doi.org/10.5194/soil-8-85-2022 SOIL, 8, 85–97, 2022
92                                                     E. Levintal et al.: An underground, wireless, open-source, low-cost system

                                                                        Figure 4. Decrease rate of the underground node battery for three
                                                                        operational scenarios. The slopes were calculated using linear re-
                                                                        gressions (solid lines) and represent the average voltage decrease
                                                                        rate for each scenario. Temperature values represent the average soil
                                                                        temperature surrounding the node at 0.3 m below the soil surface
                                                                        during that specific scenario.

                                                                        Table 2. Power consumption.
Figure 3. Time series data from the field experiment. Orange as-
terisks in plot (f) represent the events during which the received           Stage                            Average         Average
signal strength index (RSSI) decreased markedly. The blue aster-                                               current        duration
isk in plot (f) indicates the day of the distance test (see Fig. 5).                                            (mA)                (s)
Blank areas in plot (c) are periods of missing data due to sensor
malfunctions, as explained in Sect. 3.1. The soil moisture sensor at         Sensor measurements                   63                5
0.15 m stopped measuring after the initial field installation and was        Transmission 5 dBm          45 (60 peak)              0.3
replaced 2 weeks later.                                                      Transmission 12 dBm         78 (80 peak)              0.3
                                                                             Transmission 17 dBm        96 (109 peak)              0.3
                                                                             Transmission 20 dBm       129 (130 peak)              0.3
(March), which was 3–4 ◦ C higher than during the other sce-                 Receiver mode                         22                1
narios (Fig. 4). In general, the amount of self-discharge of                 Sleep mode                         0.035     User-defined
lithium-ion batteries is temperature-dependent, with higher
discharge rates observed at increased temperature.
   Fitting a linear regression to the battery voltage decrease             As power consumption is critical for WUSNs, we mea-
rate allows estimation of a total lifetime of the underground           sured the duration and current of one complete operation
node’s battery, assuming a 0.5 V range (i.e. from an ini-               cycle for four different transmission levels (5, 12, 17, and
tial 4.1 V charged battery to 3.6 V). The average battery de-           20 dBm). The test was conducted in the lab using the same
crease rate over the entire experiment was −0.0015 V d−1                setting as in the field with the addition of the INA260
(R 2 = 0.99), resulting in a battery life of ∼ 333 d. We note           (Adafruit, USA) to measure the current at 100 ms intervals.
that this estimation also includes the battery’s self-discharge         The results (Table 2 and Figs. S10 and S11 in the Supple-
during sleep time under an average underground node tem-                ment) indicate that the main parameter affecting power con-
perature of 10.4 ± 1.8 ◦ C; however, higher soil temperature            sumption is the duration of the sensor measurements (63 mA
will increase the battery’s self-discharge rate, which usually          for 5 s), with a smaller contribution from the transmission
ranges between 3 % and 5 % per month. Moreover, battery                 (e.g. 129 mA for 0.3 s during 20 dBm transmission). We note
voltage decrease rate is not linear (Tarascon and Armand,               that the power consumption during sleep mode was below
2001) and will be faster for a fully charged battery or once            the detection limit, and therefore we used the value provided
the battery is below the nominal voltage (∼ 3.7 V). There-              by the manufacturer of 0.035 mA. The end-user can use the
fore, the above battery life estimation is considered the best-         power consumption values presented in Table 2 to optimize
case scenario.                                                          system performance according to specific needs and batter-
                                                                        ies.

SOIL, 8, 85–97, 2022                                                                           https://doi.org/10.5194/soil-8-85-2022
E. Levintal et al.: An underground, wireless, open-source, low-cost system 93
Two power management methods were used in the under-
ground node, a power relay for the sensors (hardware type)
and a sleep mode between measurement and transmission cy-
cles (software type). If longer battery life is needed, there
are additional power conservation methods available, such
as cancelling a data transmission if measured values have
not changed above a defined threshold compared to the pre-
vious measurement (Tiusanen, 2013) or reducing the num-
ber of data packets being sent by implementing an algorithm
that reduces overall data size (Cardell-Oliver et al., 2019).
Nevertheless, battery prices are relatively low, and there-
fore the best solution to extend battery life without compli-
cating the system is to purchase (if needed) a battery with
a larger capacity. In cases where extended battery life is
needed, it is recommended to use battery technologies with Figure 5. RSSI and signal-to-noise ratio (SNR) as a function of
lower self-discharge rates, such as non-rechargeable lithium- the linear distance between the underground node and the above-
ground hub. The above-ground hub was positioned at five distances
thionyl batteries with self-discharge rates lower than 1 % per
from the underground node (1, 10, 20, 30, and 50 m). At each dis-
year. A comparison between different battery technologies
tance, the hub recorded one reading per minute for 10 min at a con-
is detailed in Callebaut et al. (2021). For instance, using a stant height of 2 m above ground with the same antenna orientation.
non-rechargeable lithium-thionyl battery with ∼ 7000 mAh Transmission of the underground node was set to 20 dBm. Error
is estimated to increase the underground battery’s life 3-fold, bars indicate the standard deviation from the average of 10 mea-
resulting in 2–3 years of operation (according to the power surements at each distance.
consumption presented in Table 2).
Average RSSI and SNR throughout the experiment were
−84.4 ± 6 and 9.3 ± 0.6 dBm, respectively. Five continuous and SNR decreased with increasing distance between the
RSSI decrease events were identified, each lasting several above-ground hub and the underground node (Fig. 5). At the
days up to 1 week (Fig. 3f, orange asterisk symbols). Four out maximum distance tested (50 m), data packages from the un-
of the five events occurred 1–3 d after a major precipitation derground node were still received and logged with an RSSI
event (> 5 mm d−1 ). However, the RSSI decrease observed and SNR of −108.4 ± 1.7 and 3.3 ± 1.8 dBm, respectively.
in mid-January occurred after a week with zero precipita- The results agree with a LoRa-WUSN communication range
tion. In general, no significant correlations (using linear re- test conducted by Hardie and Hoyle (2019) using an under-
gressions) were found between RSSI and precipitation or ir- ground node at 0.3 m transmitting at 20 dBm and an above-
rigation pulses or soil moisture at the different depths. Thus, ground hub. The authors tested LoRa RSSI and SNR results
we conclude that precipitation and soil moisture were not the from four different soils (ranging from beach sand to clay
only ambient conditions affecting signal strength. Zhang et loam) at distances ranging from 0 to 200 m. Their results
al. (2017) came to a similar conclusion which they attributed show that, even at 100 m, data packets were received by the
to the environment’s complexity. In other words, the real- above-ground hub, suggesting that, similar to our setting, a
world environment compared to lab conditions contains addi- distance greater than the 50 m tested in this study would be
tional undetected parameters apart from soil moisture that re- feasible if needed. Signal attenuation in the soil is an im-
duce RSSI. Increasing transmission power from 5 to 20 dBm portant parameter that will determine the maximum com-
(29 January–25 February 2021) improved the signal strength munication range. Bogena et al. (2009) provided a validated
slightly, giving an average RSSI of −81.3 ± 5.7 dBm, which model that can be used to evaluate signal attenuation as a
was higher than the average of the following month of March function of soil depth, soil moisture, and soil water electri-
(−87.9 ± 3.5 dBm with low-power transmission of 5 dBm). cal conductivity for different radio frequencies. A more de-
This can also be visually observed by the higher RSSI base- tailed experimental analysis of in-soil LoRa signal range as
line during the high-power transmission scenarios (20 dBm) a function of soil moisture and depth is presented by Wan
compared to the low-power transmission scenarios (5 dBm) et al. (2017). Different field settings may create additional
(Fig. 3f). complexity (Bogena et al., 2009), and there remains a need
The effective communication range between the under- for further research in modelling and field validation of un-
ground node and above-ground hub was tested for 2 h on derground electromagnetic wave propagation, especially for
26 February 2021. This relatively short period was chosen to clay soils in which soil moisture and bulk electrical con-
ensure similar ambient conditions throughout the test (sim- ductivity are expected to be higher, thus reducing maximum
ilar relative humidity, temperature, soil moisture, etc.). The communication range.
underground node was set to transmit at 1 min intervals and The chosen transmission power and radio band should
20 dBm via a command from the above-ground hub. RSSI also follow legal restrictions derived from local regulation.
https://doi.org/10.5194/soil-8-85-2022 SOIL, 8, 85–97, 202294 E. Levintal et al.: An underground, wireless, open-source, low-cost system
In Europe, for instance, the maximum approved transmission ware allows the end-user various options for system configu-
power is 14 dBm (for 433 MHz) compared to 30 dBm in the rations without adding substantial complexity. For example,
USA (915 MHz) (Fraga-Lamas et al., 2019; Froiz-Míguez et instead of on-site data logging as conducted here, it is pos-
al., 2020; Haxhibeqiri et al., 2018). The results of our study sible to add a Wi-Fi component to the above-ground hub to
show that even 5 dBm provided sufficient power for transmit- get online real-time data (DeBell et al., 2019). If no Wi-Fi
ting data from the underground node to the above-ground hub is in range, a cellular modem can replace the Wi-Fi com-
located at a horizontal distance of 2 m (Fig. 3). The relation- ponent (Spinelli and Gottesman, 2019), which will be more
ship between transmission power, underground node depth, costly due to the cellular service charges, but it would pro-
distance between an underground node and an above-ground vide greater flexibility and range. An alternative solution is
hub, and soil texture is discussed in Hardie and Hoyle (2019). sending the data from the above-ground hub at the exper-
We note that the authors used a radio band of 433 MHz com- imental site to another above-ground LoRa station situated
pared to 915 MHz used in this study, and therefore some dif- several kilometres from the site in an area with a Wi-Fi signal
ferences are expected; lower radio band frequency will result or Ethernet connectivity. Combined solutions, such as on-site
in lower radio propagation losses (i.e. a larger range) (Froiz- data logging and Wi-Fi, Ethernet, or cellular communication,
Míguez et al., 2020). To the best of our knowledge, there are also possible (Levintal et al., 2021a).
is no published comparison between the two radio bands for Embedding a feedback mechanism within the code is pos-
LoRa-WUSN, and thus we cannot conclude which of the two sible if a packet receiving ratio of 100 % is desired (i.e. all the
is preferable (e.g. in terms of RSSI or SNR). Another regu- sent data are also logged on the above-ground hub). The un-
lative limitation is the duty cycle for an on-air time. In Eu- derground node continuously sends the same data packet un-
rope, it is 1 %, which means that for a 1 s LoRa transmission, til a reply from the above-ground hub is received stating that
this specific node cannot transmit during the following 99 s the packet was logged. The tradeoff of this modification is
(Haxhibeqiri et al., 2018). The 0.3 s transmission duration the increase in power consumption of the underground node
presented in this study (Table 2) translates to a minimum in- due to the potentially greater number of transmission cycles.
terval time of 29.7 s before the subsequent transmission can Power consumption can be managed within the code by im-
be made. plementing a predefined threshold voltage below which the
Apart from RSSI and SNR, another critical parameter is feedback mechanism will be disabled.
the data packet’s receiving ratio, defined as the number of re- Installing multiple underground nodes at different loca-
ceived data packets at the above-ground hub divided by the tions is also feasible. This requires a simple software mod-
packets that were sent from the underground node; a ratio of ification, in which every data packet (i.e. every singular
100 % represents ideal conditions under which all sent pack- transmission) is labelled at the start of the packet with an-
ets were also received at the first attempt. The average ra- other identifier specifying the underground node that sent the
tio during the experiment was 75 %, with higher ratio values packet, and accordingly the above-ground hub knows from
observed at the start of the winter (∼ 87 % during October) which node the packet was received. A similar method was
compared to the end (∼ 50 % during February). Lab test, con- presented by DeBell et al. (2019) for above-ground LoRa
ducted for 5 d using the same system setting (2 h intervals, networks. We tested and validated this method in the lab us-
low-power transmission of 5 dBm), resulted in a data packet ing three nodes and a single hub. Using this approach simpli-
receiving ratio of 100 %. By comparing the lab and field fies system assembly for the end-user; however, it increases
results, we conclude that the decrease in received packets the risk of data packet loss in the cases of two nodes trans-
was due to electromagnetic interferences at the site. Potential mitting simultaneously. To quantify this risk, we conducted
sources of electromagnetic interferences were a nearby active a test in which three nodes transmitted data packets at 1 min
airport situated 500 m to the south and an eddy-covariance intervals for 20 h (i.e. 20 data packets per node). Data packet
flux tower situated at the same experimental site. Even with receiving ratios were 100 %, 95 %, and 100 % for nodes 1, 2,
the low receiving ratio observed in February, the system was and 3, respectively. These ratios indicate a low probability of
still able to transmit and store most of the data received from transmission collisions between nodes, yet if a significantly
the underground node measured at the specified intervals. larger number of nodes is required, it is recommended to use
Missing data packets are an acceptable limitation for WUSNs more complex solutions like the LoRa wide area network-
(Zhang et al., 2017). However, if needed, there are possible ing technology (LoRaWAN). LoRaWAN is an open-source
solutions to ensure higher data packet receiving ratios, as dis- protocol that uses the LoRa protocol to enable communi-
cussed in the next section. cation between multiple nodes and hubs (also referred to
as gateways), with additional benefits such as adaptive data
3.2 System modifications and configurations
rates that can reduce power consumption (Froiz-Míguez et
al., 2020; Haxhibeqiri et al., 2018). There is also an emerg-
In this study, we present a LoRa-WUSN that was built to ing use of LoRaWAN solutions commercialized by private
measure soil moisture, soil temperature, and soil oxygen con- companies, yet they are still costly and, in most cases, target
tent. Nevertheless, the modular nature of open-source hard- big end-users, such as cities, and therefore are less relevant
SOIL, 8, 85–97, 2022 https://doi.org/10.5194/soil-8-85-2022E. Levintal et al.: An underground, wireless, open-source, low-cost system 95
for field-scale research. A review of the LoRaWAN technol- Acknowledgements. The authors would like to thank Cristina
ogy is provided by Haxhibeqiri et al. (2018), and a more de- Prieto Garcia for her help with the field and laboratory experiments
tailed focus on the limitations is provided by Adelantado et and the two anonymous reviewers who helped improve this paper.
al. (2017).
Financial support. This research has been supported by the Gor-
4 Conclusions don and Betty Moore Foundation (grant no. 7975), the United
States–Israel Binational Agricultural Research and Development
This study presents a novel, low-cost wireless underground Fund (Vaadia-BARD Postdoctoral Fellowship no. FI-605-2020), the
sensor network (WUSN) for soil monitoring using the rela- National Institute of Food and Agriculture (grant no. CA-D-LAW-
tively new, open-communication protocol named low-power 2513-H), and the U.S. Department of Energy, Office of Environ-
long-range (LoRa). A field test, conducted for 5 months in mental Management (grant no. DE-SC0020164).
an agricultural field, allowed assessment of the system’s ca-
pabilities. Soil moisture content, temperature, and soil oxy-
gen concentrations were measured at three depths (0.15, 0.3, Review statement. This paper was edited by Jan Vanderborght
and 0.5 m), and data were transmitted from an underground and reviewed by two anonymous referees.
node (0.3 m) to an above-ground receiving and logging hub.
Communication tests showed an effective range of at least
50 m is possible between the underground node and above-
ground hub. Using power management methods, battery life References
was estimated at ∼ 333 d, with an option to triple this pe-
riod when using a battery with a bigger capacity and lower Abrardo, A. and Pozzebon, A.: A multi-hop lora linear sensor net-
self-discharge rate. The cost of all the data logging, power, work for the monitoring of underground environments: The case
and communication components was USD 150, 1 or 2 or- of the medieval aqueducts in Siena, Italy, Sensors, 19, p. 402,
ders of magnitude smaller than other available commercial https://doi.org/10.3390/s19020402, 2019.
Adelantado, F., Vilajosana, X., Tuset-Peiro, P., Martinez,
solutions. Emphasis was placed on providing the complete
B., Melia-Segui, J., and Watteyne, T.: Understanding the
technical guide and using only readily buyable hardware. Limits of LoRaWAN, IEEE Commun. Mag., 55, 34–40,
By doing so, the technical and cost barriers were reduced, https://doi.org/10.1109/MCOM.2017.1600613, 2017.
which we hope will allow easier reproducibility and open Bogena, H. R., Huisman, J. A., Meier, H., Rosenbaum, U., and
new applications for vadose zone and environmental moni- Weuthen, A.: Hybrid Wireless Underground Sensor Networks:
toring studies. Quantification of Signal Attenuation in Soil, Vadose Zone J., 8,
755–761, https://doi.org/10.2136/vzj2008.0138, 2009.
Callebaut, G., Leenders, G., Van Mulders, J., Ottoy, G., De Strycker,
Data availability. The complete technical guide is available in the L., and Van der Perre, L.: The Art of Designing Remote IoT De-
Supplement file below and in the GitHub repository (https://github. vices – Technologies and Strategies for a Long Battery Life, Sen-
com/levintal/LoRaSystemForSoils, Levintal, 2021). sors, 21, p. 913, https://doi.org/10.3390/s21030913, 2021.
Cardell-Oliver, R., Hübner, C., Leopold, M., and Beringer, J.:
Dataset: LoRa Underground Farm Sensor Network, in: Proceed-
Supplement. The supplement related to this article is available ings of the 2nd Workshop on Data Acquisition To Analysis
online at: https://doi.org/10.5194/soil-8-85-2022-supplement. – DATA’19, ACM Press, New York, New York, USA, 26–28,
https://doi.org/10.1145/3359427.3361912, 2019.
Chan, K., Schillereff, D. N., Baas, A. C. W., Chadwick, M. A.,
Main, B., Mulligan, M., O’Shea, F. T., Pearce, R., Smith, T.
Author contributions. EL conceptualized and conducted the
E. L., van Soesbergen, A., Tebbs, E., and Thompson, J.: Low-
study and wrote the first manuscript draft. HED provided the re-
cost electronic sensors for environmental research: Pitfalls and
sources. All the authors (EL, YG, GT, PFS, KS, and HED) con-
opportunities, Prog. Phys. Geogr.-Earth Environ., 45, 305–338,
tributed to the final version.
https://doi.org/10.1177/0309133320956567, 2020.
Concialdi, P., Di Prima, S., Bhanderi, H. M., Stewart, R. D., Abou
Najm, M. R., Lal Gaur, M., Angulo-Jaramillo, R., and Lass-
Competing interests. The contact author has declared that nei- abatere, L.: An open-source instrumentation package for inten-
ther they nor their co-authors have any competing interests. sive soil hydraulic characterization, J. Hydrol., 582, 124492,
https://doi.org/10.1016/j.jhydrol.2019.124492, 2020.
DeBell, T., Goertzen, L., Larson, L., Selbie, W., Selker, J., and
Disclaimer. Publisher’s note: Copernicus Publications remains Udell, C.: OPEnS Hub: Real-Time Data Logging, Connect-
neutral with regard to jurisdictional claims in published maps and ing Field Sensors to Google Sheets, Front. Earth Sci., 7, 1–6,
institutional affiliations. https://doi.org/10.3389/feart.2019.00137, 2019.
Fisher, D. K. and Gould, P. J.: Open-Source Hardware Is a Low-
Cost Alternative for Scientific Instrumentation and Research,
https://doi.org/10.5194/soil-8-85-2022 SOIL, 8, 85–97, 202296 E. Levintal et al.: An underground, wireless, open-source, low-cost system Mod. Instrum., 1, 8–20, https://doi.org/10.4236/mi.2012.12002, tem, in: 2017 IEEE SENSORS, 2017 December, IEEE, 2012. Glasgow, UK, 29 October–1 November 2017, 1–3, Fraga-Lamas, P., Celaya-Echarri, M., Lopez-Iturri, P., Castedo, L., https://doi.org/10.1109/ICSENS.2017.8233889, 2017. Azpilicueta, L., Aguirre, E., Suárez-Albela, M., Falcone, F., and Oroza, C. A., Bales, R. C., Stacy, E. M., Zheng, Z., and Glaser, Fernández-Caramés, T. M.: Design and Experimental Valida- S. D.: Long-Term Variability of Soil Moisture in the South- tion of a LoRaWAN Fog Computing Based Architecture for ern Sierra: Measurement and Prediction, Vadose Zone J., 17, IoT Enabled Smart Campus Applications, Sensors, 19, 3287, 170178, https://doi.org/10.2136/vzj2017.10.0178, 2018. https://doi.org/10.3390/s19153287, 2019. Parri, L., Parrino, S., Peruzzi, G., and Pozzebon, A.: Low power Froiz-Míguez, I., Lopez-Iturri, P., Fraga-Lamas, P., Celaya-Echarri, wide area networks (LPWAN) at sea: Performance analysis M., Blanco-Novoa, Ó., Azpilicueta, L., Falcone, F., and of offshore data transmission by means of loRaWAN connec- Fernández-Caramés, T. M.: Design, Implementation, and Em- tivity for marine monitoring applications, Sensors, 19, 3239, pirical Validation of an IoT Smart Irrigation System for Fog https://doi.org/10.3390/s19143239, 2019. Computing Applications Based on LoRa and LoRaWAN Sensor Reck, A., Paton, E., and Kluge, B.: Advanced In Situ Nodes, Sensors, 20, 6865, https://doi.org/10.3390/s20236865, Soil Water Sampling System for Monitoring Solute 2020. Fluxes in the Vadose Zone, Vadose Zone J., 18, 1–8, García, L., Parra, L., Jimenez, J. M., Lloret, J., and Lorenz, https://doi.org/10.2136/vzj2019.01.0008, 2019. P.: IoT-Based Smart Irrigation Systems: An Overview Ritsema, C. J., Kuipers, H., Kleiboer, L., van den Elsen, E., Oost- on the Recent Trends on Sensors and IoT Systems for indie, K., Wesseling, J. G., Wolthuis, J.-W., and Havinga, P.: Irrigation in Precision Agriculture, Sensors, 20, 1042, A new wireless underground network system for continuous https://doi.org/10.3390/s20041042, 2020. monitoring of soil water contents, Water Resour. Res., 45, 1–9, García, L., Parra, L., Jimenez, J. M., Parra, M., Lloret, J., Mauri, https://doi.org/10.1029/2008WR007071, 2009. P. V., and Lorenz, P.: Deployment strategies of soil monitoring Salam, A. and Raza, U.: Signals in the Soil, Springer, 429 wsn for precision agriculture irrigation scheduling in rural areas, pp., https://doi.org/10.1007/978-3-030-50861-6, ISBN 978-3- Sensors, 21, 1–30, https://doi.org/10.3390/s21051693, 2021. 030-50861-6, 2020. Hardie, M. and Hoyle, D.: Underground wireless data transmis- Sanchez-Iborra, R., Sanchez-Gomez, J., Ballesta-Viñas, J., Cano, sion using 433-MHz LoRa for agriculture, Sensors, 19, 4232, M. D., and Skarmeta, A. F.: Performance evaluation of https://doi.org/10.3390/s19194232, 2019. lora considering scenario conditions, Sensors, 18, p. 772, Haxhibeqiri, J., De Poorter, E., Moerman, I., and Hoebeke, J.: A https://doi.org/10.3390/s18030772, 2018. Survey of LoRaWAN for IoT: From Technology to Application, SoilWeb: SoilWeb – Interactive map of USDA-NCSS soil survey Sensors, 18, 3995, https://doi.org/10.3390/s18113995, 2018. data for locations throughout most of the U.S., Calif. Soil Re- Huang, H., Shi, J., Wang, F., Zhang, D., and Zhang, D.: Theoreti- sour. Lab UC Davis UC-ANR Collab. with USDA Nat. Resour. cal and Experimental Studies on the Signal Propagation in Soil Conserv. Serv., available at: https://casoilresource.lawr.ucdavis. for Wireless Underground Sensor Networks, Sensors, 20, 2580, edu/gmap/, last access: 18 August 2021. https://doi.org/10.3390/s20092580, 2020. Spinelli, G. M. and Gottesman, Z. L.: A low-cost Arduino- Kallestad, J. C., Sammis, T. W., and Mexal, J. G.: Comparison of based datalogger with cellular modem and FTP com- galvanic and chemi-luminescent sensors for detecting soil air munication for irrigation water use monitoring to en- oxygen in flood-irrigated pecans, Soil Sci. Soc. Am. J., 72, 758– able access to CropManage, HardwareX, 6, e00066, 766, https://doi.org/10.2136/sssaj2007.0170, 2008. https://doi.org/10.1016/j.ohx.2019.e00066, 2019. Kourakos, G., Dahlke, H. E., and Harter, T.: Increasing groundwater Tarascon, J. M. and Armand, M.: Issues and challenges fac- availability and seasonal base flow through agricultural managed ing rechargeable lithium batteries, Nature, 414, 359–367, aquifer recharge in an irrigated basin, Water Resour. Res., 55, https://doi.org/10.1038/35104644, 2001. 7464–7492, https://doi.org/10.1029/2018WR024019, 2019. Tiusanen, J.: Soil Scouts: Description and performance of single Levintal, E.: LoRaSystemForSoils, GitHub [data set], https://github. hop wireless underground sensor nodes, Ad. Hoc. Networks, 11, com/levintal/LoRaSystemForSoils, last access: 10 November 1610–1618, https://doi.org/10.1016/j.adhoc.2013.02.002, 2013. 2021. Turcu, V. E., Jones, S. B., and Or, D.: Continuous Soil Car- Levintal, E., Dragila, M. I., Lensky, N. G., and Weisbrod, N.: Bore- bon Dioxide and Oxygen Measurements and Estimation of hole Diameter Controls Thermal-Induced Convection and Evap- Gradient-Based Gaseous Flux, Vadose Zone J., 4, 1161–1169, oration From a Shallow Water Table, Geophys. Res. Lett., 47, https://doi.org/10.2136/vzj2004.0164, 2005. e2020GL089411, https://doi.org/10.1029/2020GL089411, 2020. Vuran, M. C., Salam, A., Wong, R., and Irmak, S.: Internet Levintal, E., Lee Kang, K., Larson, L., Winkelman, E., Nackley, L., of underground things in precision agriculture: Architecture Weisbrod, N., Selker, J. S., and Udell, C. J.: eGreenhouse: Robot- and technology aspects, Ad. Hoc. Networks, 81, 160–173, ically positioned, low-cost, open-source CO2 analyzer and sen- https://doi.org/10.1016/j.adhoc.2018.07.017, 2018. sor device for greenhouse applications, HardwareX, 9, e00193, Wan, X., Yang, Y., Cui, J., and Sardar, M. S.: Lora propagation https://doi.org/10.1016/j.ohx.2021.e00193, 2021a. testing in soil for wireless underground sensor networks, in: Levintal, E., Suvočarev, K., Taylor, G., and Dahlke, H. E.: Embrace 2017 Sixth Asia-Pacific Conference on Antennas and Propaga- open-source sensors for local climate studies, Nature, 599, 32– tion (APCAP), IEEE, Xi’an, China, 16–19 October 2017, 1–3, 32, https://doi.org/10.1038/d41586-021-02981-x, 2021b. https://doi.org/10.1109/APCAP.2017.8420657, 2017. Liedmann, F. and Wietfeld, C.: SoMoS – A multidi- Weissman, G., Bel, G., Ben-Gal, A., Yermiyahu, U., Alexandrov, mensional radio field based soil moisture sensing sys- B., Rasmussen, K. Ø., and Dahan, O.: Increased irrigation wa- SOIL, 8, 85–97, 2022 https://doi.org/10.5194/soil-8-85-2022
You can also read