Analysis on the Evolution of Mobile Network Characteristics from NetBravo Dataset
←
→
Page content transcription
If your browser does not render page correctly, please read the page content below
Analysis on the Evolution of Mobile Network
                    Characteristics from NetBravo Dataset
                                                                 Remus G. Niculescu
                                                                 University of Twente
                                                           P.O. Box 217, 7500AE Enschede
                                                                   The Netherlands
                                                        r.niculescu@student.utwente.nl

ABSTRACT                                                                             on fast internet connection and good coverage for day-by-
The rise of smart devices and the continuous increase of                             day activities such as driving, conducting transactions or
wireless data traffic usage triggered the development of                             interacting with others.
technologies and infrastructures. This research analyses                             Understanding the performance of communication
crowd-sourced open data provided by NetBravo from 2016                               networks is essential for various parties such as mobile
to 2021 in Europe to reveal how network features like                                network operators (MNOs), European governments and
speed, coverage, and channel occupancy improved. Also,                               the European Commission. For MNOs, it is important
this research compares different types of network connec-                            to have a clear overview of the current infrastructure to
tions (Wi-Fi and cellular) and different technology (Wi-Fi                           ensure the availability and quality of services. Collecting
2.4GHz/5GHz and cellular 2G/3G/4G) to find out similar-                              data on the signal strength or internet speed and analyzing
ities, differences and performance characteristics for each                          it can reveal areas that have poor network coverage and
of them. Lastly, the data provides geospatial informa-                               need improvements.
tion that allows to make a country-wise analysis of net-                             As for countries in Europe, providing internet access to cit-
work characteristics. Moreover, the research provides a                              izens and businesses is a priority. Technological advance
different perspective that can be used by the European                               swiftly changes the home and working environment. IoT
Commission, as well as other European governments and                                devices are one example. Because of their efficiency and
Mobile Network Operators, to track the progress towards                              applicability on a large scale in domains such as health-
their network performance goals. The best performing                                 care, energy conservation or transportation, these devices
technology is cellular 4G, having twice as high download                             will impact how business operate. Moreover, in combina-
speed and 1.6x times the upload speed of the next best-                              tion with 5G, they will improve Quality of Service (QoS)
performing technology. Also, the results have revealed                               and effective utilization of channels [16]. To make every-
that 75% of Wi-Fi measurements fail to reach the -80dBm                              thing possible, it is important that MNOs are capable of
threshold for basic connectivity. Among countries, The                               providing appropriate network performances to support
Netherlands has the highest average download speed with                              these technologies. Network data analysis is necessary to
24.7 Mbps and the highest average upload speed with 12.4                             identify what is the current state of development of net-
Mbps.                                                                                work infrastructure for a country. It could help the govern-
                                                                                     ment understand what is the progress in providing reliable
Keywords                                                                             internet in wide areas.
Mobile Signal Strength, Big Data, Geospatial Location,                               On the other hand, the increasing need for connectivity
NetBravo, Wi-Fi, Cellular Network, Network Speed Per-                                and the transition of many activities from a physical to an
formance                                                                             online environment might have required a fast improve-
                                                                                     ment of network characteristics to support the needs of
1.     INTRODUCTION                                                                  users [12]. Therefore, network operators might have de-
Mobile network coverage and speed performances are con-                              ployed new infrastructure to help with in higher network
stantly improving to fulfill the needs of users. New tech-                           demand for coverage and capacity. However, the improve-
nologies like 5G are under development to handle the huge                            ment of network performances vary across European coun-
amount of mobile traffic [5]. Reliable internet is crucial for                       tries since each country adopted different policies when it
businesses since it allows companies to keep an edge over                            comes to upgrading network infrastructure. An analysis
competitors in their respective industries such as trans-                            of network data from across Europe can provide an insight
portation, trading companies, news media, web hosting or                             to the current network capabilities of different countries.
service providers. Also, emergency services heavily rely on                          There are mainly two methods to acquire information re-
good coverage when it comes to fast and successful inter-                            garding network performance: drive tests [11] and crowd-
ventions [3]. On the other hand, more and more users rely                            sourcing platforms [7]. Drive tests require special devices
                                                                                     to measure signal strength and involve driving through the
Permission to make digital or hard copies of all or part of this work for            same region multiple times to take samples. The data pro-
personal or classroom use is granted without fee provided that copies
                                                                                     vided is of high quality due to the technology used, but
are not made or distributed for profit or commercial advantage and that
copies bear this notice and the full citation on the first page. To copy oth-        the whole process is time-consuming, expensive, and not
erwise, or republish, to post on servers or to redistribute to lists, requires       scalable for large areas. This is why platforms that involve
prior specific permission and/or a fee.                                              gathering network characteristics from wide geographical
35th Twente Student Conference on IT July 2nd , 2021, Enschede, The                  areas adopt the crowd-sourcing approach. It relies on users
Netherlands.                                                                         to install an application on their mobile devices that will
Copyright 2021, University of Twente, Faculty of Electrical Engineer-                take samples of the signal strength at random intervals
ing, Mathematics and Computer Science.

                                                                                 1
of time. Multiple factors affect the perceived signal qual-         features of the available network data. Section 4 will dis-
ity on a mobile device (e.g. line of sight, manufacturer,           cuss the methodology and frameworks that were used to
distance to the cell tower, tree cover density and their im-        conduct the analysis. Afterwards, the results and a com-
perviousness, etc.) [9], meaning the data is of lower quality       parison with other research will be displayed in Section 5.
in this case.                                                       In the end, Section 6 discusses the findings of this research
To keep track of network performance and to ensure that             and Section 7 reveals the conclusions and limitations of
the current infrastructure is capable of providing high qual-       the current analysis.
ity services for the users, the European Commission (EC)
launched a crowd-sourced project named NetBravo [13]                2.    RELATED WORK
to gather network data from across Europe. Features                 Fracarro et al. used NetBravo data set in their research [9].
like latency, upload, and download performance of user’s            The authors have combined the data with geo-spatial in-
Internet connection, as well as technology used, Wi-Fi              formation regarding the environment such as weather, tree
2.4GHz/5GHz and cellular 2G/3G/4G, are available for                cover density, imperviousness, altitude, or network infras-
the public. Also, signal strength measurements are pro-             tructure to train and test an uncertainty-aware artificial
vided. The information comes in monthly releases at dif-            neural network. The goal of the project was to estimate
ferent resolutions (i.e. 100 meters or 1 kilometer), contains       the network signal strength across the UK and find which
the geographical position and how many measurements                 features had the most significant impact on the measure-
were taken. The data is projected on the European Grid              ments. They trained the model by minimizing Root Mean
(European Petroleum Survey Group [EPSG]:3035).                      Squared Error (RMSE) and computed the Mean Absolute
At this moment, the usage of crowd-sourced big data in              Error (MAE).
network performance analysis is limited. The majority               In another study, Ferreira et al. [6] measured the signal
of research focuses on improvements from a technological            strength across two predefined routes in an urban area in
point of view, not performance-wise. Also, other research           Rio de Janeiro. The goal is to predict the signal strength
focuses on a global perspective, not European, and pro-             using the Cascade Knife Edge (CKE) and Delta-Bullington
vides an overview for only one type of connection, either           methods of the International Telecommunication Union-
Wi-Fi or cellular. This may leave no possibilities for a            Radiocommunication (ITU-R). It was found that CKE
comparison between them. Moreover, there are no studies             had better adjustments for the data provided and fur-
that target the network performance from a NetBravo per-            ther used to train and test an artificial neural network
spective. An additional look at a different data set might          (ANN). In the end, the hybrid application (CKE/ANN)
provide useful insights for the European Commission, as             had a better performance in predicting the signal strength
well as other European governments and Mobile Network               than stand-alone applications. This research highlighting
Operators which will help on the progress towards their             the reasons why a couple of methods can be used to predict
network performance goals.                                          the signal strength.

1.1    Research Goals                                               Viswanathan and Weldon [15] provided a good overview of
                                                                    the evolution of mobile communication and how key inno-
This research aims to analyze the data provided by Net-
                                                                    vations and new technologies contribute to major perfor-
Bravo from 2016 to 2021 to provide insights on how net-
                                                                    mance improvements. The research presents a timeline of
work performance changed over this period of time. More-
                                                                    innovations starting from the first analog cellular systems
over, a comparison in terms of performance, speed and
                                                                    to the newest technologies like the 4G Long Term Evo-
signal strength, for different types of network connections
                                                                    lution (LTE) system. Consequently, a list of 11 features
(Wi-Fi and cellular) and different technologies (2.4GHz/
                                                                    that had a major impact on the performance of the mobile
5GHz for Wi-Fi and 2G/3G/4G for cellular) will be pro-
                                                                    networks is discussed. In the end, there is speculation on
vided. Lastly, since a delimitation on countries for the
                                                                    elements, such as spectrum, spectral efficiency, spatial effi-
data set provided is possible, the same comparisons men-
                                                                    ciency, and system efficiency, that will be deterministic for
tioned above will be applied to individual countries across
                                                                    5G technologies. This research is considered since some of
Europe. Therefore, the research will be divided into two
                                                                    the improvements described might be seen in the analysis
parts: creating a general overview and a country-wise
                                                                    of data from NetBravo.
overview of the network performance. Having that in
mind, the purpose of this paper can be translated into              Astely et al. [2] conducted another research that focuses
providing answers to the following research questions:              on the technological improvements, specifically for LTE.
                                                                    The authors provide an overview of how key characteris-
                                                                    tics such as spectrum efficiency, radio-network architecture
   • RQ 1.1 How did mobile network performances change
                                                                    or support of division duplex (FDD) and time-division du-
     from 2016 to 2021 considering speed and signal
                                                                    plex (TDD) will increase peak rates and decrease radio-
     strength across Europe?
                                                                    network delay. They compared LTE FDD with a reference
   • RQ 1.2 What are the differences between Wi-Fi and              FDD system that was using more conventional techniques.
     cellular connections in terms of speed and signal              The results illustrate differences in spectrum efficiency re-
     strength?                                                      garding downlink and uplink.

   • RQ 1.3 Which technology is currently delivering the            3. NETBRAVO DATASET
     best overall performance?
                                                                    3.1 Data aggregates
   • RQ 2 How does network performance differ across                As stated before, the data used in this research is the
     countries in Europe?                                           NetBravo Open Dataset [8]. The data is split in three big
                                                                    categories:
Section 2 presents related work on the evolution of mobile
networks and the motivation behind this research. Af-                    • Broadband Speed test measurements including cellu-
ter that, Section 3 gives an insight into the structure and                lar technologies from 2G to 4G and Wi-Fi at 2.4GHz

                                                                2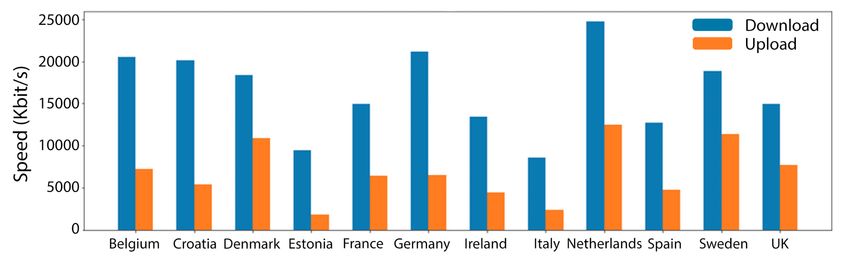
Table 1. Overview of special attributes contained in measurement files
               File        Grid Data Download Upload Ping Strength Std Dev Frequency                          Security
           broadband                                                      X         X            X               X
          Wi-Fi signal                     X           X        X
         cellular signal                   X           X        X                                X               X

                               Figure 1. Number of speed measurements based on technology

      and 5GHz bands                                                   • Code of the grid cell according to the reference sys-
                                                                         tem
   • cellular Signal Strength measurements
                                                                       • X coordinate on the cell grid (latitude)
   • Wi-Fi Signal Strength measurements .
                                                                       • Y coordinate on the cell grid (longitude)
Also, the data is composed of five different file formats:             • Type of the connection used (Wi-Fi/cellular)
.prj, .shp, .shx, .csv and .dbf. Following the same order,
they represent the shape file project, the geometry file, the          • Technology of the connection used
geometry index file, the aggregated NetBravo file, respec-               (2.4GHz/5GHz for Wi-Fi or 2G/3G/4G for cellular)
tively the attribute database file.
                                                                       • Number of measurements in the grid .
Lastly, the data is projected to a space grid according to
the European Grid (European Petroleum Survey Group
[EPSG]:3035) [4]. The data aggregates are projected to              In addition, broadband speed test measurements include
two different grid resolutions: 100m and 1km.                       the download speed, upload speed and ping. cellular and
                                                                    Wi-Fi include signal strength and standard deviation for
The full data gathered across Europe is available in every          each measurements. Moreover, Wi-Fi measurements also
format file and it is released monthly together with new            contain the frequency of the channel and the security type
measurements taken. As further analysis proved, the data            (open/closed). For the first part of the research, all of the
provided from NetBravo is identical from the middle of              features mentioned above were used apart from the coor-
2017 until the current moment of writing. This proved               dinate system. The latter was necessary for the division of
to be an inconvenience since it denied the possibility of           the data provided into data frames corresponding to each
analyzing the evolution of network performance for the              country to answer RQ 2. Table 1 presents the distribution
past few years (RQ 1.1), reducing the effective data set to         of special attributes among data files.
2016-2017.
For the purpose of this research and for all research ques-         3.3    Data distribution
tions, all three types of measurements have been used -             Since an analysis based on the type of connection and
Broad band, cellular, Wi-Fi - but only .csv and .shp files -        technology used is one of the study purposes for this re-
since python is providing good compatibility and manip-             search, we report the data distribution for speed test mea-
ulation for this type of data sets. Lastly, we choose the           surements and signal strength measurements. As Figure
100m grid resolution because it provides the same overview          1 shows, a weak point in the data set is that the low
of network performance as the 1km grid resolution, but it           amount of speed measurement for Wi-Fi 5GHz and cel-
offers more points of measurement for different countries.          lular 2G will not give a proper overview on the general
                                                                    performance of these technologies. On the other hand,
3.2    Data format                                                  Wi-Fi 2.4GHz and cellular 4G are the most commonly
Depending on the type of measurement, the format of the             used in the speed performance data set. As for the signal
data is different among the three types of aggregates. All          strength, all the technologies have enough data points for
aggregates share the following attributes:                          an accurate representation of current network capabilities

                                                                3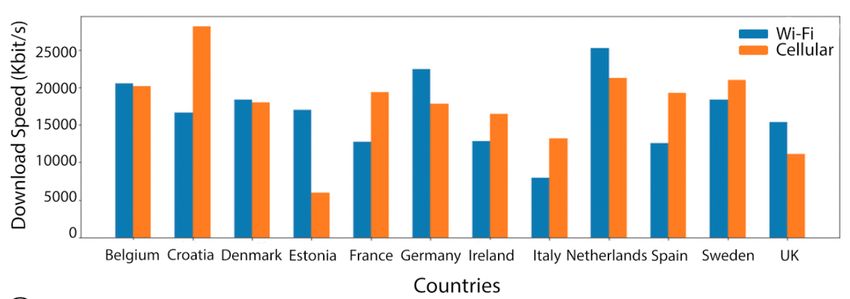
Figure 2. Distribution of upload speed measurements and ping for Wi-Fi and cellular

across Europe. In total, the data set consists of 39,743           ferent technologies and basic statistic measurements have
measurements for speed test and 5,889,108 measurements             been conducted for the values of signal strength. On the
for the signal strength.                                           other hand, the Wi-Fi data has been divided into data
                                                                   frames for each frequency of the signal to verify channel
                                                                   occupancy. A total of 7 frequencies have been selected
4. METHODOLOGY                                                     from the data set based on the number of measurements
4.1 Frameworks                                                     - 2412MHz, 2437MHz, 2452MHz, 2462MHz, 2472MHz,
For the research, python and anaconda platform have been           5180MHz, 5220MHz. Outliers were removed based on the
chosen due to high speed performances, flexibility regard-         same 1.5 IQR rule.
ing data visualization and manipulation, but also access to        The second part of the research focuses on evaluating net-
analytic libraries. Among the libraries used, the most no-         work performances in different countries across Europe,
table ones are numpy and pandas for data manipulation,             so it is necessary to split the data accordingly. The .shp
seaborn and matplotlib for data vizualisation and geopan-          files provided have a special attribute besides the others in
das, shapely and fiona for working with geospatial data            .csv files, namely geometry. This field contains a geomet-
and projections on the grid coordinate system. Geopandas           ric description of the entry in the table based on the grid
library had conflicts with the Windows OS and a virtual            reference system used. The X and Y coordinates create
machine running Ubuntu was necessary to run it in the              a point or a polygon that consists only of that point. In
end.                                                               this sense, the shape of each country can be viewed as a
                                                                   polygon or multi-polygon composed from multiple points.
4.2   Implementation                                               This research uses a .shp file containing Europe borders
There are two main points of focus for the general perfor-         used by the Universitas Tartuensis (Estonia) for an on-
mance test: speed and signal strength.                             line course about geospatial analysis [14]. The geometric
For the speed test measurements, we split the data set into        description of each country was in a different coordinate
different data frames corresponding to Wi-Fi and cellular          reference system that uses longitute and latitute, therefore
measurements. The purpose is to find differences and sim-          it was necessary to project it on the EPSG:3035 grid sys-
ilarities between these types of connection, whether one           tem to correspond with the data. After that, every point
provides higher average speed or lower average ping. As            corresponding to the X and Y coordinates in the data set
a further step, the two data frames have been split again          has been checked if it is within any of the polygons rep-
based on the technology used to see if newer technologies          resenting countries. The data frame has been divided ac-
are able to provide better overall performances. Moreover          cordingly and speed and signal strength analysis was con-
to view the general acceptance and usability among mo-             ducted for different countries. Due to the reduced number
bile devices utilized. A total of 7 data frames have been          of speed measurements, only countries with more that 500
computed in the end, two of them corresponding to Wi-Fi            data points were selected. Considering signal strength,
and cellular connections and the other five correspond-            countries with more that 30000 data points were selected.
ing to each type of technology used - 2.4GHz/5GHz for              In the end, the top 12 countries regarding the number of
Wi-Fi and 2G/3G/4G for cellular. The only available at-            measurements were selected for both test measurements.
tributes for analysis are download, upload and ping. For
each one of them, a weighted average between all the mea-          5.   RESULTS
sured values and the number of measurements for each               As the data set was initially split into Wi-Fi and cellu-
point have been computed alongside basic statistic mea-            lar, experiments illustrate that cellular connections have a
surements such as minimum, maximum, median, standard               slight edge when it comes to download speed, but nothing
deviation, 25th percentile and 75th percentile. The outliers       worth revealing. Moreover, there is not much distinction
have been excluded using the 1.5 IQR rule.                         between the lowest 50 percentage of the measurements for
For the signal strength measurements, the data already             both connections when it comes to upload speed. As Fig-
comes in two different files corresponding to Wi-Fi and            ure 2 reveals, when it comes to the highest 50 percentage,
cellular. For cellular, the data has been divided into dif-        Wi-Fi connections demonstrate better performance. Also,

                                                               4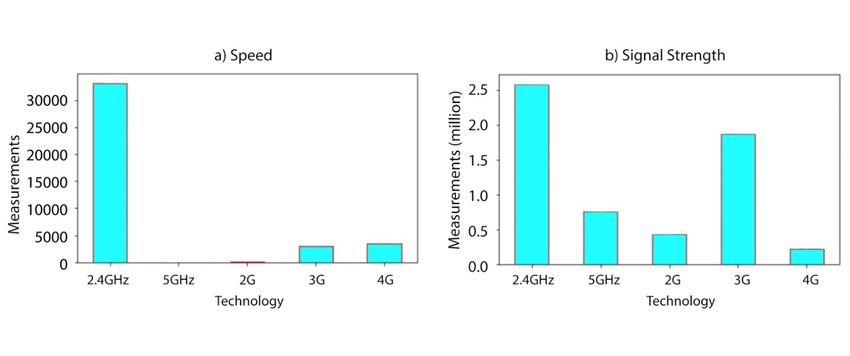
Table 2. Statistic measurements for broadband speed test
                                    Wi-Fi                                           cellular
      Percentile   Download(Mbps) Upload(Mbps) Ping(ms) Download(Mbps) Upload(Mbps)                           Ping(ms)
        25th             3.6              0.8            48             3.4                0.8                    67
        50th             8.5              2.8            67             9.1                2.7                    93
        75th            18.6              8.4           105            20.5                6.6                   151

                                                                       Figure 4. Distribution of Wi-Fi data into channels

Figure 3. Download speed for different technologies in time

in terms of ping, there is no doubt that Wi-Fi has better
results. Actual values of the statistic measurements can
be found in Table 2. An explanation for the ping differ-
ence would be that all technologies for cellular connections
(2G/3G/4G) have been taken into consideration. As ex-
plained in [10], a 2G mobile connection can have a latency
in the range of 300-1000 ms, while the latency for a 3G
connection can be anywhere in between 100-500 ms. Only
4G connection drops below 100ms, but still LTE technolo-
gies have additional latencies to deal with compared to            Figure 5. Distribution of Wi-FI and cellular data for signal
Wi-Fi. These latencies are: Control Plane latency, User            strength
Plane latency, Core network latency and Internet Routing
latency [10].
Furthermore, comparing different types of technologies             performance. Wi-Fi is a local area network (LAN) that has
does not yield any notable result considering the same con-        been designed to provide high speed performance within
nection type. Newer technologies tend to perform better            a short-range (cca. 100m), whereas cellular networks have
than previous ones. Because of the low number of mea-              to provide connection typically in a larger area. Therefore,
surements for Wi-Fi 5GHz and the overall poor quality              it is expected that Wi-Fi signal strength value is contained
of the data set provided, the only interesting aspect is           in a smaller range than cellular. Moreover, 4G infrastruc-
the difference between cellular 4G and Wi-Fi at 2.4GHz             ture is considered to be more stable than Wi-Fi because of
in terms of download speed. As Figure 3 illustrates, in            the transmission medium (copper or optical fibre) and also
2016-2017, 4G download speed fluctuated between 17500-             because the control of frequency for cellular networks is
22500(Kbit/s) on average, which is more than 50% higher            centralized, which makes interferences less likely to occur.
than Wi-Fi 2.4GHz. One of the aspects that can influence           The experiment conducted used 689992 measurements for
the result is the limitation of the performance for Wi-Fi          Wi-Fi and 166340 for cellular. It is worth mentioning that
networks due to the congestion caused by the overcrowded           outliers have been excluded from the data set for both
usage of spectrum band. To further investigate this as-            connection types. The result revealed that Wi-Fi signal
sumption, an evaluation of the channel occupancy has               strength stays inside a 34dBm range, from -102dBm to
been conducted. The results displayed in Figure 4 reveal           -68dBm, while cellular ranges from -107dBm to -48dBm.
that the most used channels are 1 (2412MHz), 11(2462MHz)           For Wi-Fi, typically a signal strength better than -80dBm
and 6(2437MHz) with 21.58%, 18.92%, respectively 18.26%            in required for basic connectivity, while for 3G the thresh-
of the measurements using these channels, all the others           old is at -100dBm, respectively -112dBm for 4G. Also, it
falling below 5%. Considering the fact that only these             is worth mentioning that the signal strength received de-
3 channels do not interfere with each other and Wi-Fi              pends on the hardware of the mobile device used. The
routers automatically select one of them upon initial setup,       distribution of the data shown in Figure 5 reveals that
most devices operate on these channels at the same time            exactly 75% of the Wi-Fi measurements fail to pass the
which can lead to poor performance results compared to             -80dBm target, whereas only 32% are below -100dBm for
LTE networks.                                                      all cellular measurements.
One last aspect to discuss is the comparison between the           Now, moving onto the country-based analysis, the results
two type of connections with regard to the signal strength         in Figure 6 demonstrate that northern countries, and de-

                                                               5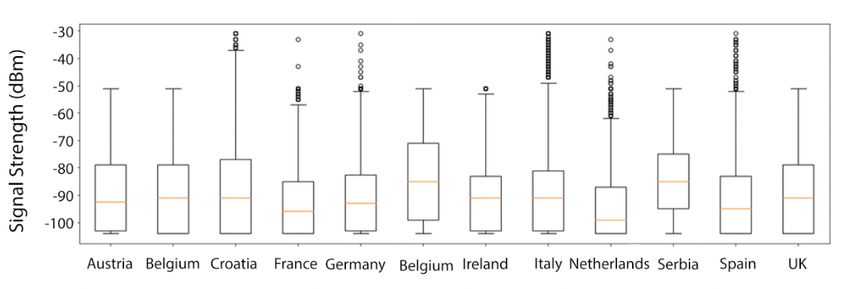
Figure 6. Speed performances for different European countries
Table 3. Signal strength performance for different European countries
Country Cellular(dBm) Wi-Fi(dBm) Open Wi-Fi(dBm) Closed Wi-Fi(dBm)
Austria -92.36 -79.89 -75.47 -80.85
Belgium -98 -82.21 -81.29 -82.51
Croatia -90.11 -83.93 -79.69 -84.33
France -94.27 -81.63 -81.55 -81.66
Germany -88.97 82.51 -81.00 -82.84
Greece -80.39 -81.19 -78.71 -81.77
Ireland -87.79 -81.28 -79.04 -81.73
Italy -94.01 -82.92 -80.84 -83.37
Netherlands -95.28 -81.67 -81.01 -81.79
Serbia -93.59 -82.81 -79.65 -83.42
Spain -90.42 -81.73 -79.45 -82.09
UK -92.45 -80.11 -79.72 80.23
veloped countries in general, excel in overall speed mea- On the other end of the comparison, Croatia, Italy, France
surements, with Netherlands having the best performances and Spain have faster cellular connection. Croatia’s down-
with an average download speed of 24.7 Mbps and upload load speed for this type of connection is 59% higher than
speed of 12.4 Mbps for all types of connections. Denmark its Wi-Fi capabilities. Another research on crowd-sourced
and Sweden also have high download speed, 18.3 Mbps data from OpenSignal was performed by Fogg [8], but the
and respectively 18.8 Mbps, which is lower than the av- experiments conducted yield different results for the coun-
erages of Germany, Belgium or Croatia, but the upload tries analyzed in this research. For all the countries with
speed exceeds other European countries. The experiment higher cellular speed mentioned above, apart from Croatia,
conclusions align with the statistics from OECD regard- the data set used by Fogg proved the contrary. The gap
ing ICT access and usage by households and individuals between the Wi-Fi performance and cellular performance
[1]. Countries with a higher number of users and per- can depend on multiple factors such as the power of fixed
centage of population that constantly utilize internet and networks, since Wi-Fi relies on it to provide Internet con-
communication technologies tend to have better network nection, or a more developed network infrastructure since
improvement policies and as a result, better performance. it is an indicator of investment power of MNO. For further
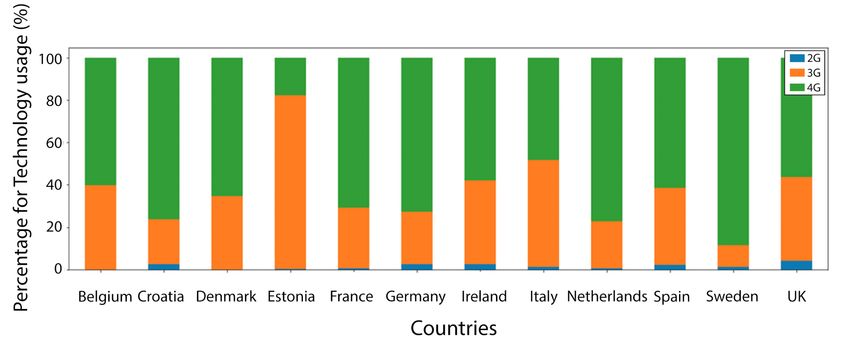
On the other hand, there are differences with regard to sig- analysis, Figure 8 displays the distribution of measure-
nal strength performance. In this case, the top 12 coun- ments for different cellular technologies. Again, Sweden
tries based on the number of measurements are within (88.65%), Netherlands (77.34%) and Croatia (76.52%) are
4dBm radius from each other when it comes to Wi-Fi sig- among the top countries when it comes to 4G usage for
nal strength. All the averages orbit around the -80dBm mobile devices data used by this research. Now, looking
mark for usable connectivity. On the other hand, there at the cellular performance in terms of speed (Figure 7)
are variations of the cellular signal strength across these and the distribution of measurements based on technology
countries, but all the averages land in the -98dBm and used (Figure 8), it is clear that countries able to provide
-80dBm range. Full results can be seen in Table 3. better 4G coverage have better network performance re-
Regarding the difference in download speed between Wi- sults.
Fi and cellular networks for different countries, there is Some other interesting results concern the distribution of
no clear pattern emerging from the data set. Figure 7 signal strength measurements and the difference in sig-
shows that Netherlands, Germany and Belgium are the nal strength for open Wi-Fi against closed Wi-Fi. When
best performing countries when it comes to Wi-Fi connec- talking about Wi-Fi signal strength, the experiments illus-
tions, having an average download speed of 25.2 Mbps, trate that 75% of all the measurement for every country lie
22.4 Mbps, respectively 20.5 Mbps. Also, these countries within the range of -83dBm and -77dBm, but medians are
have better performance on Wi-Fi connection than on cel- at most 2dBm apart from each other. On the other hand,
lular connection. Experiments provided similar results for Figure 9 shows that cellular measurements are distributed
upload speed regarding countries with best performance. more widely and are much dependent on the country. Con-
6Figure 7. Download speed of Wi-Fi and cellular networks for different European countries
Figure 8. Distribution of cellular data into technology usage
sidering the security type of Wi-Fi connections, Table 3 is delivering better speed performances on average than
reveals that open Wi-Fi performs better than its counter- Wi-Fi 2.4GHz, followed by 3G. As can be seen in Figure
part in all of the cases, but there is a maximum of 5dBm 2, an important aspect is that Wi-Fi technologies reached
difference in the worst case. It is a surprising result con- higher upload speed than cellular, even though the average
sidering that closed Wi-Fi usually has a limited number of is lower. Not the same can be said about ping, where
devices connected at the same time, whereas open Wi-Fi is 26% of the Wi-Fi measurements had lower than 50ms,
deployed in public spaces where everyone can connect. It whereas only 10% of the cellular measurements reached
is worth mentioning that around 73% to 92% of the data this threshold. The results illustrate that 75% of the Wi-
provided is based on closed connections, so only a small Fi measurements fail to pass the -80dBm target for basic
percentage of data is collected from open connections. A connectivity, whereas only 32% of the measurements are
total of 457768 measurements for open Wi-Fi and 2011422 below -100dBm threshold for all cellular measurements.
measurements for closed Wi-Fi have been used. For RQ 1.3, the data set proved that cellular 4G is provid-
ing the best speed features, with twice as much download
6. DISCUSSION speed than the next best-performing technology and 1.6x
Based on the results of the experiments conducted, a dis- the upload speed. Also, considering the average signal
cussion with regard to the research questions is relevant. strength of -90.53dBm for 4G technology, it can be said
Note that not all of the results presented in this section that it provides very good signal in general.
have a visualisation. Instead, we utilized the actual re-
Lastly, for RQ 2, the speed performance for all connections
sults to create the figures displayed since we considered
heavily depend on the country of speaking. As presented
they provide a more representative visualisation for the
in Figure 6, northern countries like Netherlands, Sweden
research goals. References of available figures will appear
and Denmark, illustrate the best performance, followed
whenever an observation corresponds to one of them.
by other highly developed countries like Germany, France
That being said, for RQ 1.1, the data showed in Figure 3 or Belgium. Among these countries, some of them have
illustrates that Wi-Fi 2.4GHz experienced a 25.53% in- faster Wi-Fi connection, whereas others rely on faster cel-
crease in download speed from August 2016 until July lular connection, as presented in Figure 7, so there is no
2017, whereas cellular 4G growth was only 11.02%. As correlation between the overall speed performance and the
for upload speed, Wi-Fi 2.4GHz gained 26.83% increase in faster type of connection. However, comparing the results
upload speed, whereas cellular 4G improved by 11.03%. displayed in Figure 7 and Figure 8, countries with better
In terms of ping, Wi-Fi 2.4GHz experienced a drop of cellular 4G coverage and infrastructure have better net-
56.32% and 4G suffered a 27% increase. As for the signal work performance. Talking about signal strength, all the
strength, there are no notable differences for Wi-Fi con- countries studied in this research are within a 4dBm range
nections, both of them having around -83dBm on average of each other for Wi-Fi connections, all of them having
during this period. On the other hand, the signal strength around -80dBm on average. On the other hand, cellu-
for cellular technologies increased by 2.1dBm, 3.37dBm lar signal strength varies in a wider range, -98dBm and
and 8.04dBm for 2G, 3G, respectively 4G, which might -78dBm as it can be seen in Figure 9.
indicate an improvement in the infrastructure. The final
values, in the same order, are: -90.79dBm, -91.49dBm, 7. CONCLUSIONS & FUTURE WORK
-90.53dBm. In this paper, we investigate the crowd-sourced data set
For RQ 1.2, the experiments have showed that cellular 4G from NetBravo and present a general overview of network
7Figure 9. Distribution of cellular data for different countries
performance, as well as a country-wise overview. We eval- [5] E. Ezhilarasan and M. Dinakaran. A review on
uate the speed performance in terms of download, upload mobile technologies: 3g, 4g and 5g. In 2017 second
and ping. In addition to signal strength, we consider fea- international conference on recent trends and
tures like frequency and security type for Wi-Fi connec- challenges in computational models (ICRTCCM),
tions. pages 369–373. IEEE, 2017.
For the general overview, our findings show an improve- [6] G. P. Ferreira, L. J. Matos, and J. M. Silva.
ment in both download and upload speed for both type of Improvement of outdoor signal strength prediction
connections, with Wi-Fi connections experiencing a higher in uhf band by artificial neural network. IEEE
gain percentage-wise than cellular connections. On the Transactions on Antennas and Propagation,
other hand, when it comes to ping, Wi-Fi achieved better 64(12):5404–5410, 2016.
results, whereas cellular performance dropped over time. [7] M.-R. Fida and M. K. Marina. Impact of device
With regard to signal strength, there are no changes in diversity on crowdsourced mobile coverage maps. In
the performance of Wi-Fi connections, whereas there is a 2018 14th International Conference on Network and
slight improvement for cellular connections. Overall, the Service Management (CNSM), pages 348–352.
results reveal that cellular 4G has the highest download IEEE, 2018.
speed and upload speed among all other technologies, both [8] I. Fogg. The state of wifi vs mobile network
cellular and Wi-Fi. experience as 5g arrives. In Technical Report.
OpenSignal, 2018.
When it comes to the country-wise analysis, results sug-
gest that northern countries alongside other highly devel- [9] P. Fraccaro, M. Benatan, K. Reusch, C. Fare,
oped countries achieve better network performance. The B. Edwards, and E. Pyzer-Knapp. Modelling mobile
usage of newer technologies and better coverage leads to signal strength by combining geospatial big data and
better results. Also, open Wi-Fi connections performed artificial intelligence. In Proceedings of the 2020 4th
better than closed Wi-Fi connections in all of the coun- International Conference on Vision, Image and
tries studied, but it is necessary to keep in mind that Signal Processing, pages 1–5, 2020.
signal strength received depends on factors such as the [10] I. Grigorik. High Performance Browser Networking:
hardware of the mobile device used. Crowd-sourced data What every web developer should know about
is influenced by these kind of factors, therefore different networking and web performance. O’Reilly Media,
data sets might yield different results. Inc., 2013.
[11] J. Johansson, W. A. Hapsari, S. Kelley, and
One of the main goals of this research was to provide a
G. Bodog. Minimization of drive tests in 3gpp
temporal analysis of the data to reveal the evolution of the release 11. IEEE Communications Magazine,
network performance in the past years. NetBravo data set 50(11):36–43, 2012.
narrowed down this possibility to only 2016-2017 since all
[12] A. Lutu, D. Perino, M. Bagnulo, E. Frias-Martinez,
the releases after the middle of 2017 have no additional
and J. Khangosstar. A characterization of the
measurements. Also, the low amount of speed measure-
covid-19 pandemic impact on a mobile network
ments for Wi-Fi 5GHz, cellular 2G and cellular 3G are
operator traffic. In Proceedings of the ACM Internet
insufficient to provide relevant information for these tech-
Measurement Conference, IMC ’20, page 19–33, New
nologies. Having these limitations in mind, a future im-
York, NY, USA, 2020. Association for Computing
provement of the current research would be to perform the
Machinery.
analysis again once additional information from NetBravo
is available. [13] netBravo. ”http://netbravo.jrc.ec.europa.eu/”.
[14] U. Tartuensis.
”https://kodu.ut.ee/ kmoch/geopython2019/L2/crs-
8. REFERENCES projections.html”.
[1] ”https://www.oecd.org/sti/broadband/broadband-
statistics/”. [15] H. Viswanathan and M. Weldon. The past, present,
[2] D. Astély, E. Dahlman, A. Furuskär, Y. Jading, and future of mobile communications. Bell Labs
M. Lindström, and S. Parkvall. Lte: the evolution of Technical Journal, 19:8–21, 2014.
mobile broadband. IEEE Communications [16] D. Wang, D. Chen, B. Song, N. Guizani, X. Yu, and
magazine, 47(4):44–51, 2009. X. Du. From iot to 5g i-iot: The next generation
[3] A. Berisha-Shaqiri. Impact of information iot-based intelligent algorithms and 5g technologies.
technology and internet in businesses. Information IEEE Communications Magazine, 56(10):114–120,
technology, page Q2, 2014. 2018.
[4] E. Commision. ”https://inspire-ec-europa-
eu.ezproxy2.utwente.nl/id/document/tg/gg”.
8You can also read