Analytical Methods - RSC Publishing
←
→
Page content transcription
If your browser does not render page correctly, please read the page content below
Volume 13
                                                                             Number 33
                                                                             7 September 2021

Analytical
                                                                             Pages 3635–3736

Methods
rsc.li/methods

                 ISSN 1759-9679
                                                                                   lin d in

                 PAPER
                                                                                      e!

                 Panayot Petrov, Simon Cowen and Heidi Goenaga-Infante
                                                                                ed xe

                 On-column internal standardisation as an alternative
                                                                               M nde

                 calibration strategy for speciation analysis: feasibility
                 demonstration through analysis of inorganic As in rice
                                                                               I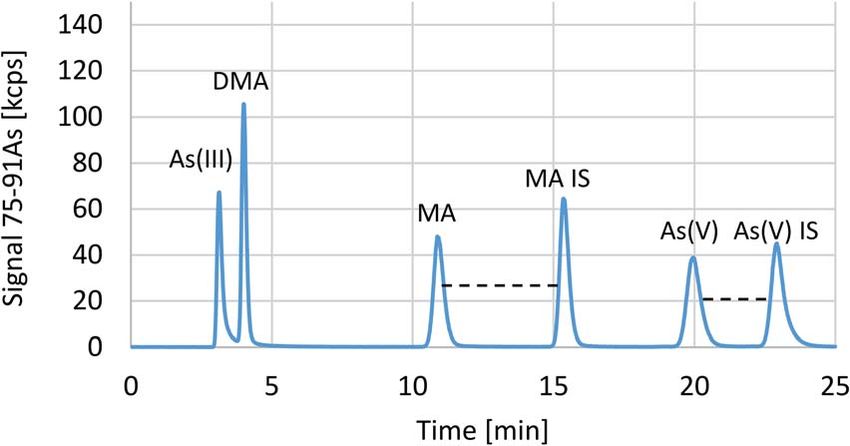
Analytical
                                                                                                              Methods
          This article is licensed under a Creative Commons Attribution-NonCommercial 3.0 Unported Licence.

                                                                                                                                                                                                                                           View Article Online
                                                                                                                 PAPER                                                                                                                     View Journal | View Issue

                                                                                                                                                         On-column internal standardisation as an
                                                                                                              Cite this: Anal. Methods, 2021, 13, 3641
                                                                                                                                                         alternative calibration strategy for speciation
                                                                                                                                                         analysis: feasibility demonstration through analysis
Open Access Article. Published on 07 July 2021. Downloaded on 09/19/2021 05:50:24.

                                                                                                                                                         of inorganic As in rice†
                                                                                                                                                         Panayot Petrov,            * Simon Cowen and Heidi Goenaga-Infante

                                                                                                                                                         Species-specific isotope dilution mass spectrometry (SS-IDMS) has been the calibration method of choice
                                                                                                                                                         for high accuracy speciation analysis because it can correct for detector sensitivity drifts, matrix effects, and
                                                                                                                                                         analyte loss during sample preparation and analysis. However, in many cases SS-IDMS calibration is either
                                                                                                                                                         not applicable (e.g. for monoisotopic elements) or not feasible (e.g. limited by the cost and availability of
                                                                                                                                                         like-for-like isotopically enriched species). The work presented here demonstrates the potential of
                                                                                                                                                         a novel on-column species-specific internal calibration approach, which is based on the
                                                                                                                                                         chromatographic injection of the same species of the analyte as the internal standard (IS), after the
                                                                                                                                                         sample injection. It can compensate for on-column analyte losses and signal drift and can be applied
                                                                                                                                                         with any detector capable of recording time-resolved data, provided that enough species resolution can
                                                                                                                                                         be achieved. The feasibility of this novel calibration strategy for accurate quantitative elemental
                                                                                                                                                         speciation in complex matrices is demonstrated here through the analysis of inorganic arsenic in rice. An
                                                                                                              Received 22nd April 2021
                                                                                                              Accepted 6th July 2021
                                                                                                                                                         expanded uncertainty (k ¼ 2) of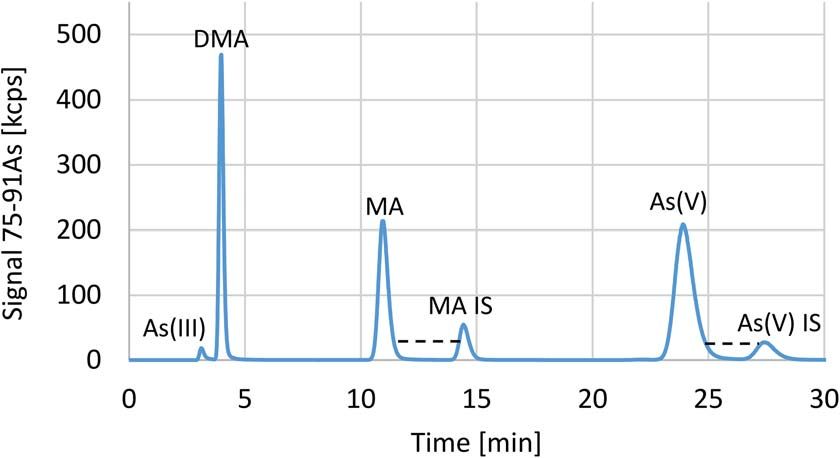
View Article Online
Analytical Methods Paper
analytes. Clearly, such approach does not exclude the possibility effects.4,9,17 Yet, all of the above being post-column corrections,
of the results in agreement being equally wrong. In contrast to they do not correct for any adverse effects accompanying the
total elemental determinations, for speciation analysis separation process. When samples with complex matrices are
a smaller number of species are usually applied as internal analysed, some of the target species can be either signicantly
This article is licensed under a Creative Commons Attribution-NonCommercial 3.0 Unported Licence.
standards. Fundamentally, there is no limitation for the more strongly retained on the separation column or eluted
number of elements that can be used as internal standards with earlier compared to the respective standards. Additionally, peak
multi-element detectors like ICP-MSs or ICP-OESs, provided splits have been reported. These have led to large ambiguity in
that (1) the IS does not react with the sample components or the species identication. Moreover, quality controls based on mass
mobile phase and (2) the detector is fast and sensitive enough to balance calculations will be blind to such adverse effects. As
record the transient signal with sufficient frequency and a consequence, the species-specic on-column losses are not
stability. compensated for by the common IS approaches and may
Open Access Article. Published on 07 July 2021. Downloaded on 09/19/2021 05:50:24.
The two approaches used for internal standardisation in negatively bias the results for the species of interest.16
speciation analysis are continuous IS and discrete IS.7 A sche- In order to minimise the impact of the discussed potential
matic diagram summarising the type of IS by point of intro- sources of bias on the accuracy and precision of the speciation
duction is presented in the ESI† (Diagram 1). The former data, we propose a novel on-column species-specic internal
(continuous IS) relies on constantly supplying a suitable and standardisation approach as an alternative to SS-IDMS, the
xed amount and ow of element(s), which is merged with the former being particularly attractive for mono-isotopic elemental
analyte ow before reaching the detector. The disadvantage of species. With this approach, the dri effect is monitored and
this approach is the same as discussed above for total element corrected for on a sample-to-sample basis. Both the analyte and
determination, i.e. the difference in the behaviour of elements/ internal standard are the same species, thus minimising the
species used as IS and the species of interest.8–10 The second issues related with different species behaviours. The feasibility
approach (discrete IS) has several modications, depending on of this novel calibration strategy for accurate quantitative
how the IS has been introduced (e.g. within each sample as elemental speciation in complex matrices is investigated here
a surrogate standard or post-column). Details on the different through the analysis of i-As in rice samples in support of EU
types of internal standardisation approach are readily available Commission Regulation 2015/1006.18 The method accuracy was
in the literature.11–14 In summary, the post-column set-up assessed through analysis of certied reference materials and
includes a switching valve, positioned on the sample ow by recovery experiments on spiked samples. A full uncertainty
line, aer the separation module (e.g. chromatographic budget indicating the main contributing factors has been esti-
column). An injection loop is lled with IS, which is then mated and reported. Moreover, the capability of the method to
injected into the effluent. The two main types of discrete post quantify more than one species under non-isocratic conditions
column internal standardisation then are (1) IS injection was investigated through simultaneous determination of i-As
immediately aer the sample injection within a couple of and Methyl Arsonate (MA) in a standard mixture submitted to
seconds delay, needed for baseline estimation,7 and (2) IS the same preparation procedure as the rice sample.
injection aer the elution of the strongest retained species. In
both cases, the advantage of this approach compared to
Experimental
continuous IS is that the same element and even the same
species can used as IS. It is possible to have more than one Authors' note: The instruments' makes and models presented
species as an internal standard by using an array of switching in this work are for example purposes only. Similar performance
valves or even performing IS with MSA.15 For example, one of the can possibly be achieved with instrumentation produced by
IS species could be injected at the beginning of the separation other manufacturers.
and one at the end, although IS injections can be done so to
elute at other retention times where no analytes are present. General set-up for on-column IS
However, many researchers prefer to use only one species with
In this work the potential of a novel on-column calibration
ICP-MS detection, assuming equal species behaviour irre-
approach is demonstrated through the analysis of i-As in rice
spective of their different volatility and therefore transport
extracts by employing anion-exchange liquid chromatography
efficiency to the plasma. With more and more reports on species
dependent ICP-MS sensitivity being published,16 the preferred
option has shied towards the use of an “average” internal
standard consisting of species with sensitivity in-between the
sensitivities of the other species of interest and if feasible, with
similar chemical behaviour. Alternatively, the most abundant
species or the species of particular scientic interest can be
used as IS to minimise the bias from the inadequate IS
correction. By employing these strategies, alone or in combi-
Fig. 1 Instrumental setup for on-column IS calibration. (A) The sample
nation with MSA calibration, many of the known sources of bias is injected into the column while the loop is filled with IS. After a user
can be efficiently mitigated. These include moderately sized low defined delay (time buffer) the valve is switched to position (B),
frequency noise (e.g. small sensitivity dri) and some matrix injecting the IS into the column.
3642 | Anal. Methods, 2021, 13, 3641–3648 This journal is © The Royal Society of Chemistry 2021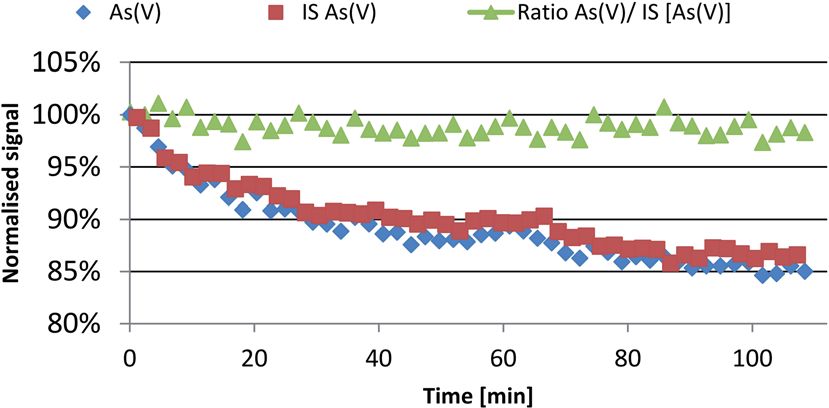
View Article Online
Paper Analytical Methods
for the species separation and ICP-MS for their quantication. performed better with lower signal RSDs for ows below 900
The instrumental setup schematics are presented in Fig. 1. mL min1 and Conikal (Crawford Scientic) was used for ows
With this setup, the analyst can set the injection time and of 1 mL min1 and above.
therefore precisely position the IS peak within the chromato-
This article is licensed under a Creative Commons Attribution-NonCommercial 3.0 Unported Licence.
gram for each particular speciation analysis. Since the valve is HPLC parameters and settings
connected before the separation column, the operator should
An Agilent 1260 Innity Bio-inert HPLC system (Agilent Tech-
ensure that its operational pressure exceeds the separation
nologies, Cheadle, UK), consisting of a HiPs autosampler
column backpressure. This is a clear difference with the post-
(G5667A) and bio-inert pump (G5611A), was used for the
column IS approach, for which low-pressure valves can be
determination of i-As in rice extracts. The sample was injected
used. Such a high pressure valve can be integrated inside the
through the autosampler 6-port valve and directed to a strong
liquid chromatography (HPLC) compartment or be positioned
anion exchange column (AEC) where i-As species separation was
Open Access Article. Published on 07 July 2021. Downloaded on 09/19/2021 05:50:24.
just before the analytical column. Finally, the mass fraction of
completed. The chromatographic conditions and the separa-
the analyte in the sample is calculated based on eqn (1) below:
tion method are shown in Table 2. The listed alternative
As parameters provide six fold quicker separation at the expense of
Cs ¼ a þb (1)
AIS slightly impaired arsenic species resolution, particularly for the
As(III)/DMA pair. However, when As(III) is converted to As(V), as is
Eqn (1) is used for the calculation of the analyte mass frac- done in this work, these were the preferable separation condi-
tion via on-column internal standardisation with a linear cali- tions (please refer to the Results and discussion section, below).
bration curve, where CS is the mass fraction of the analyte, a and A bio-inert valve (600 bar, 6-ports, two positions) was
b are the slope and intercept of the built linear calibration curve installed on automatic valve driver 1290 Innity model G1170A
and AS and AIS are the peak areas of the analyte and internal (both obtained from Agilent Technologies, Cheadle, UK) and
standard, respectively. The calibration curve is built once, in the used for the on-column IS injection. The valve was equipped
beginning of the analysis, to calculate parameters a and b using with sampling loops made of PEEK tubing with nominal
linear regression (Y vs. X). For this purpose, the ratios of the volumes between 20 and 1000 mL. The internal standard (stored
peak areas of calibration standards to the injected (see Fig. 1) in a 250 mL PTFE container, see Fig. 1) was delivered through
internal standards peak areas (ratio plotted on axis Y) for each a secondary medium pressure pump (model P 4.1S, Knauer,
calibration standard level are plotted against the respective Northampton, UK) with a nominal ow rate of 20 mL min1. The
calibration standard concentrations (plotted on axis X). By IS container lid was pierced at two positions to (1) allow tting
using MS Excel© array function Linest for Y vs. X, a and b are of the 1/1600 IS pump inlet tubing, along with (2) another small
calculated. More details are presented in the Results and (1/1600 ) hole for pressure equilibration. The plumbing sche-
discussion section. matics are presented in Fig. 1.
Detector parameters and settings Reagents and sample preparation
For the determination of i-As in rice, a tandem ICP-MS (Agilent Unless otherwise stated all reagents are of analytical grade
8800 ICP-MS/MS, Agilent Technologies, Tokyo, Japan), operated quality or better, and were prepared using 18.2 MU cm UHP
by the Agilent MassHunter soware package (Version C.01.05, water (Elga, Veolia, High Wycombe, UK).
2019), was used for the data collection and manual peak inte- Concentrated nitric acid UpA grade (mass fraction w(HNO3)
gration. The ICP-MS parameters are summarized in Table 1. $ 63%, density of r(HNO3) ¼ 1.4 g mL1) and hydrogen
The acquired data (as peak areas) were processed using peroxide UpA grade (w(H2O2) $ 30%) were both purchased from
laboratory developed MS Excel™ spreadsheets. Two different Romil (Cambridge, UK). A mixture of 2% v/v HNO3 and 1% v/v
types of nebuliser have been used depending on the required H2O2 in water was then used for the extraction of i-As from 0.5 g
ow; Micromist (Crawford Scientic, Strathaven, Scotland) rice sample (90 C for 4 hours). The extracts were ltered
through 0.22 mm syringe lters (33 mm, PES, Starlab Ltd, Milton
Keynes, UK) and neutralised with 1 : 1 v/v diluted ammonia
Table 1 ICP-MS settings for the determination of i-As in rice extracts (32%, HiPerSolv, VWR, Leighton Buzzard, UK) to a pH of 9.0
by on-column IS calibration 0.5. Ammonium bicarbonate (Fluka, Sigma-Aldrich, Gilling-
ham, UK) was dissolved in water (concentrations detailed in
RF power 1600 W
Table 2) and the pH was adjusted to 9.0 0.2 with 1 : 1 (v/v)
Carrier Ar ow rate 850 mL min1
Makeup/dilution gas 280 mL min1 ammonia. The pH was measured using a FisherBrand Hydrus
Sample/skimmer cones Ni/Ni 300 pH meter (Fisher Scientic, Leicestershire, UK). Methanol
Spray chamber temp. 2 C (Romil low metal, Spa, Romil, Cambridge, UK) was nally added
Reaction gas (ow) O2 (30% setting; 3 mL min1) to the solution to a nal concentration of 1% (v/v). The solution
Data acquisition mode TRA
was used both as a mobile phase and diluent, and for internal
Points per spectral peak 1
Acquisition mode Tandem MS standard preparation for the on-column IS calibration. The total
Monitored mass-shi 75
As–75As16O (m/z 75–>91) dilution factor for both the samples and the matrix CRMs (see
Integration time 0.3 to 1.0 s (HPLC method dependent) below) was 40 (1 + 39 w/w 2%). Sodium Arsenate CRM 7912-
This journal is © The Royal Society of Chemistry 2021 Anal. Methods, 2021, 13, 3641–3648 | 3643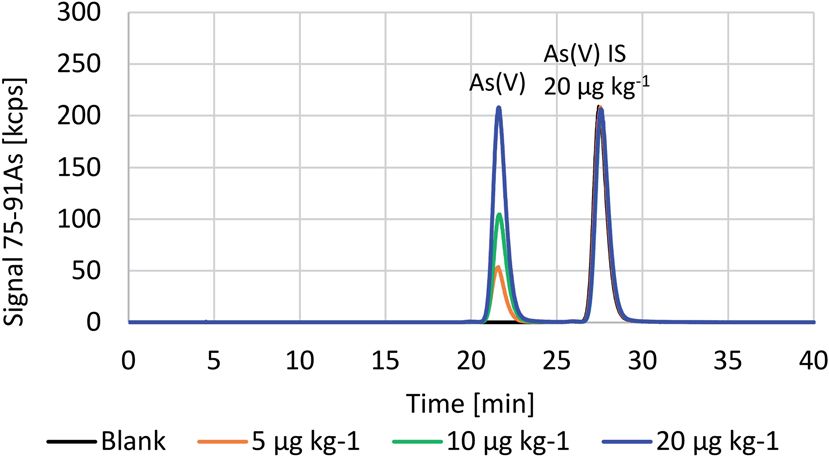
View Article Online
Analytical Methods Paper
Table 2 HPLC settings for the determination of i-As in rice extracts by on-column IS calibration. The typical separation parameters are followed
by the alternative (in parentheses), suitable for rapid separations
AEC column PRP-X100, 250 mm 4.1 mm id 10 mm (PRP-X100, 50 mm 4.1 mm id 5 mm)
Separation mode Isocratic
This article is licensed under a Creative Commons Attribution-NonCommercial 3.0 Unported Licence.
Eluent 37 mM (55 mM) NH4HCO3 in 1% v/v CH3OH, pH(9)
Eluent ow 0.8 mL min1 (1 mL min1)
Column temperature 22 2 C
Autosampler temperature 22 2 C
Sample throughput rate 1.5 (7.5) per hour
a (NMIJ, Tsukuba, Japan) and sodium arsenate dibasic hepta- a blank, obtained with the on-column injection setup and ICP-
Open Access Article. Published on 07 July 2021. Downloaded on 09/19/2021 05:50:24.
hydrate (99.995% trace metal basis, Sigma-Aldrich, Dorset, UK) MS/MS detector. In this case (for demonstration purposes only)
were used for the preparation of the calibration standard and IS, the IS concentration was chosen to match the highest calibra-
respectively. Certied for i-As reference materials of white rice tion standard concentration.
(ERM BC211, 124 11 mg kg1, k ¼ 2) and brown rice (NMIJ The ratio between the As(V)-analyte peak area (obtained from
7532-a, 298 8 mg kg1, k ¼ 2) were both purchased from LGC the calibration standard) and As(V) peak area (obtained from the
Ltd (LGC, Teddington, UK) and used as quality control samples internal standard; As(V)-IS) is then plotted against the calibra-
for the demonstration of the method trueness. Baby rice food tion standard concentration and a typical calibration curve is
products (ground rice >99%) were purchased from local grocery built. The analyte concentrations are calculated from the ob-
stores in the UK. The moisture content of these samples was tained slope and intercept. Using this calibration strategy, the
determined by drying a 0.5 g subsample in an oven at 103 2 C calibrations were linear in the range 25 ng kg1 to 25 mg kg1, at
until constant weight, following the procedure described in the the instrument, with the squared Pearson coefficient (r2)
ERM BC211 certicate. exceeding 0.9998. If raw peak areas were used instead of on-
column IS, the measurement accuracy would be signicantly
impaired due to the presence of dri. As an example, in one
Results and discussion particular case when the sensitivity dri reached approximately
Evaluation of method performance with As standard solutions 15% over the course of analysis, the linearity of the external
calibration was signicantly impaired and this led to lower r2
The on-column IS calibration follows the same calculation
(0.998) and further biased results up to 15%.
procedure for species quantication as the other, typical,
Fig. 3 presents the signal variation with time from 50 injec-
internal standardisations (see eqn (1)). The ratios of the signals
tion pairs of 20 mL 2.5 mg kg1 As(V) standard and 2.5 mg kg1
of the calibration standards to internal standards, both as peak
As(V) internal standard represented with blue and red markers,
areas, are used to build a linear calibration, and those of the
respectively. The ratio between the analyte and IS (green trian-
samples to internal standards, to calculate the analyte mass
gles) was plotted against time and no statistically signicant
fraction. In the example below, the actual chromatographic
time dependence was found, although as evident from the
analyte is the As(V) species. Since the extraction of the arsenic
gure the signal intensity dried by more than 15% from its
species from rice samples is performed in the presence of 1% (v/
initial value, similarly to the discussed example above. The
v) H2O2 at elevated temperature (see the Reagents and sample
analyte to IS peak area ratio distribution had no signicant
preparation section), the As(III) species oxidise completely to the
deviation from the normal Gaussian prole. The slope of this
measured As(V), and this peak effectively represents the total i-
ratio with time was in the order of 104 per injection when
As in the sample. Therefore, for these analyses the calibration
a linear tting was used, which demonstrates excellent dri
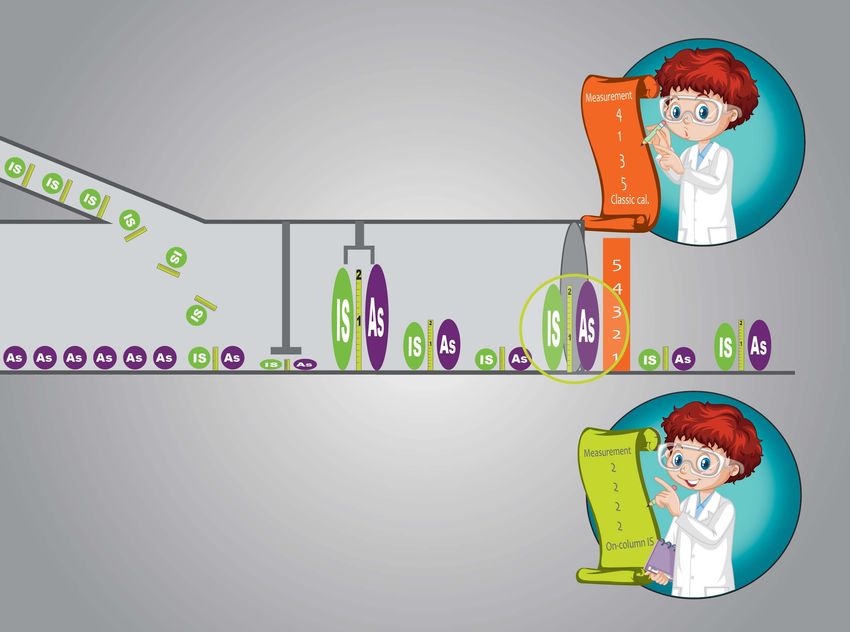
is based on arsenate standards only. Fig. 2 shows overlaid
correction and no linear time trends. The RSD ratio was below
chromatograms of a series of As(V) calibration standards and
Fig. 2 Overlaid chromatograms of a series of As(V) calibration stan- Fig. 3 Efficient correction of significant sensitivity drift by the on-
dards measured with on-column IS. column internal standardisation approach.
3644 | Anal. Methods, 2021, 13, 3641–3648 This journal is © The Royal Society of Chemistry 2021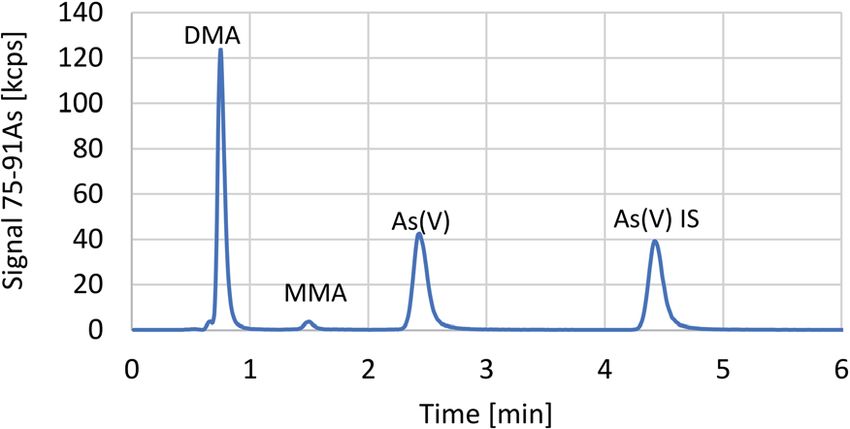
View Article Online
Paper Analytical Methods
1% in this case. Discussion on the signicance of this value can signals (peak areas) and therefore the calculated u(T) uncer-
be found in the uncertainty estimation section below. tainty includes not only the intended to measure volume
Similarly to SS-IDMS calibration, the value of the analyte-to- uncertainty u(V) but also the uncertainties of two additional
internal standard ratio can affect the accuracy of the quantita- components – the uncertainty of the dri correction u(Dr) and
This article is licensed under a Creative Commons Attribution-NonCommercial 3.0 Unported Licence.
tive speciation data. In this work we have investigated this effect uncertainty of the ICP-MS/MS signal measurement u(M). The
within the range from 1 : 4 to 4 : 1. The relative standard latter consists of the uncertainty of signal variation and the
recoveries of reagent blanks spiked with As(V) standards were uncertainty of the data integration. Therefore, the volume
between 99.5% and 100.9% (ESI Fig. 1†). The latter results uncertainty can be calculated using eqn (2).
conrm that an exact analyte-to-IS signal matching is not
essential to achieve calibration uncertainties in this range (1%), u2(V) ¼ u2(T) u2(S) u2(I) (2)
which also agrees with the ndings by Yuzuru and Matsuda14
Eqn (2) is used for the calculation of the sample and internal
Open Access Article. Published on 07 July 2021. Downloaded on 09/19/2021 05:50:24.
who obtained similar uncertainty using conventional IS cali-
bration. The described order of injections of sample and IS in standard injection volume uncertainties, where u(S) and u(I) are
this work can be swapped and the IS could be injected before the standard uncertainties of the ICP-MS signal and integration,
the sample. This would allow for mixing of the IS with the non- respectively, and u(T) is the combined, total uncertainty. Since
retained components of the sample matrix providing similar (or the u(Dr) component is not accounted for in the equation above,
potentially even better) correction of the matrix effects. Addi- it should be noted that it is still present in the calculated u(V). As
tionally, this approach would be benecial if there is a co- for the relative u(S) and u(I), values of 0.45% and 0.09% have
eluting peak at the analyte's tail but not a fronting one (reso- been obtained. These uncertainty sources are uncorrelated;
lution R > 2 requirement, see section Feasibility of application therefore, covariance terms do not need to be included. Based
to more than one As species, below) expanding the applicability on this, u(V) was calculated to be 0.625% and 0.627% for the
of the approach to more complex samples. Unfortunately, most sample and for the internal standard injections, respectively.
of the commercial LC control soware do not provide an easy These values are sufficiently low and the u(Dr) contribution can
option for valve control prior to the sample injection (see Fig. 1) therefore be ignored.
and therefore this approach has not been further pursued. Uncertainty from the calibration curve. A linear calibration
curve was built using the ratios of calibration standard peak
areas to internal standard peak areas across a range of
Measurement uncertainty estimation concentrations. The range in this case was selected to well cover
Uncertainty from injected volumes. To achieve high accuracy the expected concentration of i-As in rice materials and other
and low uncertainty quantications by on-column IS, consistent analysed in-house liquid samples (0.1 to 10 mg kg1 As). The
volumetric injections of both the sample and the IS are of measurement uncertainty from the calibration in the range 0.1
paramount importance. Although the uncertainties of the to 10 mg kg1 As was estimated from the triplicate injections of 7
injected volumes for the sample and for the internal standard inorganic arsenic calibration standards and 3 blanks. An
were expected to be negligible compared to the remaining unweighted linear calibration curve was built. The coefficient of
sources of uncertainty, a number of experiments were per- determination (R2) for linear tting exceeded 0.9999. The
formed to estimate the volume uncertainties and determine standard recoveries and calculated calibration uncertainties are
whether they were a signicant factor for the achieved accuracy presented in Table 3. Please note that the standard concentra-
with on-column IS. For this purpose, three batches of approxi- tion uncertainties (X-axis) are not considered in this case.
mately 50 parallel injections through the sample and the IS For verication purposes, 150 injections (within 3 batches
loops were measured over the course of three days by different with 50 injections per batch) of the 2.5 mg kg1 As(V) standard
analysts and on two different ICP-MS/MS instruments. Variable were performed and the signal ratio for the IS injections was
dri magnitude and direction was observed with time (see ESI calculated. The relative standard deviation of the ratios (and
Fig. 2–4†). To estimate accurately the uncertainty of the volume therefore of the nal concentrations) varied between 0.5% and
injections the intrinsic dri had to be mitigated. The variability 1.5% per batch, which is in agreement with the expected relative
of peak area around the within-batch trend was obtained by uncertainty between 2.4% and 0.5% for 2.5 mg kg1 As (Table 3,
removing the trend using an additive model statistical pro- above). As expected, getting closer to the 0.025 mg kg1 limit of
cessing (see ESI Fig. 5†). These models provide a smoothed detection results in increased measurement uncertainty.
function for each batch, around which the variance can be Although the calibration approach proposed here provides
determined [denoted as total uncertainty u(T) in ESI Fig. 5†]. accurate results where other calibration strategies might fail, it
Without the trend, the variability was random and the data from is worth noting that on-column or any other type of IS calibra-
the 3 batches could be pooled. It was found that the sensitivity tion is not always a necessity for performing accurate
of the computed peak variability to the model parameters was measurements. The calibration uncertainty with IS would
low. Levene's test showed no variance differences between always be higher, or at least equal to the linear regression one,
batches (p ¼ 0.68), and the Shapiro–Wilk test shows a normal when there are no dri and matrix effects to compensate for.
distribution (p ¼ 0.92) for the peak areas. Further details are With IS calibration two uncertainties from peak area integra-
presented in the ESI (ESI Fig. 6†). However, the designed tions are combined for each measurement vs. only one if simple
experiment does not measure volumes as such but ICP-MS/MS external calibration is used. With the method described in this
This journal is © The Royal Society of Chemistry 2021 Anal. Methods, 2021, 13, 3641–3648 | 3645View Article Online
Analytical Methods Paper
Table 3 On-column IS linear calibration uncertainty and standard the materials' homogeneity and within-run and between-run
recoveries uncertainty components. The on-column calibration expanded
relative uncertainty was between 2% and 3% (k ¼ 2) with #1.5%
i-As fraction Sample/IS area Standard Relative
[mg kg1] ratios recoveries calibration uncertainty sample/IS peak area ratio relative uncertainty (k ¼ 2, see the
This article is licensed under a Creative Commons Attribution-NonCommercial 3.0 Unported Licence.
section on calibration performance above).
0.1 0.0612 101.2% 22.2% Feasibility of application to more than one As species and
0.5 0.2886 99.9% 4.8% non-isocratic conditions. The applicability of the on-column
0.7 0.4300 99.2% 3.2%
1.0 0.5814 100.0% 2.4%
internal standardisation calibration procedure to real samples
5.0 2.9213 100.3% 0.5% is demonstrated above through the analysis of i-As in rice
7.7 4.4796 99.9% 0.3% matrices. However, the separation approach in this case utilises
10.1 5.8993 100.0% 0.3% isocratic elution and only one species is quantied [As(V)], being
Open Access Article. Published on 07 July 2021. Downloaded on 09/19/2021 05:50:24.
the strongest retained species. While logistically this is the
simplest case to which on-column internal standardisation can
be applied, theoretically there should not be limits on the type
work this effect was below 1% increase in the calibration of chromatography and number of species that can be quanti-
uncertainty in case of on-column IS calibration vs. typical ed by this approach, provided that a good chromatographic
external calibration. However, if there is a dri present the selectivity is achieved for each species (i.e. ideally chromato-
contribution of the uncertainty of the IS peak area estimation graphic resolution R > 2). An example of the application of this
becomes negligible compared to the improved accuracy (0.5% method to the quantication of two species [MA and As(V)] is
compared to up to 15% bias, as observed with our experiments). presented in Fig. 5, where a one week aged mixture of 10 mg kg1
Applicability of the method for the determination of i-As in As(III), DMA, MA and As(V) in an eluent is analysed with 2.5 mg
rice food samples. A variety of rice materials with i-As fractions kg1 MA and As(V) internal standard. The typical separation
ranging from 60 to 300 mg kg1, including white rice, brown rice method employing isocratic elution for i-As determination in
and rice intended for baby food, purchased from local grocery baby rice (Table 2) was used in this case. Please note the small
stores in the UK, were analysed with the developed calibration remaining As(III) peak aer its oxidation to As(V). No H2O2 or
procedure. Two subsamples from each material were spiked other oxidising reagent has been applied to this mixture of
with approximately 50 mg kg1 As(V) standard just before the standards.
extraction. Excellent i-As spike recoveries within 5% of the The applicability of the method to gradient elution chro-
spiked concentration were obtained in all cases. Examples for i- matography is demonstrated in Fig. 6 where the same two
As spike recoveries are provided in Table 4. Materials A, C and D species have been quantied with different amounts of carbon
are products from renowned baby food manufacturers, and in the eluent (and therefore in ICP-MS plasma) at the time of
materials B and E are ground white and brown rice products, their elution – 37 mM NH4HCO3 (eluent A) and 55 mM
respectively. NH4HCO3 (eluent B), both pH adjusted to 9.0 (0.2). The
A typical chromatogram of a baby food rice extract is pre- separation method involved 5 min isocratic 100% A, followed by
sented in Fig. 4. To conrm the quantitative conversion of As(III) a linear increase to 100% B in 20 min and 5 min column
to As(V), and therefore representativeness of the As(V) to the i-As equilibration (100% A) before the next sample injection. The
in the sample, within each batch of rice samples a random analytes [MA and As(V)] and the respective internal standards
sample was spiked with As(III) before extraction. In all cases the [MA IS and As(V) IS] were of the same concentration (2.5 mg kg1
species was quantitatively recovered as As(V), conrming the each) but in this case, as expected the species signals showed
complete species oxidation within the matrix. Additionally, two different sensitivities due to the different carbon loads in the
matrix reference materials (white rice ERM-BC211 and brown plasma. The MA peak has smaller peak area than the MA IS peak
rice NMIJ 7532a, certied for i-As) were extracted and analysed and the As(V) peak has smaller peak area than that of As(V) IS, in
along with the rice samples. The relative i-As recoveries from contrast to observations under isocratic conditions (see Fig. 2)
both CRMs were quantitative (between 97% and 107%) and where sensitivities are equal. However, the analyte/IS ratio
within the certied measurement uncertainties, demonstrating remained constant with time, e.g. throughout the batch, and the
the accuracy of both the extraction procedure and the newly instrument dri was efficiently compensated for. Standards
proposed calibration approach (t-test used in both cases). The recoveries close to 100% (2%) were obtained.
relative expanded measurement uncertainty for the whole An additional “stress-test” was performed under the same
method (k ¼ 2) was about 10% or lower in the range 60 to 300 mg conditions but introducing 5% MeOH in water in between
kg1 i-As in dry rice products. This includes the contribution of
Table 4 Inorganic arsenic spike recoveries in rice materials (n ¼ 2) with 50 mg kg1 Na2AsO4 in 2% v/v HNO3 and 1% v/v H2O2
Material code A B C D E
Natural i-As content [mg kg1] 61 116 97 111 269
i-As spike recovery [%] 104.6–105.4 99.9–101.4 100.2–101.8 103–105 97.8–98.7
3646 | Anal. Methods, 2021, 13, 3641–3648 This journal is © The Royal Society of Chemistry 2021View Article Online
Paper Analytical Methods
advantage of the proposed calibration approach is that it can be
employed with any detector that can measure time-resolved
signals. Moreover, multiple elements and species can be
simultaneously quantied with this approach provided that
This article is licensed under a Creative Commons Attribution-NonCommercial 3.0 Unported Licence.
a good chromatographic selectivity is achieved. However, the
success of on-column IS is hampered when the resolution
between the analyte and the following and preceding peaks is
insufficient (R < 2) as in such cases the chromatographic sepa-
ration of the IS is also compromised. The developed calibration
strategy has been demonstrated to be suitable for high accuracy
Fig. 4 Example chromatogram from the analysis of i-As in baby rice
speciation analysis of inorganic As in a rice based matrix with
food by on-column IS calibration.
Open Access Article. Published on 07 July 2021. Downloaded on 09/19/2021 05:50:24.
relatively expanded measurement uncertainty for the whole
method (k ¼ 2) of 10% or lower. Respectively, the relative
uncertainty from the on-column calibration was between 2%
and 3% (k ¼ 2) in the range 60 to 300 mg kg1 i-As in dry rice
products. The proposed method is currently applied to the
certication of reference materials in support of current EU
legislation for the maximum amount of inorganic arsenic in
rice and rice products.
Author contributions
Funding acquisition: Heidi Goenaga-Infante, Panayot Petrov.
Project administration: Heidi Goenaga-Infante, Panayot Petrov.
Fig. 5 Chromatogram for simultaneous determination of MA and As(V)
Resources: Heidi Goenaga-Infante, Panayot Petrov. Supervision:
in a standard mixture by on-column IS utilising isocratic elution. The
dashed lines show the analyte/IS pair peaks for the quantified species. Heidi Goenaga-Infante, Panayot Petrov. Writing – original dra:
Panayot Petrov, Simon Cowen, Heidi Goenaga-Infante. Writing
– review & editing: Panayot Petrov, Heidi Goenaga-Infante.
Soware: Simon Cowen. Conceptualization: Panayot Petrov.
Data curation: Panayot Petrov, Simon Cowen. Methodology:
Panayot Petrov. Formal analysis: Simon Cowen, Panayot Petrov,
Heidi Goenaga-Infante. Investigation: Panayot Petrov. Valida-
tion: Panayot Petrov, Simon Cowen. Visualization: Panayot
Petrov.
Conflicts of interest
There are no conicts to declare.
Fig. 6 Chromatogram for simultaneous determination of MA and As(V)
in a standard mixture by on-column IS utilising gradient elution. The
dashed lines show analyte/IS pair peaks for the quantified species.
Acknowledgements
The work described in this paper was performed at the UK
National Measurement Laboratory at LGC Ltd and was funded
samples to induce stronger dri. Although under such condi- by the UK government Department for Business, Energy &
tions the plasma became unstable and the peak areas increased Industrial Strategy (BEIS).
for both species (MA and As(V)), their ratio to the respective IS
species remained constant (Fig. 7a and b in the ESI†).
References
Conclusions 1 J. P. Vicente, J. E. Romero and S. C. Broch, Validation of
Analytical Methods Based on Chromatographic
A novel calibration strategy for high accuracy speciation anal- Techniques: An Overview, in Analytical Separation Science,
ysis based on on-column internal standard injection is Wiley-VCH Verlag GmbH & Co. KGaA, 1st edn, 2015, vol.
described for the rst time. As the IS species are the same as the 14, pp. 1–52.
target analytes the method offers an attractive alternative to 2 B. Magnusson and U. Örnemark, EURACHEM Guide: The
IDMS calibration to compensate for large signal dris, matrix Fitness for Purpose of Analytical Methods: A Laboratory Guide
effects and potential on-column losses with unique prospects to Method Validation and Related Topics, issued in, 1998.
for determination of mono-isotopic elemental species. Another 3 S. L. Ellison and M. Thompson, Analyst, 2008, 133, 992–997.
This journal is © The Royal Society of Chemistry 2021 Anal. Methods, 2021, 13, 3641–3648 | 3647View Article Online
Analytical Methods Paper
4 J. Kang, L. A. Hick and W. E. Price, Rapid Commun. Mass 9 H. W. Liao, G. Y. Chen, M. S. Wu, W. C. Liao, I. L. Tsai and
Spectrom., 2007, 21, 4065–4072. C. H. Kuo, J. Chromatogr. A, 2015, 1375, 62–68.
5 A. K. Hewavitharana, N. S. A. Kassim and P. N. Shaw, 10 J. Rossmann, L. D. Renner, R. Oertel and A. E. Armouche, J.
“Standard addition with internal standardisation as an Chromatogr. A, 2018, 1535, 80–87.
This article is licensed under a Creative Commons Attribution-NonCommercial 3.0 Unported Licence.
alternative to using stable isotope labelled internal 11 P. Haefelnger, J. Chromatogr. A, 1981, 218, 73–81.
standards to correct for matrix effects—Comparison and 12 P. Araujo, F. Couillard, E. Leirnes, K. Ask, A. Bøkevoll and
validation using liquid chromatography- tandem mass L. Frøyland, J. Chromatogr. A, 2006, 1121, 99–105.
spectrometric assay of vitamin D”, J. Chromatogr. A, 2018, 13 K. D. Altria and H. Fabre, Chromatographia, 1995, 40, 313–
1553, 101–107. 320.
6 E. Stokvis, H. Rosing and J. H. Beijnen, Rapid Commun. Mass 14 Y. Hayashit and R. Matsuda, Anal. Sci., 1995, 11, 389–400.
Spectrom., 2005, 19, 401–407. 15 J. P. Jesus, C. A. Suárez, J. R. Ferreira and M. F. Giné, Talanta,
Open Access Article. Published on 07 July 2021. Downloaded on 09/19/2021 05:50:24.
7 K. M. Kubachka, N. V. Shockey, T. A. Hanley, S. D. Conklin 2011, 85, 1364–1368.
and D. T. Heitkemper, Arsenic Speciation in Rice and Rice 16 J. Feldmann, A. Raab and E. M. Krupp, Anal. Bioanal. Chem.,
Products Using High Performance Liquid chromatography 2018, 410, 661–667.
Inductively Coupled Plasma-Mass Spectrometric 17 P. Kościelniak, M. Wieczorek, J. Kozak and M. Herman, Anal.
Determination, FDA: Version Dra 1.1, November 2012. Lett., 2011, 44, 411–430.
8 H. Stahnke, T. Reemtsma and L. Alder, Anal. Chem., 2009, 81, 18 Commission Regulation (EU), 2015/1006, Official Journal of
2185–2192. the European Union, 2015, vol. 161, pp. 14–16.
3648 | Anal. Methods, 2021, 13, 3641–3648 This journal is © The Royal Society of Chemistry 2021You can also read