Anomalous energy consumption detection using a Naïve Bayes approach version 1; peer review: 1 approved with reservations
←
→
Page content transcription
If your browser does not render page correctly, please read the page content below
F1000Research 2022, 11:64 Last updated: 01 JUL 2022

RESEARCH ARTICLE

Anomalous energy consumption detection using a Naïve
Bayes approach [version 1; peer review: 1 approved with
reservations]
Jia Yan Lim         , Wooi-Nee Tan, Yi-Fei Tan
Faculty of Engineering, Multimedia University, Persiaran Multimedia, Cyberjaya, Selangor, 63100, Malaysia

v1   First published: 19 Jan 2022, 11:64                                         Open Peer Review
     https://doi.org/10.12688/f1000research.70658.1
     Latest published: 19 Jan 2022, 11:64
     https://doi.org/10.12688/f1000research.70658.1                              Approval Status

                                                                                                                  1
Abstract
Background: Industrial energy management has emerged as an                       version 1
important component in monitoring energy consumption particularly                19 Jan 2022                     view
with the recent trend of migrating towards IR 4.0. The capability to
detect anomalies is essential as it serves as a precautionary step for
                                                                                  1. Kim Gaik Tay      , Universiti Tun Hussein Onn
real-time response to mitigate the maximum demand penalty. The
purpose of this research was to develop a high accuracy anomalies                   Malaysia, Batu Pahat, Malaysia
detection algorithm to identify anomalies in the energy consumption
                                                                                 Any reports and responses or comments on the
data recorded by a smart meter.
Methods: The proposed algorithm utilized supervised and                          article can be found at the end of the article.
unsupervised machine learning techniques, namely Isolation Forest
and Gaussian Naïve Bayes. The data were first labeled by using
Isolation Forest to categorize them into normal and abnormal groups.
This was followed by Gaussian Naïve Bayes to classify and predict the
anomalies of the smart meter reading.
Results: These machine learning techniques showed significant
accuracy in predicting the anomalies in smart meter readings. The
data used were simulated data collected in less than a month with 30-
minute reading intervals. The data were divided into testing and
validation sets according to a ratio of 7:3. The balanced accuracy score
in predicting anomalies for each different smart meter was above
89%. The average precision, average recall and average F1 score for
the normal data were 98%, 99% and 98%, respectively. Whereas the
corresponding scores for the abnormal data set were 95%, 90% and
92%.
Conclusions: The proposed algorithm is a hybrid approach based on
Isolation Forest and Gaussian Naïve Bayes and it provided satisfactory
accuracy in anomaly electricity consumption detection based on smart
meter readings. The study presents a quick and simple method for
categorizing energy consumption data as normal or abnormal, which
assists in automatically labelling vast datasets of energy consumption
readings. The proposed approach establishes a fundamental
framework for predicting the occurrence of anomalies in the industrial

                                                                                                                            Page 1 of 12
F1000Research 2022, 11:64 Last updated: 01 JUL 2022

energy management system.

Keywords
anomaly detection, energy consumption, data labeling, Isolation
Forest, Gaussian Naïve Bayes, energy management, machine learning
techniques

                This article is included in the Artificial
                Intelligence and Machine Learning gateway.

                This article is included in the Energy gateway.

                This article is included in the Research Synergy
                Foundation gateway.

 Corresponding author: Yi-Fei Tan (yftan@mmu.edu.my)
 Author roles: Lim JY: Data Curation, Investigation, Software; Tan WN: Conceptualization, Methodology; Tan YF: Methodology, Software
 Competing interests: No competing interests were disclosed.
 Grant information: The author(s) declared that no grants were involved in supporting this work.
 Copyright: © 2022 Lim JY et al. This is an open access article distributed under the terms of the Creative Commons Attribution License,
 which permits unrestricted use, distribution, and reproduction in any medium, provided the original work is properly cited.
 How to cite this article: Lim JY, Tan WN and Tan YF. Anomalous energy consumption detection using a Naïve Bayes approach
 [version 1; peer review: 1 approved with reservations] F1000Research 2022, 11:64 https://doi.org/10.12688/f1000research.70658.1
 First published: 19 Jan 2022, 11:64 https://doi.org/10.12688/f1000research.70658.1

                                                                                                                                 Page 2 of 12
F1000Research 2022, 11:64 Last updated: 01 JUL 2022

Introduction
People nowadays are continuously looking for new ways to utilize energy to improve their lives, therefore the demand
for it is increasing. Most of the time, companies and industries struggle to monitor all their devices at the same time,
which can lead to power wastage at any time. As a result, operational expenses will be greater than necessary. Besides
that, power wastage contributes to global warming by releasing carbon when energy is generated through burning coal,
gas, and oil. Hence, solutions are required to address these issues. Energy Management Information Systems (EMIS)1 or
Building Energy Management Systems (BEMS)2 are the tools for continuous energy management monitoring that collect
and analyze energy data on a regular basis. However, since no fixed characteristics can be retrieved, and no current static
model of energy can be referred to, they give a low accuracy in predicting electricity consumption. According to an article
published in Energy Malaysia,3 consumers may use the information supplied by smart meters to assist them to take
prompt action in terms of power usage and waste. However, a model which is able to give early detection of deviations
from historical energy usages is important and beneficial to multiple parties.

Many authors have conducted research on detecting the abnormal behavior of power usage. Yassine Himeur et al.,4 used a
rule-based model to extract micro-moment features. In their method, the accuracy varied from 93.91% to 99.58%
depending on the types of datasets. The main limitation of their proposed work was related to the use of supervised
learning in training the classifier. Wenqiang Cui and Hao Wang5 proposed a hybrid model that combines polynomial
regression and Gaussian distribution to detect the anomalies of data. They focused on school power consumption and
were able to detect anomalies with 0 false-negative and an average precision higher than 91%. However, the model must
be trained manually. Ma and Zhang6 developed a method to detect abnormal building energy consumption in real time.
They used fractal correlation dimension (FCD) and proper orthogonal decomposition linear stochastic estimation (POD-
LSE). They claimed that the performance of the method depended on the threshold selected. Thus, improvement was
required by integrating with other intelligent algorithms. Jecinta Mulongo et al.,7 used support vector machines (SVM),
K-Nearest Neighbors (KNN), Logistic Regression (LR), and MultiLayer Perceptron (MLP) to detect anomalies in power
generation plant data. They reported that MLP has the best performance in the evaluation measurement with a score of
96% in the K-fold cross validation test. In addition, deep learning has also received increasing interest for abnormality
detection.8–10 Besides using machine learning and deep learning to detect anomaly electricity consumption, statistical
techniques are used to monitor the consumption pattern. For example, Lin and Claridge11 used the deviation between
collected and simulated energy usage and also the standard deviation of the residuals to detect the abnormal consumption.
The limitation here was that only limited assumed cases were used. Araya et al.,12 used sliding window framework to
capture contextual characteristics and historical sensor data in detecting the anomalous pattern. Liu et al.,13 proposed a
statistical-based online detection technique with a Lambda scheme, which involved an in-memory distributed computing
algorithm. Chen et al.14 also proposed a statistical predictive method utilizing mean and variance in detecting the energy
anomalies.

One of the challenges that complicates the development of anomaly detection technique is the absence of labelled
ground-truth datasets. There is a lack of research addressing how to classify energy consumption readings as normal or
abnormal, as well as the nature of the abnormality.15 Additionally, as data on electricity consumption continues to expand
tremendously, the properties of big data become more apparent, which further complicates the process of detecting
anomalies. To that end, this paper proposes a method for detecting anomalies in energy consumption readings using an
unsupervised approach that combines Isolation Forest and Naive Bayes models. The Isolation Forest is shown to be
capable of detecting not only point anomalies with peaks, but also contextual anomalies. Whereas, when combined with
Naive Bayes, the possibility of performing anomaly detection without retraining the data is demonstrated. This hybrid
approach to labeling energy consumption readings demonstrates a straightforward and efficient method for assisting in
the energy consumption readings labeling, which is critical in today's rapidly growing data volume era.

In this paper, a two-stage anomalous detection model is proposed to detect any anomalies of smart meter readings. This
paper is organized as follows: Section 1 is the introduction, section 2 describes the methodology, which includes data
labelling and the detection model. Section 3 presents the results and discussion. Finally, we conclude the research and
introduce future work in Section 4.

Methods
The anomalous detection model is built in two stages. The first stage focuses on utilizing the Isolation Forest in
labeling the energy consumption data into two categories: normal consumption or abnormal peak. In the second stage, the
energy consumption data as well as the corresponding labelled categories are then used to train a detection model using
the Gaussian Naïve Bayes approach. The trained model can then be used to detect any anomalous unseen energy
consumption data. The proposed model is implemented using the Python programming language, version 3.7 (RRID:
SCR_008394).

                                                                                                                          Page 3 of 12
F1000Research 2022, 11:64 Last updated: 01 JUL 2022
Stage 1: Data labeling with Isolation Forest
Isolation Forest is one of the unsupervised machine learning algorithms used to detect anomalies in a dataset. Unlike
supervised machine learning algorithms, Isolation Forest does not require any label or classification for the data to be
analyzed. The algorithm isolates or separates anomalies by considering anomalies as instances that are less likely to occur
or attribute values that are very different from normally attributed values. For Isolation Forest, the anomaly score is
calculated with the equation below:
EðhðxÞÞ
sðx, nÞ ¼ 2 cðnÞ
where hðxÞ is the path length, which is the number of edges where point x meets the decision tree. E ðhðxÞÞ is the expected
number of hðxÞ, and cðnÞ is the average path length of the total decision tree. From the equation, when the path length is
low, an isolated point, the value for E ðhðxÞÞ is close to zero and the score is close to 1. When the total path length is equal
to the average path length the score will be 0.5. According to Liu et al.,16 the potential anomalies can be acknowledged as
an anomaly score above 0.6.
Figure 1 gives the labelling flow chart using Isolation Forest. The unlabeled data was first imported into the Jupyter
Notebook (Jupyter Notebook, RRID:SCR_018315). The Isolation Forest from sklearn.ensemble was then used to
identify the anomaly scores. In our work, the anomaly scores above 0.53 were classified as abnormal data. The classified
values of C0 ¼ 0 were used to indicate normal energy consumption while C1 ¼ 1 indicated anomaly energy consumption.
Figure 1. Flow chart of stage 1 data labeling with Isolation Forest.
Page 4 of 12F1000Research 2022, 11:64 Last updated: 01 JUL 2022
Stage 2: Detection model based on Gaussian Naïve Bayes
The Gaussian Naïve Bayes is one of the most popular classifier algorithms in data mining and the data science field. It is
well known since it is a simple technique for deciphering binary or categorical input values, and it does not necessitate a
large amount of data for training. Since the energy consumption data is in a continuous form, the Gaussian Naïve Bayes
that follows a Gaussian normal distribution was chosen to build the detection model. In general, Gaussian Naïve Bayes
calculates the probability density of v for certain data to be assigned to respective classes according to the equation:
2
ðvμk Þ
1
pðx ¼ vjC k Þ ¼ pffiffiffiffiffiffiffiffiffiffi2 e 2σ 2
k (1)
2πσ k
with x is the energy consumption, Ck is the data labelling, μk is the mean of the values in x associated with Ck , σ k is the
Bessel corrected variance of the values in x associated with class Ck . Thus, given an unseen energy consumption value x,
its probabilities of being classified into an abnormal class will be calculated based on the well-known Bayesian Theorem:
pðxjC1 ÞpðC1 Þ pðxjC1 ÞpðC 1 Þ
pðC1 jxÞ ¼ ¼P (2)
pðxÞ i¼0,1 pðxjC i Þ pðC i Þ
with the probabilities pðx ¼ vjCk Þ can be obtained from equation (1). If pðC1 jxÞ is greater than 0.5, then the point would be
classified as abnormal, else it would be classified as a normal energy consumption point. The trained Naïve Bayes model
can then be used to classify the unseen energy consumption reading into normal and abnormal. The proposed anomalous
detection model was verified using simulated smart meter readings with each reading for a smart meter collected in
30-minute intervals for a period of 576 hours. Firstly, the pattern of the electricity data of the Irish Social Science Data
Archive (ISSDA) were investigated. Next, three sets of smart readings were generated based on different values of peak-
to-peak and valley-to-valley intervals. Then, the energy consumption values were manually created based on assumption
of different users’ behavior.17
Results
Three smart meter readings were simulated in the analysis, namely smart meter ID A, smart meter ID B and smart meter
ID C. The energy curves of each of these meter readings exhibited varied behavior and their respective energy
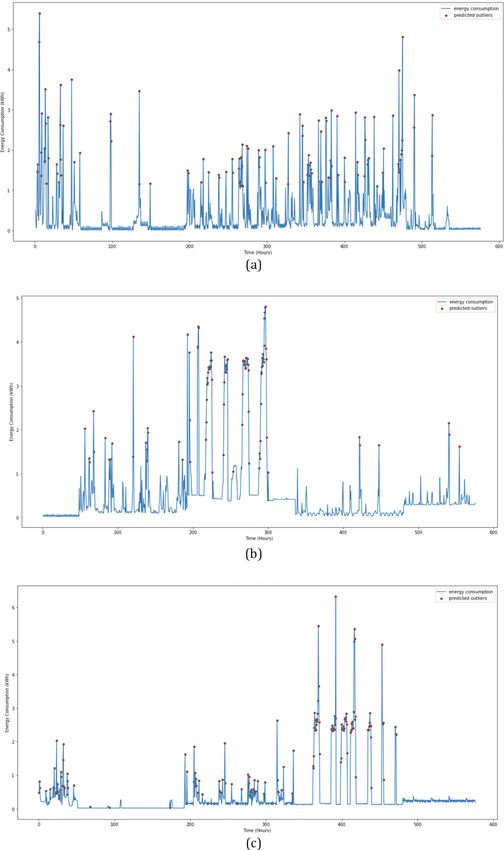
consumption profiles are depicted in Figure 2. Most of the spikes in the energy curve of smart meter ID A are of similar
height. However, the peak values of the energy curve in smart meter ID B are more variable. Meanwhile, the energy curve
of smart meter ID C is flatter.
To ensure that the verification process was performed without bias, the data was categorized in a 70:30 ratio, with 70% of
data utilized for training, and 30% of data reserved for verification as unseen data to the training model. The performance
of the anomalous detection model was evaluated using the following formulae on precision, recall and F1 score:
TP
precision ¼
TP þ FP
TP
recall ¼
TP þ FN
precision recall
F1 score ¼ 2
precision þ recall
TP, FP and FN refer to true positive, false positive and false negative, respectively.
Take the case when positive (P) refers to the anomalous point, for example, then TP denotes that the abnormal points are
accurately identified as abnormal, whereas FP denotes that the normal points are incorrectly detected as abnormal by the
model. Finally, abnormal points detected as normal by the model are referred to as FN. Therefore, the precision gives the
proportion of detected anomalous points that are actually abnormal. The counterpart of precision is recall, which refers to
the ability to recognize abnormal points among the actual abnormal points. F1 score combines precision and recall and
calculates the harmonic mean. The F1 score reaches its optimum value of 1 if both precision and recall are both at 100%.
Page 5 of 12F1000Research 2022, 11:64 Last updated: 01 JUL 2022 Figure 2. Energy curves of simulated energy consumption data and spikes labeled as abnormal: (a) smart meter A (b) smart meter B (c) smart meter C. Page 6 of 12
F1000Research 2022, 11:64 Last updated: 01 JUL 2022

Table 1. Performance scores of anomalous detection model for different smart meters.

                                                                  Smart meter ID
                                                                  A                 B                 C                 Average
 Normal (when P = 0)                      Precision               1.00              0.98              0.96              0.98
                                          Recall                  0.97              1.00              1.00              0.99
                                          F1 score                0.98              0.99              0.98              0.98
 Abnormal (when P = 1)                    Precision               0.85              1.00              1.00              0.95
                                          Recall                  1.00              0.92              0.79              0.90
                                          F1 score                0.92              0.96              0.88              0.92

Table 2. Balanced accuracy score of the anomalous detection model for different smart meters.

 Smart meter ID                                                    Balanced accuracy score
 A                                                                 0.9827
 B                                                                 0.9576
 C                                                                 0.8947

Table 1 summarizes the above scores for smart meter ID A, smart meter ID B and smart meter ID C. The calculations were
performed for two cases when the positive, P = 0 and when the positive, P = 1 .

The time series dataset involved is known to have issues of imbalanced data, with a large portion of the data considered
normal consumption. The performance of the proposed model is further evaluated by balanced accuracy, a well-known
metric for imbalanced data. The balanced accuracy is given as:

                                                              1 TP TN
                                         balanced accuracy ¼         þ       ,
                                                              2 P       N

which is the average of true positive rate and true negative rate. Table 2 provides the calculated balanced accuracy score
for 3 different smart meters.

Discussion
In the performed simulation, labeling based on Isolation Forest was performed to the given time series data to identify the
anomalous instances. The red dots associated with the peaks of the energy profiles in Figure 2 refer to the identified
anomalous points. It can be observed that the Isolation Forest approach was able to detect almost all the local maximum
points, which coincided with the instances of peaks in the energy consumption profiles. This tallied with the requirement
of anomalous energy detection, as the spikes are not merely tied to the magnitude in kW, but mainly depend on the
behavior of the profile in its neighborhood. Thereby, Isolation Forest is able to capture the peak regardless of the pattern
exhibits in the dataset. Despite the fact that the peak’s value is low in comparison to the rest of the overall dataset, it is still
an atypical peak when compared to surrounding past measurements that are lower. Based on the simulation results,
we can observe that Isolation Forest is a suitable strategy for auto labeling the smart meter readings. The approach is
relatively direct to implement when compared to alternative approaches that define or predict the anomalies based on
absolute magnitude analysis with mean and variance.15 Isolation Forest is especially valuable if the user’s behavior
changes with the seasons, such as when the energy readings are high during high production periods but low during low
production periods. In summary, Isolation Forest is capable not only in detecting the point anomalies, but also in detecting
the peak anomalies in contextual perspectives. However, if using Isolation Forest to classify anomalies requires
processing an entire series of data in a specific window, this may not be feasible given the rapid growth of electricity
consumption data. To that end, the Isolation Forest-labeled data is used to train a Naive Bayes model, which enables rapid
classification of a single piece of data into normal or abnormal states without requiring previous points to be processed
batch-wise as in Isolation Forest. For both classification results by Naïve Bayes model, the precision scores obtained for
all smart meters were above 0.85, the recall values were above 0.79 and the F1 scores were above 0.88. The recall value of
smart meter ID C for P = 1 was 0.79, which was the lowest score of all. This indicates that the model could only recognize
79% of the actual anomalous data, which could be related to the flattening trend of the energy consumption profiles,

                                                                                                                                   Page 7 of 12
F1000Research 2022, 11:64 Last updated: 01 JUL 2022
making it more difficult and challenging to identify spikes. In general, the performance of the anomalous detection
models was satisfactory. The average F1 score was 0.98 and 0.92, for normal and abnormal data, respectively. This
indicates that the model has harmonic high performance for both precision and recall. The time series dataset involved is
known to have the issues of imbalanced data, with a large portion of the data considered normal consumptions. The
balanced accuracy score for all smart meters was above 0.8947. Therefore, the proposed anomalous detection model not
only detects the anomalous points successfully, but also classifies the normal points appropriately.
Conclusions
This paper proposed a two-stage anomalous detection model, combining the Isolation Forest and Gaussian Naïve Bayes.
The performed simulations showed that a balanced accuracy score of at least 0.8947 was achieved. The Isolation Forest
approach was used to label normal and abnormal data, and it successfully identified the abnormal spikes based on
the behavior of the energy consumption pattern rather than just the magnitude of consumption. In detecting anomalies, the
Gaussian Naïve Bayes gave a satisfactory performance in detecting the abnormal points as well as the normal points. The
proposed approach combining Isolation Forest and Naive Bayes can be used to detect anomalies in a given time series of
energy consumption. In comparison to using only the Isolation Forest for classification, this hybrid approach provides a
straightforward method for labelling the data, which is particularly useful when the data set is large and arrives in batches.
Classification does not have to be repeated using Isolation Forest and all available data; rather, once trained, the trained
Naive Bayes model can classify effectively. However, the size of the current simulation was limited by the available
dataset. A larger amount of data should be collected and applied to this model in the future. Furthermore, the optimum
dataset size to achieve high accuracy also needs to be identified.
Data availability
Underlying data
Open Science Framework. Underlying data for ‘Anomalous energy consumption detection using a Naïve Bayes
approach’, https://doi.org/10.17605/OSF.IO/CKTQS17
This project contains the following underlying data:
• Smart meter data.xlsx
Software availability
Archived source code at time of publication: https://doi.org/10.17605/OSF.IO/CKTQS17
This project contains the following parameter code:
• Model A GNB.ipynb
• Model B GNB.ipynb
• Model C GNB.ipynb
Data are available under the terms of the Creative Commons Attribution 4.0 International license (CC BY 4.0 Public
domain dedication)
References
1. Horinov S, Horinova S: Energy management systems. GCSEEA 4. Himeur Y, Alsalemi A, Bensaali F, et al. : A novel approach
Global Conference on Sustainable Environment, Energy and Agriculture for detecting anomalous energy consumption based on
(GCSEEA-2017). 2017. micro-moments and deep neural networks. Cogn. Comput. 2021;
Publisher Full Text 1–23.
2. Shapi MKM, Ramli NA, Awalin LJ: Energy consumption prediction 5. Cui W, Wang H: Anomaly detection and visualization of school
by using machine learning for smart building: Case study in electricity consumption data. 2017 IEEE 2nd International
Malaysia. Developments in the Built Environment. 2021; 5: 100037. Conference on Big Data Analysis (ICBDA). 2017; pp. 606–611.
Publisher Full Text Publisher Full Text
3. Ramli H, Ahmad SS, Abdullah A, et al. : Let's Get Smart. Energy 6. Ma Z, Song J, Zhang J: A real-time detection method of abnormal
Malaysia, Energy Commission Malaysia. 2019; 19: 8–15. building energy consumption data coupled POD-LSE and FCD.
Page 8 of 12F1000Research 2022, 11:64 Last updated: 01 JUL 2022
Procedia Eng. 2017; 205: 1657–1664. International Joint Conference on Neural Networks (IJCNN). 2016;
Publisher Full Text pp. 511–518.
7. Mulongo J, Marcellin A, Theophilus A-S, et al.: Anomaly Detection in Publisher Full Text
Power Generation Plants Using Machine Learning and Neural 13. Liu X, Iftikhar N, Nielsen PS, et al.: Online anomaly energy
Networks. Appl. Artif. Intell. 2020; 34(1): 64–79. consumption detection using lambda architecture. International
Publisher Full Text Conference on Big Data Analytics and Knowledge Discovery. Porto:
8. Manimaran A, Chandramohan D, Shrinivas S, et al. : Springer; 2016; pp. 193–209.
A comprehensive novel model for network speech anomaly 14. Chen B, Sinn M, Ploennigs J, et al.: Statistical Anomaly Detection in
detection system using deep learning approach. Int. J. Speech Mean and Variation of Energy Consumption. 2014 22nd
Technol. 2020; 23: 305–313. International Conference on Pattern Recognition. 2014; pp. 3570–3575.
Publisher Full Text Publisher Full Text
9. Aldweesh A, Derhab A, Emam AZ: Deep learning approaches for 15. Himeur Y, Alsalemi A, Bensaali F, et al. : A Novel Approach for
anomaly-based intrusion detection systems: A survey, Detecting Anomalous Energy Consumption Based on Micro-
taxonomy, and open issues. Knowl.-Based Syst. 2020; 189: 105124. Moments and Deep Neural Networks. Cogn. Comput. 2020; 12:
Publisher Full Text 1381–1401.
10. Chalapathy R, Chawla S: Deep learning for anomaly detection: Publisher Full Text
A survey. arXiv:1901.03407. 2019. 16. Liu FT, Ting KM, Zhou Z: Isolation Forest. 2008 Eighth IEEE
11. Lin G, Claridge D: A temperature-based approach to detect International Conference on Data Mining. 2008; pp. 413–422.
abnormal building energy consumption. Energ. Buildings. 2015; Publisher Full Text
93: 110–118. 17. Lim JY, Tan W-N, Tan Y-F: Anomalous energy consumption
Publisher Full Text detection using a Naïve Bayes approach. Data and ipynb files.
12. Araya DB, Grolinger K, ElYamany HF, et al.: Collective contextual Open Science Framework. 2021.
anomaly detection framework for smart buildings. 2016 Publisher Full Text
Page 9 of 12F1000Research 2022, 11:64 Last updated: 01 JUL 2022
Open Peer Review
Current Peer Review Status:
Version 1
Reviewer Report 16 February 2022
https://doi.org/10.5256/f1000research.74260.r120393
© 2022 Tay K. This is an open access peer review report distributed under the terms of the Creative Commons
Attribution License, which permits unrestricted use, distribution, and reproduction in any medium, provided the
original work is properly cited.
Kim Gaik Tay
Faculty of Electrical and Electronic Engineering, Universiti Tun Hussein Onn Malaysia, Batu Pahat,
Malaysia
This paper demonstrates the use of unsupervised machine learning techniques by Isolation Forest
to label normal and anomalous points of energy consumption, as well as a Gaussian supervised
method, namely Naïve Bayes, to classify the normal and anomalous points of energy consumption
and predict the unseen anomalies from the smart meter reading. This work could be approved
pending several polishes.
1. Methods section of Abstract. Please change “The proposed algorithm utilized supervised and
unsupervised machine learning techniques, namely Isolation Forest and Gaussian Naïve Bayes”
to “The proposed algorithm utilized unsupervised and supervised machine learning
techniques, namely Isolation Forest and Gaussian Naïve Bayes.” Because Isolation Forest is
unsupervised while Naïve Bayes is supervised method.
2. In Results section of Abstract, “The data used were simulated data collected in less than a
month with 30-minute reading intervals. The data were divided into testing and validation sets
according to a ratio of 7:3.” Is the data here training data? The training data was divided into
70% training and 30% testing?
3. The statement before Results section states that “The proposed anomalous detection model
was verified using simulated smart meter readings with each reading for a smart meter collected
in 30-minute intervals for a period of 576 hours. Firstly, the pattern of the electricity data of the
Irish Social Science Data Archive (ISSDA) were investigated. Next, three sets of smart readings
were generated based on different values of peak to-peak and valley-to-valley intervals. Then, the
energy consumption values were manually created based on assumption of different users’
behavior.” Please clearly explain the training, testing and validation datasets and their ratio.
Are training datasets from ISSDA and testing datasets generated manually? Are the 30-
minutes intervals for a period of 576 hours testing data or training data? How is data
generated based on peak to peak and valley-to-valley intervals? The abstract mentioned
validation, but here no: please tally this section with the abstract.
Page 10 of 12F1000Research 2022, 11:64 Last updated: 01 JUL 2022
4. Explain in greater detail how Isolation Forest can label energy distribution as normal or
anomalous? Also, how does one calculate h(x) from x? What is n, s(x,n)? The equation to
calculate anomaly score should labeled as (1).
5. Explain each term in Examples (1) and (2) such as p(x=ν|Ck), p(C1|x), p(x|C1), p(C1), p(x). How
to calculate ν,p(x|C1), p(C1), p(x)? Explain further what Bessel corrected variance is. What is
the usage of Example (1) in classifying if a point is normal or abnormal?
6. Is Figure 2 training, validation or testing results? Where is normal point?
7. Since you define precision as TP/(TP+FP), and recall as TP/(TP+FN), then it is confusing for
the reader that in Table 1, in the section for Normal (when P = 0) that you use the labels
Precision and Recall here as well. I would recommend writing Abnormal Precision as =
TP/(TP+FP ) and Normal Precision as TN/(TN + FN); Abnormal Recall as TP/(TP+FN ) and
Normal Recall as TN/(TN + FP); and Abnormal F1 score = 2. abnormal precision* abnormal
recall/ (abnormal precision + abnormal recall) and normal F1 score = 2. normal precision*
normal recall/ (normal precision + normal recall).
8. What are P and N in balanced accuracy?
9. From Discussion part, line 7, “… it is still an “atypical” peak…” Any typo at “atypical”?
Is the work clearly and accurately presented and does it cite the current literature?
Yes
Is the study design appropriate and is the work technically sound?
Yes
Are sufficient details of methods and analysis provided to allow replication by others?
Partly
If applicable, is the statistical analysis and its interpretation appropriate?
Yes
Are all the source data underlying the results available to ensure full reproducibility?
Yes
Are the conclusions drawn adequately supported by the results?
Yes
Competing Interests: No competing interests were disclosed.
Reviewer Expertise: Machine learning
I confirm that I have read this submission and believe that I have an appropriate level of
expertise to confirm that it is of an acceptable scientific standard, however I have
Page 11 of 12F1000Research 2022, 11:64 Last updated: 01 JUL 2022
significant reservations, as outlined above.
The benefits of publishing with F1000Research:
• Your article is published within days, with no editorial bias
• You can publish traditional articles, null/negative results, case reports, data notes and more
• The peer review process is transparent and collaborative
• Your article is indexed in PubMed after passing peer review
• Dedicated customer support at every stage
For pre-submission enquiries, contact research@f1000.com
Page 12 of 12You can also read