Antofagasta plc BMO Capital Markets 2020 Global Metals & Mining Conference - Iván Arriagada Chief Executive Officer

Page created by Javier West
 
CONTINUE READING
Antofagasta plc BMO Capital Markets 2020 Global Metals & Mining Conference - Iván Arriagada Chief Executive Officer
Antofagasta plc
BMO Capital Markets
2020 Global Metals & Mining Conference
Iván Arriagada
Chief Executive Officer
24th February 2020
Miami
Antofagasta plc BMO Capital Markets 2020 Global Metals & Mining Conference - Iván Arriagada Chief Executive Officer
Cautionary statement
This presentation has been prepared by Antofagasta plc. By reviewing and/or attending this presentation you agree to the following conditions:
This presentation contains forward-looking statements. All statements other than historical facts are forward-looking statements. Examples of forward-
looking statements include those regarding the Group's strategy, plans, objectives or future operating or financial performance; reserve and resource
estimates; commodity demand and trends in commodity prices; growth opportunities; and any assumptions underlying or relating to any of the
foregoing. Words such as “intend”, “aim”, “project”, “anticipate”, “estimate”, “plan”, “believe”, “expect”, “may”, “should”, “will”, “continue” and similar
expressions identify forward-looking statements. Forward-looking statements involve known and unknown risks, uncertainties, assumptions and other
factors that are beyond the Group’s control. Given these risks, uncertainties and assumptions, actual results could differ materially from any future results
expressed or implied by these forward-looking statements, which apply only as of the date of this presentation. Important factors that could cause actual
results to differ from those in the forward-looking statements include: global economic conditions; demand, supply and prices for copper; long-term
commodity price assumptions, as they materially affect the timing and feasibility of future projects and developments; trends in the copper mining
industry and conditions of the international copper markets; the effect of currency exchange rates on commodity prices and operating costs; the
availability and costs associated with mining inputs and labour; operating or technical difficulties in connection with mining or development activities;
employee relations; litigation; and actions and activities of governmental authorities, including changes in laws, regulations or taxation. Except as
required by applicable law, rule or regulation, the Group does not undertake any obligation to publicly update or revise any forward-looking statements,
whether as a result of new information, future events or otherwise.
Certain statistical and other information about Antofagasta plc included in this presentation is sourced from publicly available third party sources. Such
information presents the views of those third parties and may not necessarily correspond to the views held by Antofagasta plc.
This presentation is for information purposes only and does not constitute an offer to sell or the solicitation of an offer to buy shares in Antofagasta plc or
any other securities in any jurisdiction. Further it does not constitute a recommendation by Antofagasta plc or any other person to buy or sell shares in
Antofagasta plc or any other securities.
Past performance cannot be relied on as a guide to future performance.

                                                                                                                                                                  2
Antofagasta plc BMO Capital Markets 2020 Global Metals & Mining Conference - Iván Arriagada Chief Executive Officer
Strategic Framework

 Developing
 mining for a
 better future

                      3
Antofagasta plc BMO Capital Markets 2020 Global Metals & Mining Conference - Iván Arriagada Chief Executive Officer
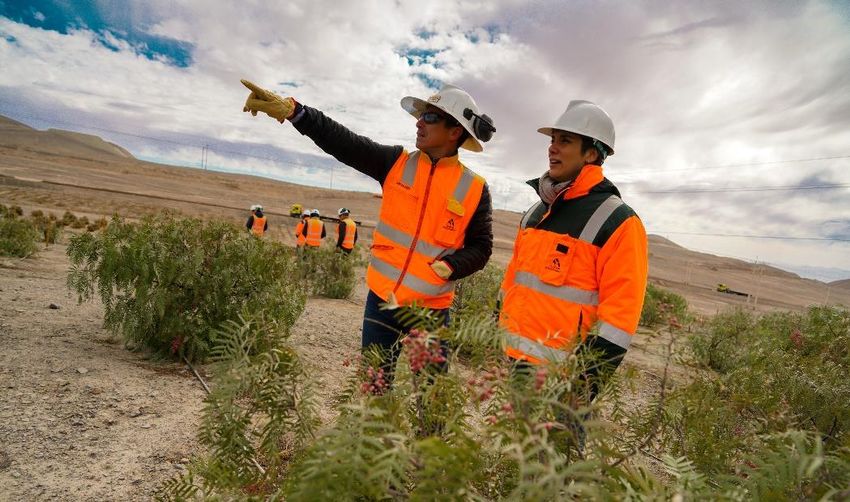
Improving operating discipline
    Record year of safety performance and copper production

                           Safety performance                                                   Copper production (kt)

                                                                                                                         770
        2.00                                                                                                      725
                                                                                                709      704
                            1.61                 1.53                1.57
                                                                                         630
                                                                                  1.01

                               2
          1                                        0                    1          0

        2015                2016                 2017                2018         2019   2015   2016    2017     2018    2019

         Fatalities                Lost Time Injury Frequency Rate (LTIFR)1

1   Number of accidents with lost time during the year per million hours worked
                                                                                                                                4
Antofagasta plc BMO Capital Markets 2020 Global Metals & Mining Conference - Iván Arriagada Chief Executive Officer
Sustainability is central to everything we do

                            Economic                     Social                                          Transparency and
      People                                                                   Environment
                           Performance                Development                                      Corporate Governance

     Zero fatalities      Long term approach       Shared development, not       Environmental            Risk appetite defined
Safety and health model   High quality and long-      mitigating impacts       management model            Risk management
    Labour relations            life assets          Relationship models:    Use of renewable energy       Ethics committee
                           Value over volume         ‘Somos Choapa’ and         Sea water use
Diversity and inclusion                                ‘Diálogos para el                                     Group values
  Flexitime schemes        Disciplined capital            Desarrollo’         GHG emissions target
                               allocation
                          Shareholder returns

                                                                                                                                  5
Antofagasta plc BMO Capital Markets 2020 Global Metals & Mining Conference - Iván Arriagada Chief Executive Officer
2019 a record year of copper production
          Group production of 770,000 tonnes at $1.22/lb

Los Pelambres                     Centinela                      Antucoya                       Zaldívar                     Transport

         Cu production                   Cu production                 Cu production                  Cu production1
                                                                                                                                       Tonnage
         363,400 t                       276,600 t                       71,900 t                      58,100 t                      transported
         Net cash costs                  Net cash costs                  Cash costs                     Cash costs
                                                                                                                                     6,533 kt
          $0.91/lb                        $1.26/lb                       $2.17/lb                      $1.75/lb
• Met production and              • Met production and           • Focused on optimising mine   • Increased throughput and   • Transport volumes grew
  outperformed cost guidance        outperformed cost guidance     and plant operations           reliability                  7.7%
• Stable and reliable operation   • Higher copper grades and     • Improved dust suppression    • Copper grades increased    • Increased haulage capacity
• Phase 1 expansion 31%             recoveries during the year     and spent ore disposal                                      and efficiency
  complete                        • Strong gold production       • Company´s first strike                                    • New contracts signed
                                                                   resolved after 18 days

     1    Group’s 50% share
                                                                                                                                                            6
Antofagasta plc BMO Capital Markets 2020 Global Metals & Mining Conference - Iván Arriagada Chief Executive Officer
Economic growth not possible without social value creation
and environmental care
    From mitigating impacts to shared development
   ▪ “Somos Choapa” and “Dialogos para el Desarrollo” programmes
   ▪ Antofagasta Region public-private Mining Cluster
   ▪ Prioritising local suppliers and employment
   ▪ Regional development

    Committed to climate change mitigation
   ▪ 3% reduction of forecast GHG by 2022 (300,000 t CO2)
   ▪ 100% renewable energy for Zaldívar from 2020 and Antucoya from 2022
   ▪ 25,000 ha of protected ecosystems

    Water and tailings
   ▪ 45% of water used comes from the sea
   ▪ Currently building a desalination plant at Los Pelambres
   ▪ Thickened tailings at Centinela

                                                                           7
Antofagasta plc BMO Capital Markets 2020 Global Metals & Mining Conference - Iván Arriagada Chief Executive Officer
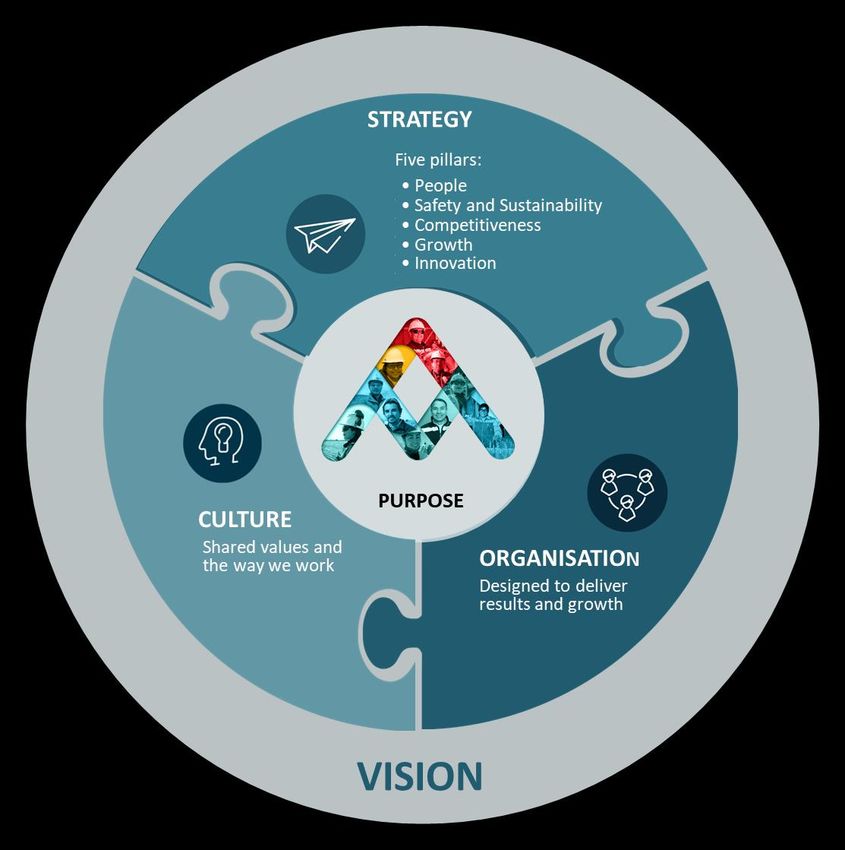
Antofagasta’s approach to tailings management
        Minimising the social and environmental impact of our TSFs1
                        Technology and innovation to
                                                                                     El Mauro TSF at Los Pelambres
                          reduce water use and dust,                                 •   Designed for extreme weather and severe earthquakes.
                         strengthen TSFs, and improve                                •   Reviewed annually by a panel of international experts
                        monitoring and communication
                                                                                     •   85% of the water is recirculated
                                                                                     •   Programa Tranque project2: Standardised system for TSF monitoring that
                                                                                         provides early warning of any physical or chemical instability. On-line real time
                                                                                         information for all stakeholders (mining companies, authorities and communities)

                                                                                     Centinela thickened tailings
                                                                                     •   Pioneered the use of large-scale thickened tailings technology in the copper
                                                                                         mining industry
                                                                                     •   73% of water recovered, compared to 62% in conventional tailings
                                                                                     •   Required several years to optimise
                                                                                     •   Reduced moisture content of the dam saves enough water every year to fill 2,000
                                                                                         Olympic swimming pools. Requires 30-40% less land area

Increased transparency                                    Working in collaboration   •   TSF enclosure wall and extension to be completed in Q3 2020
 for communities and                                        with neighbouring        •   Using sea water encapsulates the dust
      government                                               communities

    1 Tailings Storage Facilities
    2 See You Tube https://www.youtube.com/watch?v=qGv8u7wfV30 (in Spanish)
                                                                                                                                                                           8
Antofagasta plc BMO Capital Markets 2020 Global Metals & Mining Conference - Iván Arriagada Chief Executive Officer
Innovation road map
   Transformational innovation - key to strategy
                ▪   Leaching of primary sulphides – industrial scale testing underway
   Strategic
                ▪   Low cost bulk material movement technologies
  Initiatives
                ▪   Thickened tailings and real time monitoring

    Online      ▪   Open online collaboration platform
Collaboration
  Platform      ▪   Over 20 efficiency and cost reduction initiatives in execution

  Real Time     ▪   Remote Operations Centre in the city of Antofagasta in feasibility
 Information    ▪   Use of data analytics for plant optimisation
Management &    ▪   Digital transformation of key support functions’ and maintenance
   Analytics        processes

                ▪   Remote production drilling at Los Pelambres
Automation &
                ▪   Autonomous trucks at Esperanza Sur pit, Centinela
  Robotics
                ▪   Maintenance execution robots

                                                                                         9
Antofagasta plc BMO Capital Markets 2020 Global Metals & Mining Conference - Iván Arriagada Chief Executive Officer
Copper market volatility persists
          Current market position                                               Copper exchange stocks
                                                                                 Stocks LME            Stocks CMX    Stocks Shanghai
▪    Long term fundamentals remain strong                                                                                                               1,000
▪    Market in balance in 2019
                                                                                                                                                        800

                                                                                                                                                                Thousand Tonnes
▪    Uncertainty – was due to US/China trade, now Covid-19
                                                                                                                                                        600
▪    Copper price down 7% this year
▪    Limited supply growth in 2020                                                                                                                      400

▪    Contracted annual TC/RCs down 23%                                                                                                                  200
▪    Occasional large inflows into exchange stockpiles
                                                                                                                                                        0
                                                                       Dec 16   Jun 17        Dec 17        Jun 18    Dec 18       Jun 19      Dec 19

                                                         Longer-term factors unchanged
                      Demand                                                                               Supply

    Urbanisation       Renewables           Electromobility                     Grade                    Increasing ESG                Lack of viable
                                                                                decline                   expectations                    projects

                                                                                                                                                                                  10
Organic and other growth opportunities
                                    2019                     2020                     2021         2022                  2023+

                                         Los Pelambres Expansion Phase 1                         Phase 2
                                               Cu +60 ktpa | Capex $1.3 bn                    Cu +35 ktpa|Capex $0.5 bn1
                                             (including $0.5 bn desalination plant)              15 year LOM extension
         Organic                                                Esperanza Sur Pit            Centinela 2nd Concentrator
         Growth                                             Cu +10-15 ktpa | Capex $0.17bn   Cu +180 ktpa | Capex $2.7 bn2
                                                          Zaldívar Chloride Leaching3
                                                           Cu +12 ktpa | Capex $0.17 bn

                                                                Exploration focusing on the Americas
           Other
                                   Transport division                                                      Twin Metals
          Growth
                                Increasing haulage capacity                                               Cu Eq +65 ktpa4
1   2014 Prefeasibility study
2   2015 Prefeasibility study
3   100%
4   2018 Prefeasibility study
                                                                                                                                 11
Projects under construction
     Adding 80-90,000 tonnes of annual copper production

                 Los Pelambres                                                                     Zaldívar
                                                                                                                                      Esperanza Sur Pit1
               Expansion - Phase I                                                              Chloride Leach

                 60,000 tonnes of                                                         10-15,000 tonnes of                       10-15,000 tonnes of
                 additional copper                                                         additional copper                         additional copper

         • 31% complete                                                              • Approved December 2019                    • Approved during H2 2019
         • Throughput will increase by 15kt to                                       • Will increase copper recoveries by        • Opening new pit at Centinela
           190kt of ore per day                                                        more than 10 percentage points            • Deposit contains 1.4 billion tonnes of
         • Includes additional milling and                                           • Upgrade Solvent Extraction (SX) plant       reserves
           flotation capacity, and a desalination                                      and the construction of additional        • Increased ore feed flexibility allows
           plant and pipeline                                                          washing ponds                               optimisation of plant operations
         • Capex of $1.3bn                                                           • 2022 first full year of production        • Production starts in 2022
         • 100% financed with unsecured long                                         • Capex of $0.19bn                          • Capex of $0.17bn
           term corporate loan

1   The deposit contains 1.4 billion tonnes of reserves with a grade of 0.4% copper, 0.13 g/t of gold and 0.012% of molybdenum
                                                                                                                                                                            12
2020 guidance
                                          Copper production (kt)
                                                                                                           Copper production
                                                                                                FY 2020
                                                                                               Guidance1   • Guidance 725-755kt
                                                                         770                   725-755     • Lower production due to lower grades,
                         704                     725
                                                                         130
                                                                                                              expected to reverse in 2021 as Centinela’s
Antucoya &                                       120                                             140          grades increase
Zaldívar                 132

                                                 248                     277                     245       Cash costs
Centinela                228
                                                                                                           • Cash costs before by-products of $1.70/lb
                                                                                                           • Net cash costs of $1.30/lb

Los Pelambres            334                     358                     363                     355       Capital expenditure
                                                                                                           • Total capex of $1.5bn, including $0.7bn on
                                                                                                              Los Pelambres expansion
                        2017                    2018                    2019                    2020E

     1   Includes each operation at mid-point of guidance range and Zaldívar on a 50% basis.
                                                                                                                                                           13
Our priorities for 2020
                          Continuing our record of zero fatalities
                          Sustainable long term operations
                          Delivering on guidance
                          Maintaining operating reliability and efficiency
                          Ensuring water availability at Los Pelambres
                          Mitigating risk of disruption due to social unrest in Chile
                          Further cost savings
                          Advancing growth projects
                          Progressing innovation portfolio
                          Returns to shareholders

                                                                                        14
Investment case

     High quality               Operating efficiency               Capital discipline           Robust platform
        assets                   and cost control
▪   Strong and growing          ▪   Cost and competitiveness   ▪   Low net debt             ▪   Continuing to optimise
    production                      programme                  ▪   Protecting margins and       mines
▪   Large resource base         ▪   Continuous productivity        profitability            ▪   Disciplined approach to
▪   Low cost and long-life          improvement                ▪   Consistent dividend          acquisitions and
    assets                      ▪   Innovation for long term       policy                       disposals
▪   Four mines in two “world-       gains                                                   ▪   Returning cash to
    class” districts in Chile                                                                   shareholders

                                CREATING VALUE FOR SHAREHOLDERS

                                                                                                                          15
Appendix
Antofagasta at a glance
    Group                                                              Antucoya
    • 65% owned by Luksic Group, 35% free float          •   70% owned
    • Market cap: $11.0 billion (February 20st 2020)     •   Copper production1: 72,200 t
                                                         •   Remaining mine life2: 21 years
    • FTSE 100
                                                         •   Reserves3: 641 million t @ 0.34% Cu
    Mining division1                                                   Centinela
    • Top 10 copper producer                             •   70% owned
    • High quality assets with significant potential     •   Copper production1: 248,000 t
      production growth                                  •   Remaining mine life2: 48 years
    • Copper production: 770,000 tonnes                  •   Reserves3: 2.2 billion t @ 0.42% Cu
                                                                                                         Santiago
    • Gold production: 282,300 oz
    • Molybdenum production: 11,600 tonnes                              Zaldívar
    • Net cash costs: $1.22/lb                           •   50% owned, operator
    • All operations in Chile, one of the world’s most   •   Copper production1: 94,600 t (100%)
      developed and stable mining locations              •   Remaining mine life2: 13 years
                                                         •   Reserves3: 468 million t @ 0.46% Cu
    Transport division1                                             Los Pelambres
    • Provides rail and road cargo services in Chile’s   •   60% owned
      Antofagasta Region                                 •   Copper production1: 357,800 t
    • Total tonnage transported: 6.5 million tonnes      •   Remaining mine life2: 15 years
                                                         •   Reserves3: 1.1 billion t @ 0.60% Cu,
                                                             0.019% Mo and 0.05g/t Au
1   2019 figures
2   From 31 December 2018
3   As of 31 December 2018 on 100% basis
                                                                                                    17              17
28%                                        29%                             49%
            Chile                                                          of global
                                                                       copper production
                                                                                                                      of global
                                                                                                                   copper reserves
                                                                                                                                                     of exports are
                                                                                                                                                         copper

   Strengths and challenges                                            Social situation and following steps
▪ Largest copper endowment in the world                            ▪ Oct 2019: Social unrest and demonstrations                              Antucoya
                                                                                                                                             Centinela
▪ Copper key contributor to the economy                            ▪ Apr 2020: National vote on rewriting constitution
                                                                                                                                              Zaldívar
▪ History of stability with robust institutions                    ▪ Oct 2020: Elect constitutional assembly members
▪ OECD country                                                     ▪ 12 months to propose a new constitution
▪ Solid public finances and low national debt                      ▪ Q4 2021: National vote to approve new constitution                    Los Pelambres
                                                                                                                                                                 Santiago
▪ Moving from middle to high income economy
▪ To decrease income inequality

                                                                        Key Indicators

    GDP1            Population2             Per Capita GDP       Poverty rate3             Mining4          Principal Markets5    Trade5    Inflation (CPI)6
   $474 bn             18.4                  1970: $2,300        1989: 47.0%              10.0% of              China 28%        29 FTAs      2019: 3.0%
    (PPP)             million                2018: $25,800        2017: 8.6%                GDP                  USA 14%       (66 markets)
                                                 (PPP)                                                            EU 13%

     1   2018 World Bank                                           4    Banco Central de Chile
     2   Censo 2017 Instituto Nacional de Estadísticas (INE)       5    Dirección General de Relaciones Económicas Internacionales Chile
     3   Ministerio de Desarrollo Social (Encuesta Casen 2015)     6    CPI 2019: Instituto Nacional de Estadísticas (INE)
                                                                                                                                                                            18
Drought in Central Chile
Context of the situation
▪   2019, driest year of a 10-year drought in Choapa Valley
▪   Low rain and snow fall so low recharge of aquifers
▪   Surface and underground water availability affected

Water use at Los Pelambres
▪   85% of water used is recirculated
▪   15% is from the mine, and surface & underground
▪   Water use has been reduced further by:
      ⁻     Stronger pipeline leakage maintenance
      ⁻     Covering water storage ponds
      ⁻     Less use of the dust suppression system

Engagement with authorities and communities
▪   Working with authorities and communities to find ways to alleviate impact of
    water shortage in the short, medium and long term
▪   Prioritising water for human consumption
▪   Pumping water into the Choapa river from underground
▪   Minimising water losses by through maintenance of canals and waterways
▪   Providing food, and moving livestock to less water stressed areas

                                                                                   19
Production and metals prices
       Group production1                                                      Metal prices

                                  2016    2017    2018    2019     2020E1                         2016    2017    2018    2019
       Copper ('000 tonnes)                                                   Copper ($/lb)
       Los Pelambres              355.4   343.8   357.8   363.4   350-360     Realised            2.33    3.00    2.81    2.75
       Centinela Concentrates     180.4   163.9   155.5   195.5               LME                 2.21    2.80    2.96    2.72
                                                                  240-250
       Centinela Cathodes          55.8    64.5    92.5   81.1
       Antucoya(2)                 66.2    80.5    72.2   71.9     80-85
       Zaldívar(3)                 51.7    51.7    47.3   58.1     55-60
       Group total                709.4   704.3   725.3   770.0   725-755

                                  2016    2017    2018    2019     2020E1                         2016    2017    2018    2019
       Gold ('000 ounces)                                                     Gold ($/oz)
       Los Pelambres               57.8    55.4    63.2   59.7     50-60      Realised            1,256   1,280   1,256   1,416
       Centinela                  213.0   157.0   146.9   222.6   130-140     Market              1,248   1,258   1,270   1,393
       Group total                270.9   212.4   210.1   282.3   180-200

                                  2016    2017    2018    2019     2020E1                         2016    2017    2018    2019
       Molybdenum ('000 tonnes)                                               Molybdenum ($/lb)
       Los Pelambres               7.1    10.5    13.3    11.2    10.0-11.0   Realised             6.8     8.7    12.4    10.8
       Centinela                    -      -      0.3      0.4     2.5-3.0    Market               6.5     8.2    11.9    11.4
       Group total                 7.1    10.5    13.6    11.6    12.5-14.0

1   Guidance January 2020
                                                                                                                                  20
Unit cash costs
         Group cash costs1

                                                      2016     2017     2018     2019     2020E1            Cash costs before by-product credits
       Group cash costs ($/lb)                                                                                            HY 2019
       Los Pelambres                                   1.06     1.02     0.91     0.91     1.00
       Centinela                                       1.19     1.36     1.51     1.26     1.50                                Others
       Antucoya                                        1.83     1.68     1.99     2.17     1.90                                    8%               Energy
                                                                                                        Other inputs                          14%
       Zaldívar                                        1.54     1.62     1.94     1.75     1.70
                                                                                                                       11%
       Cash costs before by-products credits ($/lb)    1.54     1.60     1.72     1.65     1.70
       By-products credits ($/lb)                     (0.34)   (0.35)   (0.43)   (0.43)   (0.40)
       Net cash costs ($/lb)                           1.20     1.25     1.29     1.22     1.30    Sulphuric acid 6%                                   13% Labour

                                                      2016     2017     2018     2019     2020E1
                                                                                                                                 $1.66/lb
                                                                                                         Fuel & 7%
       Los Pelambres cash costs ($/lb)
                                                                                                      lubricants
       Cash costs before by-products credits ($/lb)    1.36     1.44     1.52     1.40     1.45
                                                                                                                                                     16%
       By-products credits ($/lb)                     (0.30)   (0.42)   (0.61)   (0.49)   (0.45)
                                                                                                                         13%
       Net cash costs ($/lb)                           1.06     1.02     0.91     0.91     1.00
                                                                                                           Materials &                                     Services
                                                                                                           spare parts                  13%
                                                                                               1
                                                      2016     2017     2018     2019     2020E
       Centinela cash costs ($/lb)                                                                                             Maintenance services
       Cash costs before by-products credits ($/lb)    1.75     1.81     1.89     1.83     2.00
       By-products credits ($/lb)                     (0.56)   (0.45)   (0.38)   (0.57)   (0.50)
       Net cash costs ($/lb)                           1.19     1.36     1.51     1.26     1.50

1   Guidance January 2020
                                                                                                                                                                      21
Market data
340                                                                                                  1,600

320
                                                                                                     1,500
300                                                    296 c/lb
             280 c/lb                                                                                1,400
280                                                                                 272 c/lb
                                                                                                                                                                         1,394 US$/oz
260                                                                                                  1,300                                     1,269 US$/oz
240
                                                                                                     1,200          1,258 US$/oz
220                                                                          Copper                  1,100
                                                                                                                                                                                Gold
200                                                                           $c/lb                                                                                             $/oz
180                                                                                                  1,000
  Jan 2017       Jul 2017        Jan 2018   Jul 2018         Jan 2019    Jul 2019         Jan 2020       Jan 2017   Jul 2017    Jan 2018   Jul 2018    Jan 2019      Jul 2019         Jan 2020

14                                                                                                    900

12                                                                          11 US$/lb
                                                                                                      800
                                                                                                                                                                                         773
                                                   12 US$/lb
10
                                                                                                      700
 8                                                                                                                             649                                              703
                           8 US$/lb
 6                                                                                                    600                                             640
 4
                                                                        Molybdenum                    500                                                         Exchange rate
 2
                                                                            $/lb                                                                                     CLP/$
  0                                                                                                   400
 Jan 2017       Jul 2017         Jan 2018   Jul 2018         Jan 2019    Jul 2019        Jan 2020       Jan 2017    Jul 2017    Jan 2018   Jul 2018    Jan 2019      Jul 2019         Jan 2020

                                                                                                                                                                                                 22
Reserves and resources as of 31 December 2018
                                                                              Tonnage (millions tonnes)     Copper (%)        Molybdenum (%)              Gold (g/t)             Attributable Tonnage (millions tonnes)
                                                                                  2018           2017     2018         2017    2018       2017          2018         2017                    2018                  2017
     Ore reserves
      Los Pelambres                                                              1,132.2       1,193.4     0.60        0.60    0.019         0.020        0.05          0.05                679.3                 716.0
      Centinela Concentrates (Esperanza Sulphides, including Esperanza Sur)      1,845.2       1,873.4     0.42        0.42    0.012         0.012        0.14          0.14              1,291.6               1,311.4
      Centinela Cathodes                                                           326.0         191.5     0.40        0.39        -             -           -             -                228.2                 134.0
      Centinela Total                                                            2,171.2       2,064.9     0.42        0.42        -             -           -             -              1,519.8               1,445.4
      Antucoya                                                                     640.7         676.4     0.34        0.33        -             -           -             -                448.5                 473.4
      Encuentro                                                                        -         112.2        -        0.53                                                                     -                 112.2
     Total                                                                       3,944.1       4,046.8     0.46        0.46        -             -           -               -            2,647.6               2,747.1
     Group Joint Ventures
      Zaldívar                                                                     467.5         428.5     0.46        0.51                                                                 233.7                 214.2

     Total Group Ore Reserves                                                   4,411.6       4,475.3     0.46         0.47        -             -           -               -            2,881.4              2,961.3

     Mineral resources (including ore reserves)
     Los Pelambres                                                               6,113.4       6,024.1     0.50        0.51    0.017         0.016        0.05          0.05               3,668.0              3,614.4
     Centinela Concentrates (Esperanza Sulphides & Esperanza Sur)                3,962.0       3,177.7     0.39        0.38    0.012         0.011        0.13          0.12               2,773.4              2,224.4
     Centinela Cathodes (El Tesoro)                                                551.8         307.5     0.40        0.38        -             -           -             -                 386.3                215.2
     Antucoya                                                                    1,253.7       1,291.8     0.30        0.30        -             -           -             -                 877.6                904.3
     Encuentro1                                                                        -       1,117.4        -        0.44                                                                      -              1,117.4
     Polo Sur                                                                    1,514.5       1,514.5     0.34        0.34        -             -            -              -             1,514.5              1,514.5
     Penacho Blanco                                                                340.2         340.2     0.37        0.37        -             -            -              -               173.5                173.5
     Mirador                                                                        86.4          95.4     0.32        0.33        -             -            -              -                78.5                 85.6
     Los Volcanes                                                                1,904.2       1,904.2     0.50        0.50        -             -            -              -               971.1                971.1
     Llano-Paleocanal1                                                                 -          64.2        -        0.46        -             -            -              -                   -                 49.5
     Brujulina                                                                      87.2          87.2     0.49        0.49                          Total precious metals                    44.5                 44.5
                                                                                                                                Nickel (%)
     Sierra                                                                         52.0          52.0     0.69        0.69                             (g/t Au+Pt+Pd)                        52.0                 52.0
      Twin Metals                                                                2,509.1       2,371.7     0.52        0.52    0.171         0.173       0.473         0.465               2,085.0              1,967.0
     Group Joint Ventures
      Zaldívar                                                                     818.6         613.0     0.41        0.48        -             -           -               -              409.3                 306.5

     Total Group
     Measured + Indicated                                                       10,566.8      10,484.6     0.46        0.47        -             -           -               -             7,385.6              7,663.9
     Inferred                                                                    8,626.4       8,476.2     0.43        0.43        -             -           -               -             5,648.3              5,576.0

     Total Group Mineral Resources (including ore reserves)                    19,193.2     18,960.8      0.45         0.45        -             -           -               -          13,033.8              13,239.9

1   Encuentro and Llano-Paleocanal included in Centinela from 2018
                                                                                                                                                                                                                          23
Antofagasta contacts

       Andrew Lindsay        alindsay@antofagasta.co.uk           Andrés Vergara       avergara@antofagasta.co.uk

   Director, London Office      Tel: +44 20 7808 0988     Investor Relations Manager     Tel: +44 20 7808 0988
www.antofagasta.co.uk
You can also read