Appendix F: Tier 2 Cultural Resources Appendix - South Atlantic Division
←
→
Page content transcription
If your browser does not render page correctly, please read the page content below
Appendix F: Tier 2 Cultural Resources Appendix

TABLE OF CONTENTS

1 INTRODUCTION ................................................................................................................................. 1
    1.1        Overview ....................................................................................................................................... 1
    1.2        Purpose of this Appendix .............................................................................................................. 1
2      CULTURAL RESOURCES EXPOSED TO COASTAL STORM HAZARDS ................................................. 2
    2.1        North Carolina ............................................................................................................................... 2
       2.1.1 Planning Reach NC_01 ................................................................................................................. 2
       2.1.2 Planning Reach NC_02 ................................................................................................................. 4
    2.2 South Carolina ..................................................................................................................................... 4
       2.2.1 Planning Reach SC_03 .................................................................................................................. 4
       2.2.2 Planning Reach SC_04 .................................................................................................................. 7
    2.3 Georgia (Planning Reach GA_05) ...................................................................................................... 10
    2.4 Florida ............................................................................................................................................... 16
       2.4.1 Planning Reach FL_06, Northeast Florida .................................................................................. 17
       2.4.2 Planning Reach FL_07, East Central Florida ............................................................................... 17
       2.4.3 Planning Reach FL_08, Southeast Florida .................................................................................. 17
       2.4.4 Planning Reach FL_09, South Florida ......................................................................................... 18
       2.4.5 Planning Reach FL_10, Southwest Florida ................................................................................. 18
       2.4.6 Planning Reach FL_11, West Central Florida ............................................................................. 19
       2.4.7 Planning Reach FL_12, Florida Big Bend .................................................................................... 20
       2.4.8 Planning Reach FL_13, Florida Panhandle ................................................................................. 20
    2.5 Alabama (Planning Reach AL_14) ..................................................................................................... 21
    2.6 Mississippi (Planning Reach MS_15) ................................................................................................. 23
    2.7 Puerto Rico ........................................................................................................................................ 24
       2.7.1 Planning Reach PR_1 .................................................................................................................. 24
       2.7.2 Planning Reach PR_2 .................................................................................................................. 26
       2.7.3 Planning Reach PR_3 .................................................................................................................. 28
       2.7.4 Planning Reach PR_4 .................................................................................................................. 30
    2.8 U.S. Virgin Islands .............................................................................................................................. 32
       2.8.1 Planning Reach VI_1, St. Croix ................................................................................................... 32
       2.8.2 Planning Reach VI_2, St. Thomas ............................................................................................... 35
       2.8.3 Planning Reach VI_3, St. John .................................................................................................... 37
3 Cultural Stakeholder and Tribal Nation Coordination ...................................................................... 39

                                                                                i
3.1 Coordination with Tribal Nations in 2019 ......................................................................................... 40
   3.2 Cultural Stakeholder and Tribal Nation Workshop on August 4, 2020 ............................................. 40
4 References ...................................................................................................................................... 41

                                                            LIST OF FIGURES

Figure 1. NPS NRHP Data (red) versus NCSHPO NRHP (blue), Wilmington, North Carolina......................... 3
Figure 2. Historic Resources Recorded in the GNAHRGIS that are located in the Existing and Future
Conditions 1 Percent and 10 Percent Flood Scenarios (with 3 feet of sea level rise) ................................ 12
Figure 3. Cultural Resources in Planning Reach PR_1 (NPS 2014) .............................................................. 26
Figure 4. Cultural Resources in Planning Reach PR_2 ................................................................................. 28
Figure 5. Cultural Resources in Planning Reach PR_3 ................................................................................. 30
Figure 6. Cultural Resources in Planning Reach PR-4 ................................................................................. 32
Figure 7. Fort Christiansvaern on the Christiansted Waterfront (NPS, 2020g) .......................................... 34
Figure 8. Cultural Resources in Planning Reach VI_1 (NPS 2014) ............................................................... 35
Figure 9. Cultural Resources in Planning Reach VI_2 (NPS 2014) ............................................................... 37
Figure 10. Ruins of the Little Lameshur Plantation (NPS 2020) .................................................................. 38
Figure 11. Cultural Resources in Planning Reach VI_3 (NPS 2014) ............................................................. 39

                                                              LIST OF TABLES
Table 1. Archaeological Sites in Georgia Exposed to the 1 Percent and 10 Percent Annual Exceedance
Probability Flood Hazard ............................................................................................................................. 11
Table 2. Historic Resources Sites in Georgia Exposed to the 1 Percent and 10 Percent Annual Exceedances
Probability Flood Hazard ............................................................................................................................. 11
Table 3. Exposed Cultural Resources Areas in Georgia by County ............................................................. 13

                                                             ATTACHMENTS
Attachment A: South Atlantic Coastal Study Cultural Stakeholder and Tribal Nation Coordination

                                                                           ii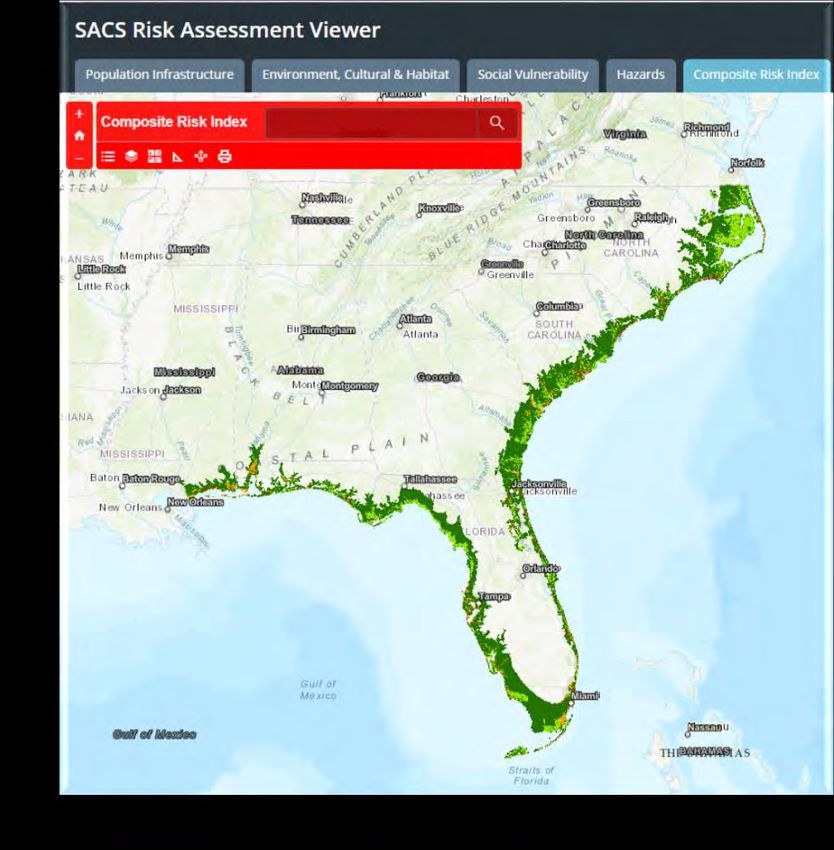
1 INTRODUCTION
1.1 Overview
A qualitative assessment of exposure, vulnerability, and risk to cultural resources from increased coastal
storm damages as a result of sea level rise was conducted for the South Atlantic Coastal Study (SACS). The
SACS definitions of exposure, vulnerability, and risk are provided below:

    •   Exposure is who and what may be harmed by a flood hazard. Exposure incorporates a description
        of where the flooding occurs at a given frequency and what exists in that area (U.S. Army Corps
        of Engineers (USACE) Engineering Regulation (ER) 1105-2-101).

    •   Vulnerability is the susceptibility of harm to human beings, property, and the environment when
        exposed to a hazard. Depth-damage functions, depth-mortality functions, and other similar
        relationships can be used to describe vulnerability (ER 1105-2-101). In the context of SACS,
        vulnerability is the sensitivity of populations, infrastructure, and environmental and cultural
        resources to coastal storm hazards, and adaptive capacity of the receptors or assets within the
        system to withstand and recover from the hazards. In the North Atlantic Coast Comprehensive
        Study (NACCS), probability of occurrence was used as the only measure of sensitivity to a coastal
        flood hazard, and adaptive capacity was not assessed. In SACS, vulnerability is assessed in
        state/territory appendices to refine potential risk areas identified in the Tier 1 Risk Assessment.

    •   Risk is broadly defined as a situation or event in which something of value is at stake and its gain
        or loss is not certain. Risk is typically expressed as a combination of the likelihood and
        consequence of an event. Consequences are measured in terms of harm to people, cost, time,
        environmental harm, property damage, and other metrics (ER 1105-2-101).

Consistent with the SACS objectives discussed in the main report, the SACS qualitatively assessed the
vulnerability and potential risk of cultural resources within the coastal areas of the South Atlantic Division
to increased hurricane and storm damages as a result of 3 feet of sea level rise over a 100-year planning
horizon based on USACE intermediate sea level change estimates. Using the results of the analysis, the
SACS cultural team and district project delivery teams identified Planning Reach-specific opportunities to
reduce the risk to at-risk cultural resources through a range of potential measures. These opportunities
were used to formulate specific and detailed actions achievable by federal and/or non-federal
stakeholders to address risk.

The USACE North Atlantic Coastal Comprehensive Study (NACCS) assessed the vulnerability of
populations, infrastructure, and resources at risk throughout the North Atlantic Coastal region. The NACCS
Tier 1 Risk Assessment evaluated exposure of environmental and cultural resources to coastal storm surge
inundation and sea level rise. Similar to the NACCS, risk to environmental and cultural resources from
coastal storm surge inundation and sea level rise was evaluated in the SACS Tier 1 Risk Assessment (refer
to the SACS Main Report for an explanation of the Tier 1 Risk Assessment). Potential protection strategies
for exposed cultural resources are provided in the SACS state and territory appendices and Focus Area
Action Strategies. Any strategy would need to be in compliance with Section 106 of the NHPA before
implementation.

1.2 Purpose of this Appendix
This appendix provides information on cultural resources in the SACS study area that are exposed to
coastal storm hazards including storm surge inundation, erosion, and wave attack that increase as sea

                                                      1
level rises. This appendix does not provide all or comprehensive information on exposure to cultural
resources but contains select information that augments the information provided in the SACS state and
territory appendices. This appendix does not include assessments of vulnerability or risk to cultural
resources. Qualitative assessments of vulnerability and risk to cultural resources are included in the SACS
state and territory appendices.

For the purpose of SACS, cultural resources include precontact and historic structures and buildings,
archaeological sites, cemeteries, museums, shipwrecks, tribal sites, historic landmarks, monuments,
historic United States Department of Defense (DoD) installations, historic districts, and traditional cultural
places. Cultural resources are important to consider in this study because these resources are prevalent
throughout the SACS study area and are threatened by increased coastal storm damages as a result of sea
level rise. Cultural resources hold multiple and diverse values to local communities, visitors, and the
general public. These resources are irreplaceable, and their meaning is often tied to their specific location
(NC State University, 2018). Archaeological sites are non-renewable resources and once a site has been
lost, it cannot be replaced. Section 106 of the National Historic Preservation Act (NHPA) and its
implementing regulations in 36 CFR Part 800 does not apply to the SACS because the SACS is will not result
in an action.

This appendix does not include information on vulnerable environmental resources in the SACS study
area. The SACS Environmental Technical Report provides information on vulnerable and at-risk
environmental resources and priority environmental areas.

2 CULTURAL RESOURCES EXPOSED TO COASTAL STORM HAZARDS
The SACS Tier 1 Risk Assessment included regionally applicable and publicly available cultural resources-
related data and information. These data included historic properties listed on the National Park Service’s
(NPS) National Register of Historic Places (NRHP) to include specific points and polygons approximating
boundaries (NPS, 2020a). The NRHP data was used for the Tier 1 Risk Assessment because it is public data
available for the entire SACS study area. Findings of exposure from storm surge inundation and sea level
rise to cultural resources in the SACS Tier 1 Risk Assessment are described in detail in the SACS state and
territory appendices. This report does not discuss findings from the Tier 1 Risk Assessment.

The Tier 2 analysis allowed for additional input from local stakeholder agencies, on a per-state and
territory basis, and for additional publicly available data inclusion. Each state and territory maintain an
inventory of historic properties as required by the NHPA (NPS, 2021). Sections 2.1 through 2.8 below
identify the datasets used to assess exposure of cultural resources to coastal storm hazards in each state
and territory.

Please note: Due to the size of the study area, this document does not provide all, or comprehensive,
information on exposed cultural resources. This document contains select information that augments
state and territory appendices.

2.1 North Carolina
2.1.1 Planning Reach NC_01
The North Carolina State Historic Preservation Office (NCSHPO) and the North Carolina Office of State
Archaeology (NCOSA) were consulted regarding opportunities to enhance resiliency and lower risks to
cultural resources related to increased hurricane and storm damages resulting from sea level rise in North
Carolina. Both entities expressed concerns regarding vulnerabilities of historic structures, archaeological
sites, cemeteries, museums, shipwrecks, and historic United States DoD installations that were not

                                                      2
included in the SACS Tier 1 Risk Assessment. Cultural resources in these categories that are listed on the
National Register of Historic Places (NRHP) were included in the Tier 1 analysis. Exposed DoD installations,
specifically, have been included in the Tier 2 analyses, but are discussed elsewhere. Unless listed in the
NRHP, archaeological site, cemetery, and shipwreck location data are not explicitly included in the Tier 2
analysis. In accordance with the policies of USACE, NCSHPO, and NCOSA, these locations are not made
publicly available given their sensitive nature and concerns for damage to the resources. However,
omission of specific location data does not ignore the vulnerabilities of coastal archaeological sites,
cemeteries, and shipwrecks to storm damages and sea level rise.

Tribal nations (i.e., federally- and state-recognized tribes in North Carolina with an interest in the SACS
study area) were also contacted and asked to collaborate regarding applicable at-risk resources. No
feedback from North Carolina tribal nations was received to inform this study. Refer to Attachment 1 for
a list of the tribal nations contacted.

Regarding shipwrecks, coastal North Carolina is host to a multitude of sunken vessels. Known as the
Graveyard of the Atlantic, waters near North Carolina and its barrier islands have been infamously difficult
to navigate and have contributed to many shipwrecks ranging from pleasure craft to military craft to
pirate/privateer vessels (NPS, 2018a). For example: the Huron, which was the last iron-built American
naval vessel, rests near milepost 11/12 at Nags Head and the Triangle Wrecks rest near milepost 7 in Kill
Devil Hills. Contrary to the suggestive name, the triangle wrecks are only two ships. The Kyzickes and the
Carl Gerhard wrecked at the exact same location in the late 1920s (Outer Banks of North Carolina, 2020).

The NCSHPO data more accurately defines polygons associated with NRHP properties as compared to NPS
data (NCSHPO, 2020; Figure 1). The NCSHPO data also depicts a broader range of resource categories as
compared to the NPS data informing the SACS Tier 1 Risk Assessment including properties and districts
determined eligible for NRHP listing, study-listed properties, properties designated as local landmarks,
and others. These expanded, North Carolina-specific data provide greater geographic context of resources
that may be vulnerable to coastal storm damage and sea level rise.

Figure 1. NPS NRHP Data (red) versus NCSHPO NRHP (blue), Wilmington, North Carolina

Programs presently underway designed to protect specific vulnerable cultural resources in Planning Reach
NC_01 include the NPS Cape Hatteras Group’s efforts to address climate change options for cultural
resources along the Cape Hatteras and Cape Lookout National Seashores, and continued efforts of
organizations including:

                                                     3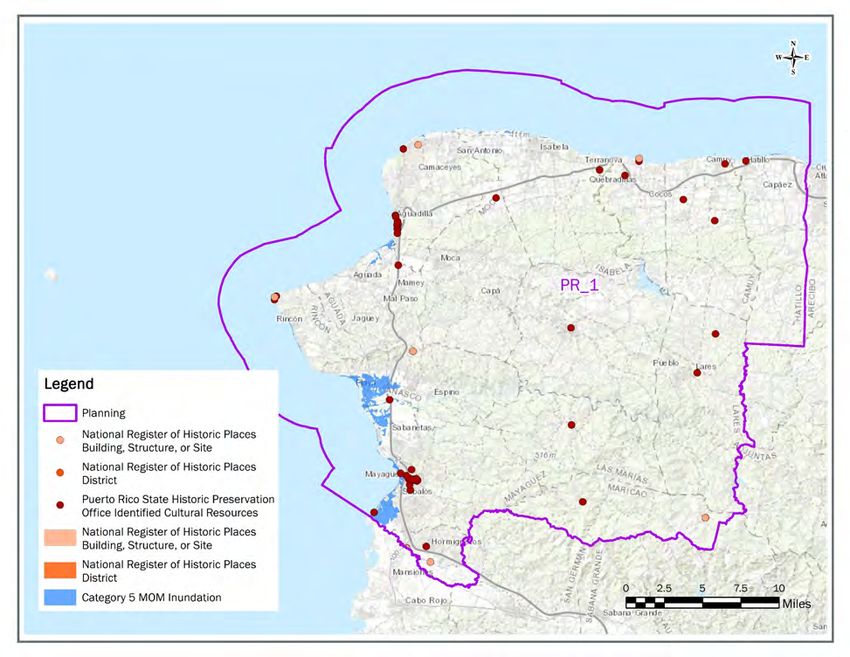
•   Outer Banks Conservationists (https://obcinc.org/)

    •   Ocracoke Preservation Society (https://www.ocracokepreservation.org/)

    •   Ocracoke Foundation (https://www.ocracokefoundation.org/)

    •   Whalehead Club (http://www.visitcurrituck.com/places/corolla/whalehead-in-historic-corolla/)

Additionally, efforts to provide aid to local governments’ historic preservation commissions to assist with
physically raising elevations of historic resources and North Carolina flood Insurance assistance to affected
owners of historic homes assist in protecting cultural resources and properties.

As effects of storm damage and sea level rise increase, such as erosion and gradual inundation, coastal
cultural resources are increasingly vulnerable allowing for the potential loss of significant historic data.
The NCSHPO has commented that the most effective long-term solution for protecting coastal cultural
resources against the effects of storm damage and sea level rise is to alter practices that contribute to sea
level rise. In the short term, data recovery mitigation excavations would allow for data associated with
vulnerable coastal cultural resources to be retained; however, data recovery mitigation excavations may
be prohibitively expensive to conduct.

2.1.2 Planning Reach NC_02
As stated in Section 2.1.1 above, coastal North Carolina is host to a multitude of sunken vessels. Edward
Teach (Blackbeard)’s ship, the Queen Anne’s Revenge, rests near Beaufort Inlet near Morehead City
(NCDCR, 2021b) and waters off New Hanover County’s barrier islands contain the Cape Fear Civil War
Shipwreck District (NCDCR, 2021a).

Planning Reach NC_02 in North Carolina also encompasses the northernmost portion of the Gullah
Geechee Cultural Heritage Corridor, which stretches from Wilmington, North Carolina to Jacksonville,
Florida (NPS, 2017). The Gullah Geechee people are the descendants of African slaves that labored on
rice, indigo, and cotton plantations along the southern Atlantic coast, and are named for the unique creole
language spoken by a portion of its members (GGCHCC, 2021). Gullah Geechee is the only distinctly African
creole language in the United States, and Gullah Geechee expressions of food, art spirituality remain
distinctive cultural characteristics.

Programs presently underway to protect specific vulnerable cultural resources in Planning Reach NC_02
include examples such as a partnership between the University of North Carolina at Wilmington and the
U.S. Naval Academy for the construction and monitoring of wave attenuators at Brunswick Town/Fort
Anderson in Brunswick County to slow the loss of a historic wharf to erosion. Additionally, efforts to
provide aid to local governments’ Historic Preservation Commissions to assist with physically raising the
elevations of historic resources and North Carolina Flood Insurance assistance to affected owners of
historic homes assist in protecting cultural resources and properties.

2.2 South Carolina
2.2.1 Planning Reach SC_03
Using information and datasets from NPS, the South Carolina Institute of Archeology and Anthropology
(SCIAA) and the South Carolina Department of Archives and History (SCDAH)’s ArchSite, and the United
States Geological Survey (USGS), exposure of significant cultural resources to coastal storm hazards can
be evaluated. Data gathered from these databases are current as of June 2021, and any cultural resources
added after that point will not be represented in this analysis throughout the report.

                                                     4
•    NRHP: The data was developed by NPS to protect historic and archaeological resources (NPS,
          2020a). The NRHP has a comprehensive inventory of cultural resources that are deemed worthy
          of preservation. The data provides spatial data of where historic points and historic places
          (polygons) occur relative to different types of hazards.

     •    Geographic Names Information System (GHIS) Historical Features: The data was developed by
          the U.S. Geological Survey (USGS) to maintain uniform feature name usage throughout the
          government (USGS, 2021). The Geographic Names Information System (GHIS) contains
          information about historical features and cultural resources. The data provides spatial data of
          where physical, cultural, political, and historical points occurs relative to different types of
          shorelines and hazards.

     •    ArchSite: Additional cultural resources data from ArchSite were used to refine hazards to cultural
          resources in the Tier 2 analysis. Information about archaeological and historic resources is
          contained in ArchSite, an online cultural resource information system for South Carolina (SCIAA
          and SCDAH, 2017). ArchSite combines data from the state’s archaeological and built environment
          (i.e., historic resources) to provide researchers with an online source for cultural resources
          information. This dataset identifies known historic properties (buildings, structures, sites,
          landscape features, and districts) that are eligible for listing, but not listed on the NRHP; resources
          that require additional evaluation for NRHP eligibility; and resources that are not eligible for listing
          on the NRHP that would be exposed to storm hazards. Archaeological sites that would be exposed
          to hazards are also identified using this dataset.

The 1 percent and 10 percent annual exceedance probability (AEP) 1 flood scenario with 3 feet of sea level
rise (SACS combined hazard plus sea level rise layer located in the SACS geoportal at
https://www.sad.usace.army.mil/SACS/) was used to demonstrate the exposure from coastal storm
inundation and sea level rise in the future condition. The coastal critical erosion areas layer was used to
identify cultural resources exposed to coastal erosion. Wave attack was evaluated using the National
Oceanic and Atmospheric Administration (NOAA) Environmental Sensitivity Index (ESI) shoreline layer for
the continental United States (CONUS). Exposed shorelines have high and mixed wave energy while
sheltered shorelines have low wave energy. Exposed shoreline types indicate exposure of cultural
resources to wave attack within higher wave energy environments.

The outputs identified several areas in this planning reach that are exposed to storm surge inundation,
erosion, and wave attack. Historic resources (e.g., buildings and structures) account for the most abundant
resource type in Reach SC_03 (n=3,015). These resources include those that are eligible and noneligible
for NRHP listing, and the information related to these resources is publicly available, including their
location. The highest concentration of historic resources (n=874) is located in Horry County in the North
Myrtle Beach and Myrtle Beach areas. The majority of these resources are residential buildings that date
from the early 1900s to 1950s and are located near the shoreline in heavily developed and populated
areas.

Archaeological sites are the second most abundant resource type in the Planning Reach (n=1,290). These
sites are scattered throughout the Planning Reach but are concentrated in close proximity to rivers,
creeks, streams, and marshes. The highest concentration of archaeological sites is found in Georgetown

1AEP (measured as a percentage) is a term used to describe flood size. It is a means of describing how likely a flood is to occur in
a given year.

                                                                 5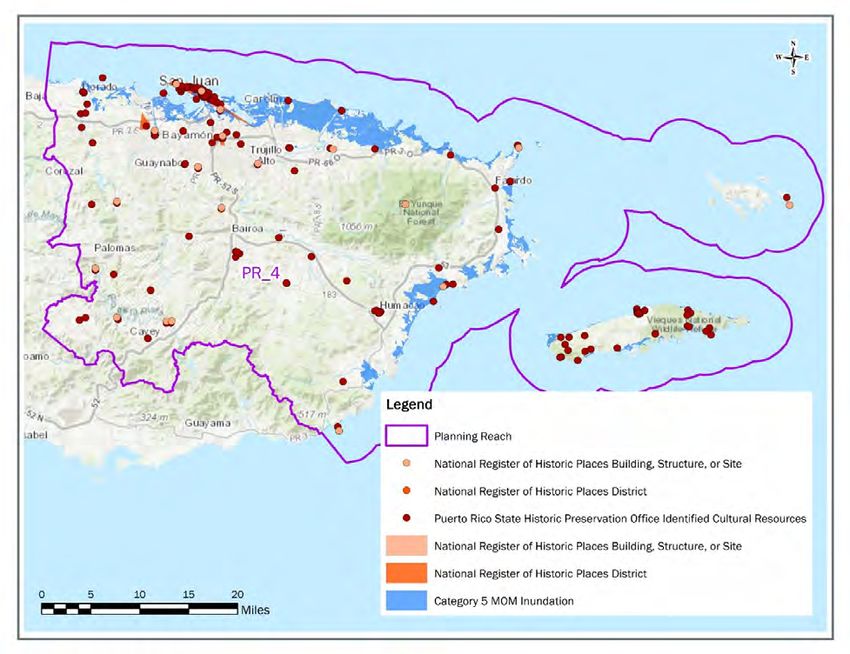
County (n=615). High concentrations of sites are located near the Waccamaw River that date to both the
prehistoric and historic periods.

There are 28 resources classified as historic areas in the Planning Reach. These resources are historic
districts, boundary expansions, or multiple resource areas that are eligible for, but not listed on the NRHP,
contribute to an existing historic district, or have been determined not eligible for listing. The area
surrounding Georgetown contains numerous historic areas that are related to the rice culture in South
Carolina.

The following cultural resources are highlighted as they illustrate the range of properties present and the
potential impacts from flooding, erosion, storm surge, etc. This is not an all-inclusive list. Cultural
resources within the areas were selected through both quantitative means, such as determining which
cultural resources were located in areas of greater exposure, and qualitative means, such as stakeholder
input. A selection of historic properties and districts are highlighted due to their National Register status
and stakeholder input regarding their historical significance and concern for continued preservation due
to their higher exposure rating. General information is also included regarding the presence of
archaeological sites in areas of higher exposure.

Myrtle Beach and North Myrtle Beach, and Georgetown County (MPS-031)
South Carolina’s first major agricultural staple was rice and during the Colonial period, South Carolina was
the largest producer of rice in the colonies, with Georgetown County as the leading producer. The
economy in the region was dominated by this product for nearly 200 years until the Civil War disrupted
cultivation. There are still many standing structures associated with rice cultivation in Georgetown
County, as well as archaeological evidence. The entirety of Georgetown County is a multiple property
NRHP nomination for rice culture from 1750 to 1910 (NPS, 1988a). The area contains at least 1,000
buildings that are 50 years or older. One thousand is the default maximum return for search results. Nine
hundred and four (904) are not eligible for the NRHP; 34 are individually eligible; 62 contribute to an
eligible historic district. Over half (602) are located in Myrtle Beach proper. There are four historic districts
within the area, including 1) Myrtle Heights-Oak Park (Myrtle Beach), 2) Socastee Historic District, 3)
Murrells Inlet Historic District, and 4) Downtown Myrtle Beach. There are eight individually listed
properties (five in Myrtle Beach, two in Murrels Inlet, and one in Georgetown). Significance of the
resources is tied to development of the area as a coastal resort/tourist destination beginning in the early
1900s through mid-1950s. The low-lying districts could be prone to flooding, storm surges, and erosion.
The aging infrastructure will struggle with light rainstorms, with nuisance flooding regularly closing streets
in the historic districts.

Pee Dee River Rice Planter’s Historic District (NRHP Ref. No. 88000532)
There are still many standing structures associated with rice cultivation in Georgetown County, as well as
archaeological evidence and the rice fields themselves. One multiple property NRHP–listed resource is
associated with rice plantations that flourished from the mid-1700s to the early 1900s. This multiple
property nomination includes features from 12 rice plantations on the Pee Dee River and five plantations
on the Waccamaw River. Additionally, there are individually listed NRHP resources in the vicinity of
Georgetown that are associated with rice cultivation (NPS, 1988b) (South Carolina Historic Properties
Record, n.d.). With any increase in the current rate of sea-level rise combined with storm events, these
resources will experience large changes and degradation due to erosion. Resource such as rice trunks and
wharves that are constructed of wood that are located in the river or creek bank would be subjected to
inundation and accelerated rates of deterioration.

                                                       6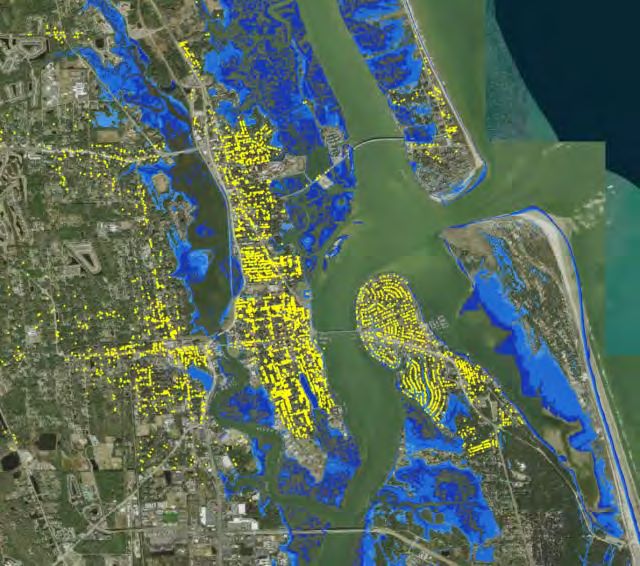
Brookgreen Gardens (NRHP Ref. No. 78002510)
This resource is home to an expansive archaeological site associated with the use of the property as
former rice plantations, as well as a historic sculpture garden and wildlife preserve, located south
of Murrells Inlet, South Carolina. The 9,100-acre property features nature reserves of several different
ecosystems, several gardens, a zoo, and various trails throughout the property (DOI, 1978). Founded
by Archer Milton Huntington and his wife Anna Hyatt Huntington, the purpose of the gardens was to
feature sculptures by American sculptors, including Anna and her sister Harriet Randolph Hyatt Mayor.
The gardens opened in 1932 after being built on four former rice plantations. The garden’s name
originates from the former Brookgreen Plantation, which had been the home of Joshua John Ward, who
was the largest slaveholder in America at the time of his death in 1853 (NPS, 1978). The park is located
between the Waccamaw River and Huntington Beach State Park on the Atlantic Ocean, and due to the
resource’s low elevation, makes it susceptible to flooding and erosion from coastal storm surges which
will worsen with sea level rise. Huntington’s nearby residence, Atalaya, is now part of the Huntington
Beach State Park and is listed on the NRHP.

Hobcaw Barony (NRHP Ref. No. 94001236)
Hobcaw Barony is a 16,000-acre research reserve and one of a few tracts on the Waccamaw Neck that
remains undeveloped. The Hobcaw Barony site is associated with rice cultivation and illustrates changes
in land use post-Civil War from a rice plantation to a winter hunting resort. The land became a colonial
land grant (i.e., barony) in 1718 and was subdivided into plantations. Rice production continued in this
area until the beginning of the 20th century. The property was purchased in 1905 by Bernard M. Baruch,
who was a Wall Street financier and also served as an adviser to several presidents. He used the house
and lands as a winter hunting retreat. He eventually sold the land to his daughter Belle Baruch, who
created a foundation to manage the land in perpetuity. It now serves as an outdoor laboratory. The site
includes 42 contributing buildings, 53 contributing sites, and 25 contributing structures. This area is home
to expansive prehistoric shell middens and evidence of colonial land use (South Carolina Department of
Archives and History, 2021a; Hobcaw Barony, n.d.). Due to the configuration of the Waccamaw Neck and
its proximity to Winyah Bay, as well as the Atlantic Ocean, all resources on the reserve may occasionally
experience overwash and are more vulnerable to erosion.

2.2.2 Planning Reach SC_04
Several areas in this Planning Reach are exposed to storm surge inundation, erosion, and wave attack.
Archaeological resources account for the most abundant cultural resource type in Planning Reach SC_04
(n=7,458). Resources found throughout the Planning Reach have the highest concentrations near rivers,
the coast, and on barrier islands in Charleston and Beaufort Counties (n=5,777). These sites date from
both the prehistoric and historic periods and several of these sites contain the archaeological remains of
eighteenth and nineteenth century plantations.

Historic resources (e.g., buildings and structures) account for the second most abundant resource type in
SC_04 (n=5,250), and they are found in all areas throughout the Planning Reach. The highest
concentrations of historic resources are found in Charleston County (n=2769) and Beaufort County
(n=1,158). These resources date primarily from the nineteenth to the mid-twentieth century.

There are 166 resources classified as historic areas in the Planning Reach. These resources are historic
districts, boundary expansions, or multiple resource areas that are eligible for, but not listed on the NRHP,
contribute to an existing historic district, have been determined not eligible for the NRHP or require
additional evaluation. Concentrations of these resources are found in Charleston County (n=82) and
Colleton County (n=31). Resources in Charleston County are located in Charleston on the peninsula and

                                                     7
the barrier islands. Historic areas in Colleton County are located in the ACE Basin National Wildlife Refuge,
along the Combahee River and in the vicinity of the Green Pond community. These resources are often
associated with former rice plantations.
Civil War earthen works (n=209) are a unique resource type found only in Planning Reach SC_04. These
resources consist of batteries, forts, revetments, and earthen fortifications constructed during the Civil
War. The majority of these resources are located in the vicinity of James Island, south of the city of
Charleston. These resources were placed near sounds, rivers, and creeks, which are prone to erosion from
storm events and are highly vulnerable to storm surges, to protect against enemy invasion.
The following cultural resources are highlighted as they illustrate the range of properties that are exposed
to storm surge inundation, erosion, and wave attack in Planning Reach SC_04. This is not an all-inclusive
list. Cultural resources within the areas were selected through both quantitative means, such as
determining which cultural resources were located in areas of greater exposure, and qualitative means,
such as stakeholder input. A selection of historic properties and districts are highlighted due to their
National Register status and stakeholder input regarding their historical significance and concern for
continued preservation due to their higher exposure rating. General information is also included regarding
the presence of archaeological sites in areas of higher exposure.
Charleston (NRHP Ref. No.’s 66000964, 78002497, and 70000923)
Charleston was settled in 1670 and became one of the wealthiest cities in Colonial America due to rice,
cotton, and other exports. The City of Charleston contains a large National Historic Landmark District (the
area contains records for at least 1,000 structures that are 50 years or older), Charleston Historic District,
as well as 44 individual National Historic Landmarks. These resources range from historic buildings and
structures from the early 1700s, fortifications such as Fort Sumter and Fort Moultrie that played key roles
in the Civil War, and nineteenth and twentieth century single family dwellings. The area contains at least
1,000 recorded archaeological sites, the maximum number of records that can be returned in the ArchSite
database search. Many sites are located on Kiawah, Folly, and Seabrook Islands, and along the Wando and
Cooper Rivers (South Carolina Department of Archives and History, 2021b). With climate change these
historic districts and resources will see an increase in sea level rise, dramatically extending the storm surge
driven by hurricanes into their neighborhoods, increasing their chances of inundation. Daily tides only
influence the immediate areas near the shoreline and will increase sunny day flooding in town and may
inundate the historic districts. A rise of sea levels as low as a few feet, which is well within current
projections, could permanently inundate portions of the city’s historic districts. Meanwhile, storm surges
and flooding could undermine the foundations of many historic buildings.
Fig Island Archaeological Site (NRHP Ref. No. 70000585)
At least 20 prehistoric shell rings are located along the central coast of South Carolina and Georgia, two
of which are located on Fig Island. The Fig Island Shell Rings are believed to date around 1000 to 2000 BC.
These resources contain some of the earliest pottery found in North America. While the function remains
unknown as to the reason for the ring shape, the rings appear to be carefully planned. The rings are
thought to be one of the earliest examples of sedentary life by inhabitants who survived through foraging
the local environment for resources (South Carolina Department of Archives and History, 2021c). The Fig
Island Site (Number 2) is comprised of three prehistoric shell middens situated in a marsh. The other shell
midden site on Fig Island (Number 3) is severely eroded and the entire resource is vulnerable to tidal
erosion in the future as sea level continues to rise and is currently subject to storm surge and related
episodic erosion.
8Willtown Bluff (NRHP Ref. No. 74001830)
This resource, which was founded in 1704, was also known as Wilton and New London. It served as a
historic settlement located on the South Edisto River in close proximity to Adams Run. After Charleston
was relocated in 1682, attention turned to Willtown Bluff and it became the second planned town to be
established in this area. The town served as a local governmental and regional commercial center. The
historic property includes three early-nineteenth century buildings. The Parsonage dates to circa 1836,
the Willtown Plantation House dates to circa 1820, and the remains of the Episcopal church that dates to
circa 1836. The resource also includes the vast archaeological complex of the unexposed remains of a
colonial village, which is believed to have been comprised of 80 houses (NPS, 1974). Changes in shoreline
topography due to erosion or migration would likely not affect these cultural resources as most are
located in the interior of the island. However, storm surge from hurricanes and associated winds would
inundate the resources while flooding could undermine the foundations of historic buildings.
Santa Elena; San Felipe; San Marcos; Ribaut Monument (NRHP Ref. No. 74001822)
Deemed to be one of the most important historical sites in South Carolina, the site is comprised of three
fort sites and two town sites. Two of the forts are Spanish, dating to 1566 and 1577, and one is French,
dating to 1562. One of the town sites was in existence for approximately a decade and was considerable
in size for that time period and area. It represents the first European occupation in the area, as well as the
only French and Spanish occupations in South Carolina. The Spanish fort built in 1566 was named San
Felipe and was occupied until 1576 when a North American uprising forced the Spanish out. The Spanish
relocated in 1577 to a nearby fort near the location of the original San Felipe location (South Carolina
Department of Archives and History, 2021d). The resource is also designated a National Historic Landmark
and has experienced varying levels of damage from recent hurricanes. Storm surge from hurricanes and
associated winds would inundate these resources while flooding could undermine the foundations of
historic buildings.
Grove Plantation (NRHP Ref. No. 78002495)
Grove Plantation is a late Federal style building that was built by George Washington Morris circa 1828.
After Morris’ death circa 1857, the plantation transferred ownership after the death of Morris to John
Berkeley Grimball. Grimball was a planter and member of the South Carolina Senate. Grove Plantation
serves as an example of a low country house built during the end of the Federal Period (1790 – 1830). The
main house, which is a raised cottage configuration, has a distinctive design that features polygonal rooms
with symmetrical polygonal bays that project out (South Carolina Department of Archives and History,
2021e). Several outbuildings are situated to the east. Storm surge could undermine the foundations of
many of the island’s historic buildings.
Daufuskie, St. Helena and Hilton Head (NRHP Ref. No. 82003831)
These communities and cultural resources are associated with descendants of Africans who were enslaved
on the rice, indigo and cotton plantations, many of whom came from West Africa. Their locations on
remote or isolated plantations created a unique culture that is represented in language, arts, crafts, music,
and foodways. Daufuskie Island Historic District encompasses the entire island and consists of 18
individual structures, 52 contributing buildings or structures, and 167 contributing properties, mainly
wooded tracts (South Carolina Department of Archives and History, 2021f). The resources collectively
illustrate a 300-year long history of the island (1700-1930) that has evolved in relative isolation. The Penn
Center Historic District, located on St. Helena Island, was founded in 1862 as a school for freed slaves. For
over a century, the school promoted education, welfare, and heritage of the local black community (South
Carolina Department of Archives and History, 2021g). The school served various functions aside from
9educational purposes. It also serves as a health clinic, farm bureau, and preservation institution for the
island’s Gullah Geechee heritage. A group of northern missionaries and abolitionists founded the school.
They arrived on the island after the Union took over during the Civil War. The school closed in 1948, but
a spirit of community service and historical preservation has continued in this community. Fort Howell,
located on Hilton Head, is a Civil War earthwork fortification (South Carolina Department of Archives and
History, 2021f). Built in 1864, it is integral to the military history of that area. It played an important role
in the Federal occupation and defense of Hilton Head Island. The fort is associated with the United States
Colored Troops, who aided with the fort’s construction, and demonstrates the role they played in the
occupation and defense of the island. The fort also has a connection to Mitchelville (established 1862-
1863), which was a freedmen’s village for which the fort was built to defend. Another important note is
that the fort is a rare example of a semi-permanent field fortification that was relatively large and still
mostly intact. Structures and earthworks associated with these resources may be invulnerable to tidal
waters today, but they will be vulnerable to tidal erosion in the future as sea level continues to rise, plus
many are currently subject to storm surge and related episodic erosion.
2.3 Georgia (Planning Reach GA_05)
Exposed cultural resources were broadly defined as being within the 1 percent and 10 percent AEP flood
zone, due to the potential impacts of repeated and frequent inundation. GIS analysis using several
datasets discussed in this section was performed to determine which cultural resources were exposed to
storm surge, erosion, and wave attack. Exposed cultural resource areas identified are not meant to be all-
inclusive. Publicly available data for historic resources are discussed below and in the Georgia appendix.
Specific archaeological site data are not publicly reportable but were analyzed quantitatively to determine
the volume of sites exposed to coastal storm hazards.
By using information and datasets from the NPS, USGS, and Georgia’s Natural, Archaeological and Historic
Resources GIS (GNAHRGIS), exposure of significant cultural resources to coastal storm hazards was
evaluated. Data gathered from these databases are current as of June 2021, and any cultural resources
added after that point will not be represented in this analysis throughout the report.
• NRHP: The data were developed by the NPS to protect historic and archaeological resources (NPS,
2020a). The NRHP has a comprehensive inventory of cultural resources that are deemed worthy
of preservation. The data is available in GNAHRGIS and can provide spatial data of where historic
points and historic places (polygons) occur relative to different types of hazards.
• GNIS Historical Features: The data were developed by USGS to maintain uniform feature name
usage throughout the government. The GNIS contains information about historical features and
cultural resources (USGS, 2021). The data are available in Georgia’s Natural, Archaeological and
Historic Resources Geographic Information System (detailed below) and provide spatial data of
where physical, cultural, political, and historical points occur relative to different types of
shorelines and hazards.
• GNAHRGIS: Additional cultural resources data from GNAHRGIS was used to refine exposure for
cultural resources in Tier 2. GNAHRGIS is comprised of two databases (Georgia Archaeological Site
File at the University of Georgia and the Georgia Department of Natural Resources, n.d.).
• Georgia Archaeological Site File Data
• Georgia Historic Preservation Division Historic Resources Survey Data
GNAHRGIS combines data from the state’s archaeological and built environment (i.e., historic
10resources) to provide researchers with an online source for cultural resources information. This
dataset identifies known historic resources (buildings, structures, sites, landscape features and
districts) that are eligible for listing, but not listed on the National Register; resources that require
additional evaluation for NRHP eligibility; and resources that are not eligible for listing on the
National Register that would be exposed due to hazards. Archaeological sites that would be
exposed due to hazards are also identified using this dataset.
The 1 percent and 10 percent AEP hazard plus 3 feet of sea level rise layer (the SACS combined hazard
layer is located in the SACS geoportal at https://www.sad.usace.army.mil/SACS/) was used to
demonstrate exposure to cultural resources from coastal storm inundation and sea level rise in the future
condition (Table 1 and Table 2). Cultural resources located within these hazard areas are categorized as
being at a higher exposure than resources located outside of these defined boundaries.
Table 1. Archaeological Sites in Georgia Exposed to the 1 Percent and 10 Percent Annual Exceedance
Probability Flood Hazard
Archaeological Sites
(Confidential Locational Data)
Existing Risk Future Risk (+3’ SLR)
Number of Sites Number of Sites
1% AEC 10% AEC 1% & 10% TOTALS 1% AEC 10% AEC 1% & 10% TOTALS
County
(0.01) (0.1) (per county) (0.01) (0.1) (per county)
Bryan 88 114 202 114 153 267
Camden 157 76 233 61 208 269
Chatham 340 573 913 187 761 948
Glynn 210 90 300 165 143 308
Liberty 86 131 217 84 152 236
McIntosh 98 122 220 51 191 242
TOTALS 979 1,106 2,085 683 1,608 2,291
Table 2. Historic Resources Sites in Georgia Exposed to the 1 Percent and 10 Percent Annual Exceedances
Probability Flood Hazard
Historic Resources Sites
(Publicly Available Data)
Existing Risk Future Risk (+3’ SLR)
Number of Sites Number of Sites
1% AEC 10% AEC 1% & 10% TOTALS 1% AEC 10% AEC 1% & 10% TOTALS
County
(0.01) (0.1) (per county) (0.01) (0.1) (per county)
Bryan 32 4 16 20 16 36
Camden 92 22 114 23 119 142
Chatham 461 157 618 281 353 634
Glynn 2,523 285 2,808 2,292 591 2,883
Liberty 12 0 12 12 6 18
McIntosh 8 13 21 7 14 21
TOTALS 3,128 481 3,609 2,635 1,099 3,734
In the current conditions, 2,085 archaeological sites were identified within the 1 percent and 10 percent
AEP flood zones (Table 1). With the addition of 3 feet sea level rise, an additional 206 archaeological sites
are potentially exposed within the future condition for a total of 2,291 archaeological sites. In the current
11conditions, 3,609 historic resources were identified within the 1 percent and 10 percent AEP flood zones
(Table 2). With the addition of 3 feet of sea level rise, an additional 125 resources are potentially exposed
within the future conditions to the 1 percent and 10 percent AEP flood hazard for a total of 3,734 historic
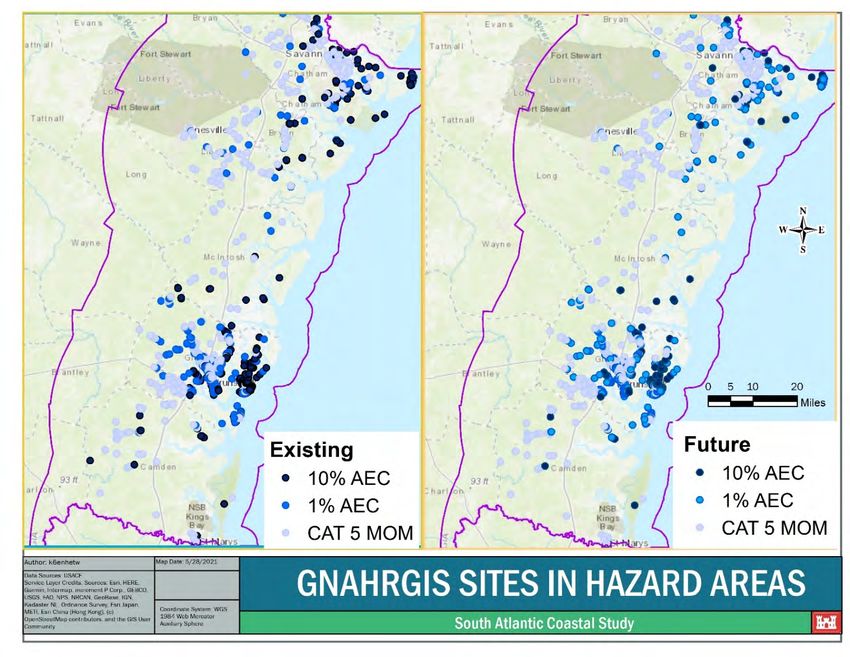
resources. Figure 2 shows that the future condition leads to a higher exposure of historic resource
compared to the existing conditions, and it contains locational information for publicly available data (i.e.,
no archaeological site locational information).
Figure 2. Historic Resources Recorded in the GNAHRGIS that are located in the Existing and Future
Conditions 1 Percent and 10 Percent Flood Scenarios (with 3 feet of sea level rise)
Exposure of archaeological and other historic resources to coastal storm hazards for all coastal counties
are discussed in greater detail below, as these counties are deemed to have higher exposure due to their
proximity to the coast and coastal storm surge. Specific cultural resource areas are categorized by county
in Table 3. Cultural resources within the areas were selected through both quantitative means, such as
determining which cultural resources were located in areas of greater exposure, and qualitative means,
such as stakeholder input. The table below is not all-inclusive and is meant to communicate the types of
cultural resources that may be found in these areas. A selection of historic properties and districts are
highlighted due to their National Register status and stakeholder input regarding their historical
significance and concern for continued preservation due to their higher exposure rating. General
information is also included regarding the presence of archaeological sites in areas of higher exposure.
12Table 3. Exposed Cultural Resources Areas in Georgia by County
County Location Exposed Cultural Resource Area
Bryan Richmond Hill Fort McAllister
Cumberland Island, Dungeness Historic District, Little Cumberland
Camden Cumberland Island Island, Duck House, and prehistoric and historic archaeological sites
subject to erosion (Crooked River State Park)
Moon River District Pin Point Gullah Geechee Community
Fort Pulaski National Monument, Cockspur Island Lighthouse, and
Cockspur Island
prehistoric and historic archaeological sites subject to erosion
Back River Historic District, Tybee Island Strand Cottages Historic
Tybee Island District, Fort Screven Historic District, and prehistoric and historic
Chatham archaeological sites subject to erosion. Includes Little Tybee.
Ossabaw Island Prehistoric and historic archaeological sites subject to erosion
Savannah Savannah Historic District (River Street)
Wormsloe Plantation, Isle of Hope Historic District, Gullah‐Geechee
Isle of Hope sites, and prehistoric and historic archaeological sites subject to
erosion
Fort Frederica National Monument, St. Simons Lighthouse and
Lighthouse Keepers' Building, U.S. Coast Guard Station at St. Simons
St. Simons
Island, Hamilton Plantation slave cabins, and prehistoric and historic
archaeological sites subject to erosion
Glynn Brunswick Brunswick Old Town Historic District, Hofwyl‐Broadfield Plantation
Jekyll Island Historic District and National Historic Landmark, Jekyll
Island Club, Indian Mound Cottage (Rockefeller Cottage), Faith
Jekyll Island
Chapel, and prehistoric and historic archaeological sites subject to
erosion
Midway Fort Morris
Liberty National Historic Landmark and prehistoric archaeological sites and
St. Catherines Island
historic sites subject to erosion
Darien Ashantilly, Fort King George
Sapelo Island Lighthouse, Hog Hammock, and prehistoric and historic
McIntosh Sapelo Island
archaeological sites subject to erosion
Blackbeard Island Prehistoric and historic archaeological sites subject to erosion
Bryan County
A query of GNAHRGIS revealed that 1,591 archaeological sites and 210 historic resources are located in
Bryan County, with high concentrations of the resources located northwest of Fort Stewart and along the
Canoochee River. Of these resources, 238 are located in the existing condition 1 percent and 10 percent
flood scenarios and 303 are located within the future condition of 3 feet sea level rise, therefore at higher
exposure. Of the 303 resources, 267 are archaeological sites and 32 are historic resources. One historic
resource of note is Fort McAllister, which is a restored Civil War earthworks fort situated on the Ogeechee
River (NPS 1970). Built in 1861, the fort has undergone several restoration projects and is now a Georgia
State Park.
Camden County
A query of GNAHRGIS revealed that 576 archaeological sites and 343 historic resources are located in
Camden County, with high concentrations of the resources located on Cumberland Island. Of these
resources, 347 are located in the existing condition 1 percent and 10 percent flood scenarios and 411 are
13located within the future condition of 3 feet sea level rise, therefore at higher exposure. Of the 411
resources, 269 are archaeological sites and 142 are historic resources. Cumberland Island is a barrier island
that is also a designated national seashore and managed by the NPS. One of the highest concentrations
of historic buildings is a historic district on the northern end, which includes 21 buildings. This resource is
owned and managed by the NPS. Another historic district is located the southern end of the island that
contains 10 buildings and structures. Prehistoric and historic archaeological resources include the Duck
House, which was a historic dwelling site, and the Crooked River Site, which is a prehistoric shell midden
site that is bordered by a salt marsh, Crooked River, and a shallow tidal creek (NPS, 2020b). Little
Cumberland Island, a barrier island to the north of Cumberland Island, is where the Little Cumberland
Island Lighthouse is located. Both Cumberland and Little Cumberland Islands contain archaeological sites
subject to erosion, as documented by the Georgia Department of Natural Resources Historic Preservation
Division.
Chatham County
A query of GNAHRGIS revealed that 1,512 archaeological and 6,220 historic resources are located in
Chatham County, with high concentrations of the resources located in downtown Savannah, the outskirts
of Savannah on Isle of Hope and on Tybee Island. Of these resources, 1,531 are located in the existing
condition 1 percent and 10 percent flood scenarios and 1,582 are located within the future condition of 3
feet sea level rise, therefore at higher exposure. Of the 1,582 resources, 948 are archaeological sites and
634 are historic resources. The highest concentrations of historic structures in Savannah are related to
the initial settlement (late 1700s) and nineteenth century construction periods. The city of Savannah
contains a large National Historic Landmark district with numerous architecturally significant resources
that abut the Savannah River. These resources were built on some of the highest elevations in the city and
are not inundated during major storm events. Tybee Island contains over 900 buildings and structures
that are 50 years old or older (NPS, 2020c). These resources are located behind the existing dunes and
flood protections that are in place and are protected from inundation except during major storm events
and storm surges. The Bonaventure Cemetery is listed on the NRHP and is located between the
Wilmington River and Placentia Canal (NPS, 2000b).
Tybee, Cockspur, Ossabaw, and Isle of Hope, contain several significant cultural and historic resources
that are threatened by storm surge inundation, wave attack, and erosion. Tybee Island contains over 900
structures that are 50 years old or older, including the Back River Historic District, Tybee Island Strand
Cottages Historic District (NPS, 2020c), and Ft. Screven Historic District, which could all serve as the focus
of additional studies to protect these important sites from current erosional threats and future sea level
rise (City of Tybee, n.d.). Cockspur Island is in the eastern portion of the county north of Tybee Island. This
island, which has experienced several episodes of significant storm damage, is home to the Ft. Pulaski
National Monument (NPS, 2003). The fort is subject to erosion and inundation, and the lighthouse has
been destroyed several times due to storm surges. Ossabaw Island is a barrier island located in the
southern portion of the county. The island is a historic district that covers approximately 39 square miles.
Ossabaw Island contains multiple archaeological sites subject to erosion, as documented by the GADNR
HPD (NPS, 1996c) Isle of Hope is home to the Wormsloe Plantation, the Isle of Hope Historic District, and
numerous sites that are important to the Gullah Geechee community (NPS, 2005). The island is
surrounded by a tidal salt marsh on all sides and transitions from a peninsula to island at high tide.
Flooding and erosion are the main hazards associated with sea level rise in that area. Additional areas
identified through stakeholder input include the Savannah Historic District at River Street (NPS, 1977) and
the historic Gullah Geechee community of Pin Point located adjacent to Shipyard Creek, both of which
were impacted from storm surge during previous named storm events. Many of these resources in the
Chatham County area are located behind the existing dunes and flood protections that are in place and
are protected from inundation except during major storm events and storm surges.
14You can also read