ATM 10 Severe and Unusual Weather - Disc-1 Prof. Richard Grotjahn - UC Davis Canvas
←
→
Page content transcription
If your browser does not render page correctly, please read the page content below

ATM 10 Severe and Unusual Weather
Prof. Richard Grotjahn   Disc-1

ATM 10 Severe and Unusual Weather
                  Fall 2018, MW 12:10-1:00, Giedt 1002
G.E. CREDIT: Science and Engineering; visual, scientific, writing literacies
WEBSITE: http://canvas.ucdavis.edu

INSTRUCTOR: Prof. Richard Grotjahn, 231 Hoagland Hall
      Phone: 752-2246; e-mail: grotjahn@ucdavis.edu
      Atmospheric Science Program,
              Dept. of Land, Air and Water Resources

TAs:               Dani Caputi                   Minmeng Tang
               djcaputi@ucdavis.edu           mmtang@ucdavis.edu
Office Hours: (W: 10:30-11:30a)              (Tu: 11:00a-12:00p)
Location for office hours: 151 Hoagland Hall

DISCUSSION SECTIONS: 12:10-1:00p Thursday 124 Hoagland
                      1:10-2:00p Thursday 124 Hoagland
                     12:10-1:00 Friday    124 Hoagland

TEXT: NONE.
Some may want to look at Fry et al. 2010. Some pages are referenced
from it in the course outline. It is OPTIONAL.
ATM 10 Website                      Shown is 2018 test version; similar to actual
• http://canvas.ucdavis.edu/
• Course postings of lectures,
  problem sets, videos and
  animations are all folders in the
  ‘Files’ link.

                                            Homework assignments here
                                             Admin has course syllabus and this
                                             presentation. Note expanded folder.

                                                  Lecture notes here
                                                 TA discussion notes here
Course
Syllabus –
Logistics &
 Grading
• Monitor the
  ‘syllabus’ in the
  Files, Course
  Administration
  folder at the
  course website:
  http://canvas.u
  cdavis.edu/

Course
 Syllabus -
 Calendar

• Monitor the
  ‘syllabus’ in the
  Files, Course
  Administration
  folder at the
  course website:
  http://canvas.u
  cdavis.edu/

Optional book; Reading Notes
• What does ‘optional book’ mean?
   – You don’t need to buy it.
   – You won’t be tested on it, per se.
     (Obviously, if a diagram from the book is
     shown in lecture you might be asked
     about that. Test questions are based on
     lecture notes and homework materials.)
• Why mention it?
   – The Professor wrote the ‘Extremes’
     chapter and will be using some figures
     and diagrams from that chapter.
   – Some bits and pieces of other chapters      Title: Encyclopedia of Weather and
                                                 Climate Change: A complete visual guide.
     relate to some parts of the lectures        Authors: Fry, Graf, Grotjahn,
   – The syllabus lists the pages, but you           Raphael, Saunders, Whitaker.
     don’t have to read the book to do well.     ISBN 978-0-520-26101-3

• Is there reading? Yes.                         Publisher: UC Press
                                                 512 pp.
   – The lecture notes are the reading!
Course Rules & Suggestions
Some rules:
1.  Homework is due by end of lecture on date indicated in syllabus.
    Homework turned in after that time receives 0% credit.
2.  Homework is submitted on paper to your TA.
     1.    Do not submit homework as email unless arranged prior with your TA.
     2.    If there are multiple pages, please staple all pages together.
     3.    Print out your answers using a word processor:
          1.   For any written part of an assignment
          2.   Exceptions:
               1.   Mathematical calculations can be legibly hand-written
               2.   Diagrams & charts can be hand-drawn (if clear)
3.    Do your own homework.
     1.    Duplicative homework answers may cause both people to get 0% credit
4.    No early or late offerings of midterm
5.    Exams are closed book, but you be given equations.
Some suggestions:
1.    For more information & updates: routinely check the course website
2.    Plan your timing of activities using the syllabus
3.    Review the posted lectures after if not before lecture
4.    Questions? Ask your TA or the instructor.
5.    Check your campus email…our way to alert you to stuff.
Note: To reduce paper usage, homework assignments will not be handed out
(but posted on the course smartsite in the ‘Resources’ heading)
Mini Feedback Forms
Course Overview
• What to expect in lecture:
  –   powerpoint lecture
  –   video(s)
  –   demonstration(s)
  –   weekly mini feedback form
  –   weekly turn in of homework

• What to expect in discussion:
  – Work through example problem similar to current
    homework
  – Return of graded assignments, midterm
  – Revisit any topic that people missed as noted by the TA
    when doing grading
  – Revisit topics from lecture identified by students on the
    mini feedback form.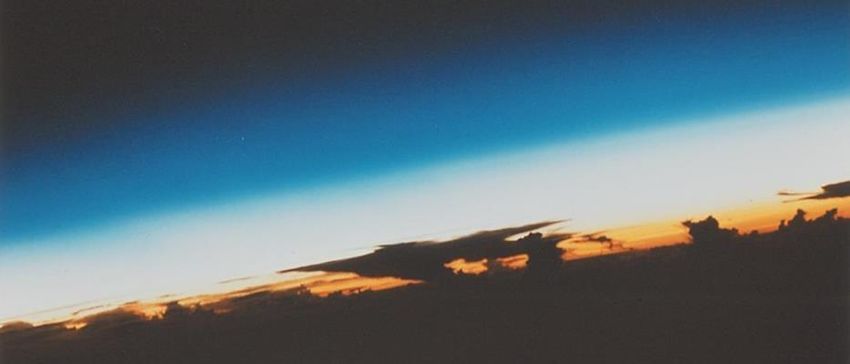
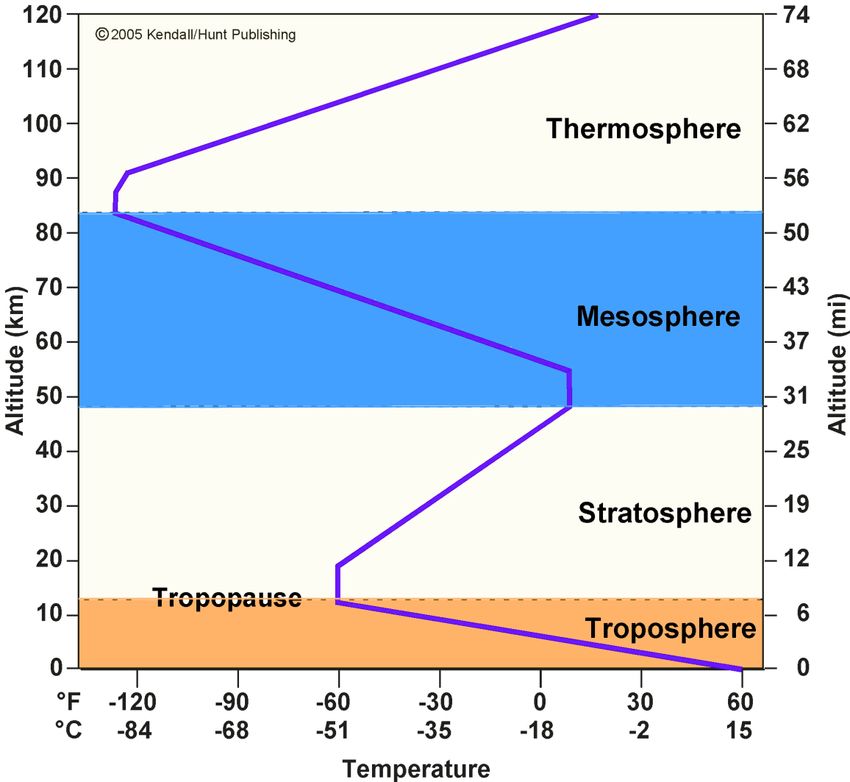
Vertical Structure: Atmospheric Layers
     ionosphere

                         Mesopause

                                     •   5 layers based on air properties

                  Stratopause        •   1 is electrically charged
                                         ionosphere

                                     •   4 defined by how air temperature
                                         changes with pressure and
                                         latitude.
                                     •   Between layers are key levels.

                                     •   Weather & wind differ between
Note the                                 layers.
“orange”                             •   Most “weather” occurs in the
Layer.                                   troposphere.
Vertical Structure of Pressure & Density
Gravity pulls gases
toward earth's
surface.
Pressure is weight of
air above. Weight =
mass of air times
acceleration of
gravity.
Whole column of air
at sea level weighs:
The
= 14.7 psi
“orange’
Layer = 1013.25 mb
In space = 29.92 in.Hg.
photo Figure 1.8Why is the line curved?
Red line is curved since:
1. Air below is compressed from the weight of air above.
2. Why? Compression makes:
1. density increase as elevation becomes lower.
2. So, amount of mass in a layer below is > mass in layer the same
depth above.
3. So, pressure difference from top to bottom of a layer increases as
go lower. That is description in words, now consider a picture...Why is the red line curved?
Same layer depths (no comp.) Compressed air
ρ= 1, P=1 ρ= 1 , P= 1
ρ= 1, P=2 ρ= 1.2 , P= 2.2
ρ= 1, P=3 ρ= 1.44 , P= 3.64
ρ= 1, P=4 ρ= 1.73 , P= 5.37
Consider two examples. ρ= 1, P=5 ρ= 2.07 , P= 7.44
Left example: Contents NOT
compressed by layers above; so ρ= 1, P=6 ρ= 2.49 , P= 9.93
density ρ same in each layer. NO compression Let compression
Change of P from top to bottom of so density same in increase density by
each layer is same for each layer. each layer. P change 20% from layer
Pressure at bottom of each layer is is a straight line. above. P change is a
P and P is plotted as pink line. curved line.
Right example: Air layers above
COMPRESS air below; so weight
of air above makes ρ increase for
layers below. More density means
more mass so P change across
layer increases too. P at bottom of
each layer plotted as blue line.Why is the red line curved?
Same layer depths (no comp.) Compressed air
ρ= 1, P=1 ρ= 1 , P= 1
ρ= 1, P=2 ρ= 1.2 , P= 2.2
ρ= 1, P=3 ρ= 1.44 , P= 3.64
ρ= 1, P=4 ρ= 1.73 , P= 5.37
ρ= 1, P=5 ρ= 2.07 , P= 7.44
Left example: Contents NOT
compressed by layers above; so ρ= 1, P=6 ρ= 2.49 , P= 9.93
density ρ same in each layer. NO compression Let compression
Change of P from top to bottom of so density same in increase density by
each layer is same for each layer. each layer. P change 20% from layer
Pressure at bottom of each layer is is a straight line. above. P change is a
P and P is plotted as pink line. curved line.
Right example: Air layers above
COMPRESS air below; so weight
of air above makes ρ increase for
layers below. More density means
more mass so P change across
layer increases too. P at bottom of
each layer plotted as blue line.Why is the red line curved?
Same layer depths (no comp.) Compressed air
ρ= 1, P=1 ρ= 1 , P= 1
ρ= 1, P=2 ρ= 1.2 , P= 2.2
ρ= 1, P=3 ρ= 1.44 , P= 3.64
ρ= 1, P=4 ρ= 1.73 , P= 5.37
Consider two examples. ρ= 1, P=5 ρ= 2.07 , P= 7.44
Left example: Contents NOT
compressed by layers above; so ρ= 1, P=6 ρ= 2.49 , P= 9.93
density ρ same in each layer. NO compression Let compression
Change of P from top to bottom of so density same in increase density by
each layer is same for each layer. each layer. P change 20% from layer
Pressure at bottom of each layer is is a straight line. above. P change is a
P and P is plotted as pink line. curved line.
Right example: Air layers above
COMPRESS air below; so weight
of air above makes ρ increase for
layers below. More density means
more mass so P change across
layer increases too. P at bottom of
each layer plotted as blue line.Clouds • Condensed water vapor: either ice crystals or liquid droplets • Droplets much smaller than raindrops. • Droplets form on a bit of dust, sea salt, etc That bit called a condensation nuclei. • Most clouds form as air rises. • Rising air encounters lower P and T • This leads to our demonstration…
Demo: Clouds in bottles
• Various ways to make
  cloud in a bottle:
   – Plastic soda bottle with
     water and condensation
     nuclei inside, compress
     (P rises) then let go (P
     drops)
   – Pump air from (big)
     bottle until cloud forms.
• Recall: need
  condensation nuclei.
  Try a bit of smoke from
  match.
• Real clouds have
  similar transparency.
Severe Weather Stories???
Pre-course Knowledge Assessment
• Answer all questions in order to receive full
  credit.
• Unlike all other homework and exams, if you
  don’t know an answer, just write ‘I don’t know’
  or ‘IDK’ to receive full credit on THIS quiz.
• Your score will count as extra credit.
You can also read