AUGMENTED VIRTUAL REALITY
←
→
Page content transcription
If your browser does not render page correctly, please read the page content below
AUGMENTED
      AND
VIRTUAL REALITY
       IN
  E-COMMERCE

                                                              (Smith, 2016)

          Master thesis in Communication Science
               by Alevtina Befort (2419726)

 Specialization in Digital Marketing Communication & Design

                        Supervisors:
                       Dr. H. Scholten
                   Dr. T.J.L. van Rompay

        Master Program of Communication Science
  Faculty of Behavioural Management and Social Science

                    University of Twente
                  19. July 2021, Enschede
                    Word count: 11,561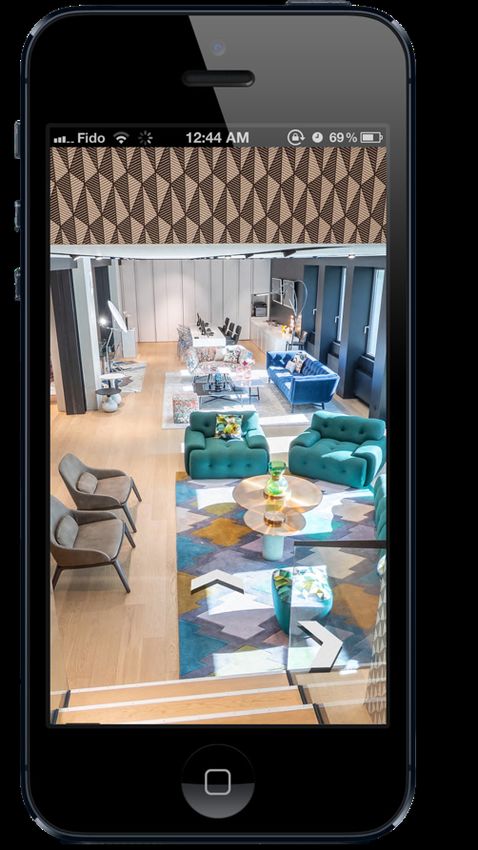
Abstract
Over the past decades, e-commerce has changed the retail landscape and seriously influenced lives. Under the current uncertain
economic circumstances caused by Covid-19, its growth and penetration into everyday life will increase. Although e-commerce
is constantly evolving, it cannot deliver a shopping experience equivalent to brick-and-mortar. The integration of 3D product
visualizations via augmented reality (AR) and virtual reality (VR) can convey a more authentic, interactive and sensory-stim-
ulating e-commerce experience. Through a 3x2 experimental between-respondent design, which was manipulated for the vis-
ualization and product type and controlled for age and gender, this study tested the capability of AR and VR 3D product
visualizations to deliver a more engaging e-commerce experience compared to the widely used 2D product images. Results
show that 2D product images offered the most engaging e-commerce experience. However, when comparing AR and VR,
irrespective of the product the e-commerce experience was better with AR than VR, especially for the older generation. Lastly,
this study examined that neither AR nor VR is better suited for a particular product type. These findings illustrate that sticking
to 2D product images would not harm a company’s e-commerce performance. To outperform the competition, AR is essential
when centered on delivering a ‘one-of-a-kind shopping experience’.

Keywords: e-commerce, 3D product visualization, augmented reality, virtual reality, consumer experience

                     AUGMENTED REALITY & VIRTUAL REALITY IN E-COMMERCE |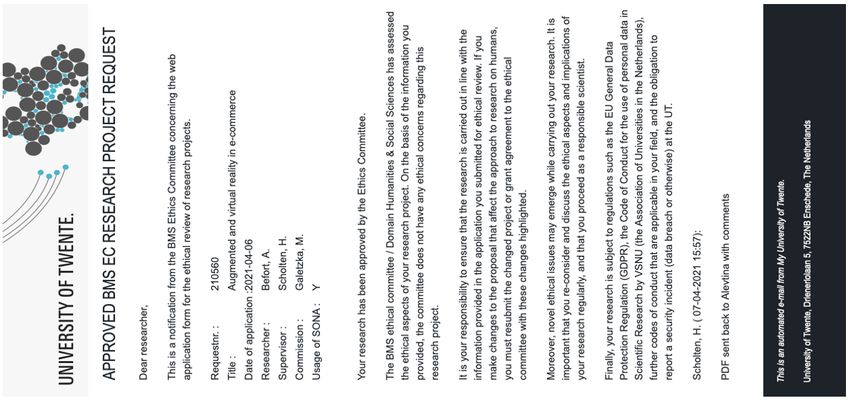
Table of contents
I.        Glossary of Abbreviations

II.       List of Figures & Tables

Chapter 1: Introduction ................................................................................................................................ 1

Chapter 2: Theoretical background.............................................................................................................. 2
      2.1. E-commerce ................................................................................................................................................ 2
      2.2. 3D product visualizations ........................................................................................................................... 3
         2.2.1 Augmented reality ................................................................................................................................ 3
         2.2.2 Virtual reality ....................................................................................................................................... 4
      2.3. Design & hypotheses ................................................................................................................................... 5

Chapter 3: Method........................................................................................................................................ 7
      3.1. Research design .......................................................................................................................................... 7
      3.2. Selection of stimuli ...................................................................................................................................... 7
      3.3. Procedure .................................................................................................................................................... 8
         3.3.1. Pre-test – survey .................................................................................................................................. 9
      3.4. Participants ................................................................................................................................................. 9
         3.4.1. Data collection procedure .................................................................................................................... 9
         3.4.2. Sample ............................................................................................................................................... 10
      3.5. Measures ................................................................................................................................................... 11
         3.5.1. Discriminant validity of measures ..................................................................................................... 11
         3.5.2. Reliability .......................................................................................................................................... 11
         3.5.3. Interactivity ....................................................................................................................................... 12
         3.5.4. Authenticity ....................................................................................................................................... 12
         3.5.5. Involvement with displayed product ................................................................................................. 12
         3.5.6. Involvement with visualization type.................................................................................................. 13
         3.5.7. Utilitarian benefits ............................................................................................................................. 13
         3.5.8. Multi-sensory stimulation.................................................................................................................. 13
         3.5.9. Vividness of stimuli environment...................................................................................................... 13
      3.6. Data analysis strategy ............................................................................................................................... 13

Chapter 4: Results ...................................................................................................................................... 14
      4.1. Manipulation check ................................................................................................................................... 14
      4.2. Descriptive statistics ................................................................................................................................. 14
      4.3. MANOVA .................................................................................................................................................. 15
         4.3.1. Main effect of visualization type ....................................................................................................... 17
         4.3.2. Main effect of product type ............................................................................................................... 17
         4.3.3. Interaction effect of visualization & product type ............................................................................. 18
      4.4. Age & gender ............................................................................................................................................ 18

Chapter 5: Discussion ................................................................................................................................. 19
      5.1. Influence of visualization type ................................................................................................................... 19
      5.2. Influence of visualization & product type ................................................................................................. 20
      5.3. Limitations & future research ................................................................................................................... 20
      5.4. Managerial & theoretical implications ..................................................................................................... 21

                                                  AUGMENTED & VIRTUAL REALITY IN E-COMMERCE |                                                                           2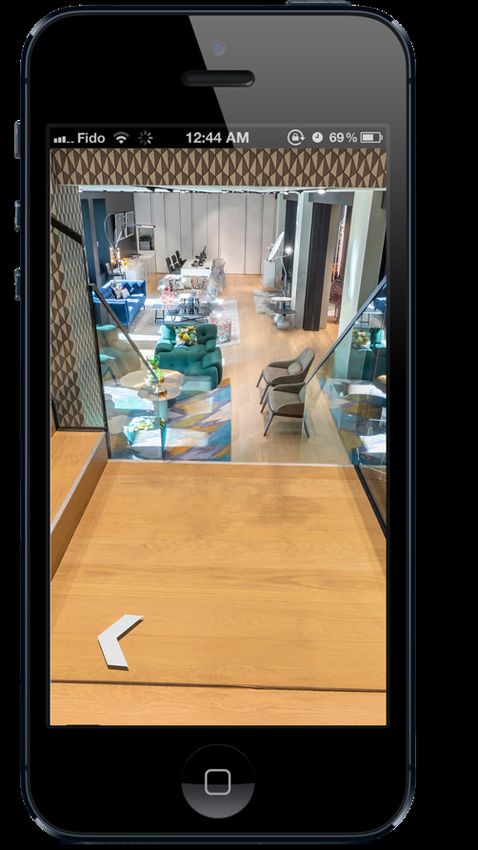
Chapter 6: Conclusion ................................................................................................................................ 22

Reference list ............................................................................................................................................... 23

Appendices .................................................................................................................................................. 27
    Appendix I – Overview Stimuli GIFs................................................................................................................ 27
      Online store offer 1: Furniture Retailer – 2D online store ........................................................................... 27
      Online store offer 2: Furniture Retailer – VR online store .......................................................................... 28
      Online store offer 3: Furniture Retailer – AR online store .......................................................................... 30
      Online store offer 4: Shoe Retailer – 2D online store.................................................................................. 32
      Online store offer 5: Shoe Retailer – VR online store ................................................................................. 33
      Online store offer 6: Shoe Retailer – AR online store ................................................................................. 34
    Appendix II – Pre-test - Experiment ................................................................................................................. 35
    Appendix III – Experiment ............................................................................................................................... 50
    Appendix IV – Request for ethical review of research project ......................................................................... 66
    Appendix V – Research project approval by BMS Ethics Committee .............................................................. 72
    Appendix VI – Initial coding scheme................................................................................................................ 73
    Appendix VII – Factor analysis – rotated component matrix .......................................................................... 75
    Appendix VIII – Adjusted coding scheme ......................................................................................................... 76
    Appendix IX – Descriptive statistics of dependent variable constructs per age group .................................... 78
    Appendix X – Descriptive statistics of dependent variable constructs per condition & age group.................. 79

                                              AUGMENTED & VIRTUAL REALITY IN E-COMMERCE |                                                                      3
I.         Glossary of Abbreviations
e-commerce      electronic commerce

AR              Augmented reality

VR              Virtual reality

VFR             Virtual fitting rooms

II.        List of Figures & Tables
Figure 1.       Environment-augmentation                                                                   3

Figure 2.       Self-augmentation                                                                          4

Figure 3.       VRF                                                                                        5

Figure 4.       Gucci virtual fashion boutique                                                             5

Figure 5.       Conceptual model controlled for gender and age                                             6

Figure 6.       Instrument design                                                                          7

Figure 7.       Online store offer 2 (furniture/VR)                                                        8

Figure 8.       Revised conceptual model                                                                 12

Figure 9.       Visualization type’s main effect on ‘utilitarian benefits’                               17

Figure 10.      Visualization type’s main effect on ‘vividness of stimuli environment’                   17

Figure 11.      Interaction effect age group & visualization type on ‘involvement with displayed product’ 18

Table 1.        Online store offer overview                                                                8

Table 2.        Distribution of sample characteristics per condition                                     10

Table 3.        Internal consistency of the dependent variable’s constructs                              11

Table 4.        Familiarity check of stimuli                                                             14

Table 5.        Descriptive statistics of stimuli familiarity & likability per condition                 14

Table 6.        Descriptive statistics of dependent variable constructs per condition                    14

Table 7.        Multivariate test for variance (GLM/MANOVA)                                              15

                                  AUGMENTED & VIRTUAL REALITY IN E-COMMERCE |                              4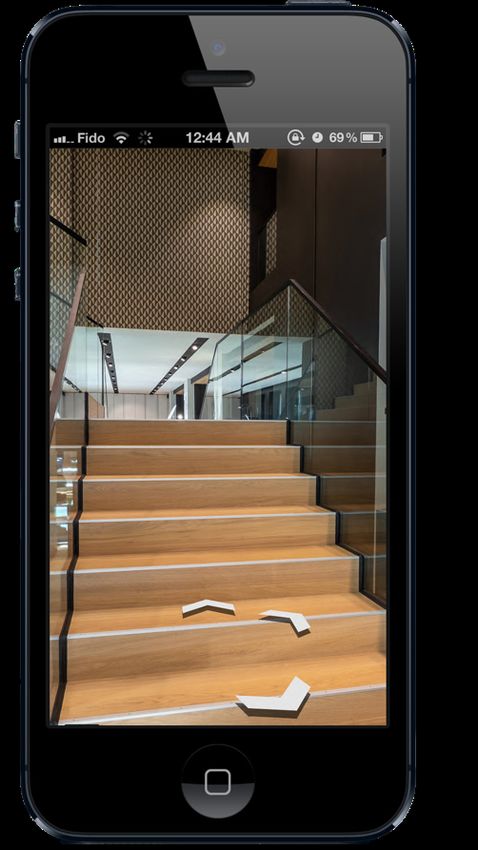
Chapter 1: Introduction
With the enormous development of technology in the past decades, a severe change to the digital world in everyday life became
apparent (Altarteer et al., 2013; Nguyen, 2020). This shift could also be seen in the retail landscape and thus in people's shop-
ping behavior (Nguyen, 2020). Where brick-and-mortar used to be the main point of sale, electronic commerce, abbreviated e-
commerce, is steadily serving more customer needs and providing various service opportunities (Altarteer et al., 2013;
Elboudali et al., 2020). As a result, nowadays, only 21% of all shopping activities are carried out in brick-and-mortar, 36%
through multiple channels, and the remaining 43% exclusively online (Jaller & Pahwa, 2020). Global sales experienced an
impact by the continuing growth of e-commerce, where 2.3 trillion U.S. dollars were allocated to e-commerce in 2017 and are
predicted to double in the next five years (Hwang & Oh, 2020). However, this forecast does not consider the current uncertain
economic situation caused by the Covid-19 pandemic and its associated lockdowns, which led to consumers' dependence on e-
commerce for non-essential purchases (Xue et al., 2020). Hence, transforming online shopping in 2020 from a luxury activity
to a social necessity consequently meant growing expectations on e-commerce (Xue et al., 2020).

Even though e-commerce is now the preferred transaction platform, it is currently impossible to deliver an equivalent or supe-
rior emotional, engaging experience as in traditional brick-and-mortar (Altarteer et al., 2013; Elboudali et al., 2020). This
challenge is mainly because most online retailers rely on 2D product images, providing unilateral sensory stimulation
(Hewawalpita & Perera, 2017; Y. Liu et al., 2020; Paz & Delgado, 2020). But why does only a small percentage of retailers
apply in their e-commerce augmented reality (AR) and virtual reality (VR) 3D visualizations (Paz & Delgado, 2020)? Poten-
tially stimulating almost all five senses through 3D product visualizations could be effective (Fiore et al., 2005; Rauschnabel
et al., 2019; Sung, 2021)? AR comprises the integration of 3D computer-generated objects into the user’s real environment,
with which a real-time interaction can take place (Do et al., 2020; Laato et al., 2021). In the context of e-commerce, this means
a new interactive ‘first-hand experience’ by digitally visualizing selected products, such as glasses or furniture, either on oneself
or in a chosen spot (Ludwig et al., 2020; Sihi, 2018). Estimated at 2.5 billion U.S. dollar in 2017 and expected to grow at an
annual rate of 22.7% by 2026, AR enables a more information-rich and realistic self-explanatory product experience (Dacko,
2017; Y. Liu et al., 2020; Romano et al., 2020). VR, on the contrary, does not create a ‘mixed reality’, but rather isolates the
user from the natural environment and immerses them in a fully synthetic virtual world, in which he/she can interact with 3D
objects and others in real-time by means of a personalized avatar (Cowan & Ketron, 2019; Haile & Kang, 2020; Park & Kim,
2021; Zenner et al., 2020). In e-commerce, VR is predominantly used to simulate a brand’s real brick-and-mortar store in a
digital setting, in which customers can move and act freely (Meißner et al., 2020; Tran et al., 2011b). Industry experts believe
that AR and VR will play a key role in the retail industry due to the high interactivity and personalized experiences (Park &
Kim, 2021). In addition, due to their direct product experience and better visualization of product features, AR and VR are
expected to reduce the main disadvantage of online shopping (Su et al., 2020; Veneruso et al., 2020). Thus minimizing the
discrepancy between the expectation and the actual product, while positively affecting the number of returns, which in the
fashion industry amount to 62 billion U.S. dollars annually (Jang et al., 2019; Y. Liu et al., 2020; Nguyen, 2020; Wodehouse
& Abba, 2016).

Given market oversaturation, it is no longer a question of the price-quality factor, but instead, personal added values provided
by products, particularly the whole experience during the shopping process (Ludwig et al., 2020; Xue et al., 2020). While taking
the influence of the delivered e-commerce shopping experience into account, retailers should see the current situation as an
opportunity to put an end to existing shopping patterns and design a new online shopping era (Xue et al., 2020). As far as it is
known, there has been no research yet conducted concerning the effects on consumers' shopping experience in e-commerce
utilizing 3D product visualizations compared to 2D product images. Therefore, this study would contribute to the research on
retail atmosphere, existing since the 1970s, that focuses on eliciting emotional responses based on a specific purchase environ-
ment (Paz & Delgado, 2020). The research question came about based on the changes mentioned above in shopping behavior,
demands, and circumstances, as well as technological possibilities:

                      “To what extent do augmented reality and virtual reality 3D product visualizations
                       influence consumers e-commerce experience compared to 2D product images?”

                                      AUGMENTED & VIRTUAL REALITY IN E-COMMERCE |                                                  1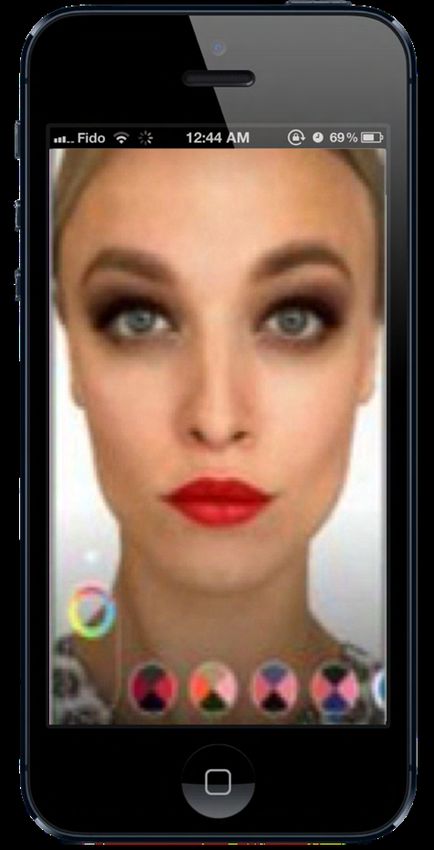
Chapter 2: Theoretical background
To achieve a stronger emotionally engaging experience in e-commerce and thus a higher consumer engagement, 3D product
visualizations via AR and VR received increasing attention from retailers in recent years (Sihi, 2018). However, caution is
required as an inadequate integration of a visualization type may negatively influence consumers’ brand perception and the
brand success in the long run (Y. Liu et al., 2020; Su et al., 2020). Therefore, this chapter focuses on both the theoretical
contributions and practical implementations of AR and VR 3D product visualizations in e-commerce compared to the wide-
spread 2D product images.

2.1. E-commerce
With the execution of the first electronical retail transaction on August 11, 1994, not only the term e-commerce was introduced
into people’s vocabulary, but also their entire way of life was changed (Jaller & Pahwa, 2020). By understanding and deter-
mining customer preferences, e-commerce has the advantage of delivering a personalized shopping experience by offering the
right product at the right time via the preferred shopping platform for a reasonable price (Elboudali et al., 2020; Luo et al.,
2020). This pre-selective product presentation can be enabled as the internet gives companies the possibility to market their
products regardless of the geographic location and thus to expand their customer base both nationally and internationally (Paz
& Delgado, 2020). Correspondingly, by suggesting products from multiple retailers, consumers also benefit, as decisions can
be made on the basis of the price-performance ratio (Luo et al., 2020). It is therefore not surprising that e-commerce has received
positive feedback and tremendous growth over the past decade; and it is forecasted that the rapid increase will carry on (Hwang
& Oh, 2020; Jaller & Pahwa, 2020; Klaus, 2020).

This development can mainly be credited to the feature that, like companies, consumers are no longer bound by time or place
and are provided greater flexibility in their scope of action (Hewawalpita & Perera, 2017; Jaller & Pahwa, 2020; Klaus, 2020;
Morotti et al., 2020). Furthermore, the ease of use and the associated minimal effort are key drivers for accepting e-commerce
(Klaus, 2020). Unlike in brick-and-mortar, the availability of products can be directly tracked, different offers can be compared
and more accurate product information can be collected from various retailers (Klaus, 2020; Nguyen, 2020). Given these ad-
vantages, e-commerce’s impact on everyday life and consequently the reshaped lifestyles becomes intelligible (Jaller & Pahwa,
2020).

Even though the fourth generation of e-commerce has arrived, a company’s online performance still holds some obstacles
regarding sensory stimulation in comparison to its brick-and-mortar, leading to incongruence in the customer shopping expe-
rience across channels (Paz & Delgado, 2020; Xue et al., 2020). Since the 1970s, the concept of retail atmosphere has been
studied concerning the effect of design elements on customers’ purchase intention (Paz & Delgado, 2020). Thereby it has been
noted that not only the chosen design elements for the shopping environment of a physical store can influence customer per-
ception and behavior, but also those of an electronic store (Paz & Delgado, 2020). Given this as well as the fact that of the five
human senses, the visual sense alone processes 70% of information, it is paradoxical that most online retailers use 2D product
images (Elboudali et al., 2020). Although brick-and-mortar is experienced in 3D and e-commerce is not limited in the way of
visualizing products (K. H. Liu et al., 2020; Morotti et al., 2020; Paz & Delgado, 2020). While on the one hand an integration
of 3D visualizations would have the advantage that product characteristics such as texture or wearability could be communi-
cated, providing richer product information (Jessen et al., 2020; Y. Liu et al., 2020; Morotti et al., 2020; Nguyen, 2020;
Papagiannidis et al., 2013; Sihi, 2018; Su et al., 2020). They could, on the other hand, also address the main weakness of e-
commerce, pointed out by 56% of consumers, naming the lack of direct first-hand experience with products (Jang et al., 2019;
Y. Liu et al., 2020).

By virtually “putting the product in the hand of the users” (Haile & Kang, 2020, p. 3) and allow them to twist and turn it
according to their own needs to gather all the relevant information to make a purchase decision, e-commerce does not only
ensure a greater interaction with products, but also more vivid and interactive shopping environments responsive to customers’
actions (Hwang & Oh, 2020; Meißner et al., 2020; Paz & Delgado, 2020). Whereas in e-commerce vividness is defined by the
expressive richness of the online shopping environment, interactivity refers to the degree to which consumers can influence the
content and form of a shopping environment (Jang et al., 2019). However, it is important to take into account that the interfaces
of a hyper-realistic online store need to have an appropriate degree of interactivity to enhance consumer engagement and
shopping experience, and not appear disruptive and cognitive overwhelming (Do et al., 2020; Hwang & Oh, 2020; Sihi, 2018).
It must be stated that the evaluation of the interactivity results from consumers’ personal as well as cognitive involvement in
the shopping activity (Nikhashemi et al., 2021; Park & Kim, 2021).

                                     AUGMENTED & VIRTUAL REALITY IN E-COMMERCE |                                                 2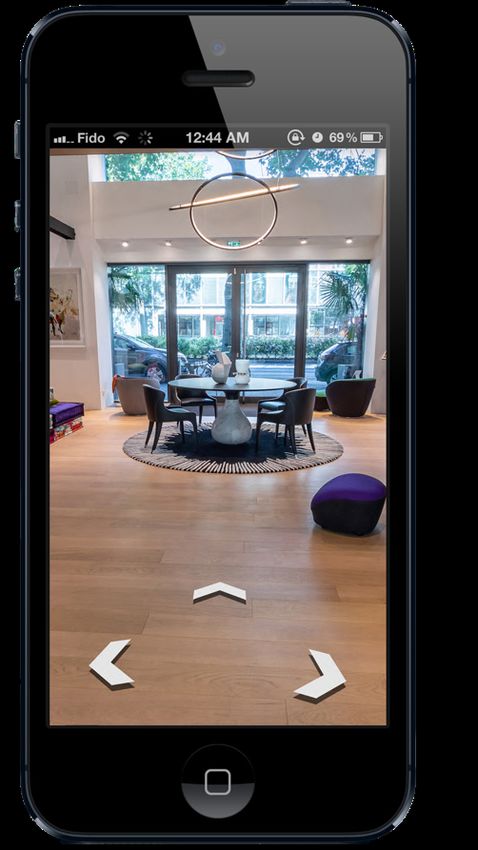
Given the potential for improvement through the integration of 3D product visualizations and consumers’ expectation that
interaction points and shopping experiences in e-commerce surpass those of brick-and-mortar, the question arises why the
implementation has not yet happened by the majority of retailers (Klaus, 2020; Xue et al., 2020). So far, retail has already
moved from a traditional product-centered approach to a customer-/service-centered perspective and the awareness of serving
needs through delivered shopping experiences are given (İzmirli et al., 2020; Jaller & Pahwa, 2020; Kim et al., 2020; K. H. Liu
et al., 2020; Paz & Delgado, 2020; Xue et al., 2020). Consequently, it is essential to examine how 3D product visualizations
can be implemented in the unrestrictive display landscape of e-commerce as a key to success and to create a ‘one-of-a-kind
shopping experience’ (Hwang & Oh, 2020; Y. Liu et al., 2020; Nguyen, 2020; Park & Kim, 2021).
2.2. 3D product visualizations
Even though technological developments like AR and VR have led to increasingly merge the virtual world with the real one in
various business areas in past decades, retailers have only started to focus on them for their e-commerce in recent years
(Rauschnabel, 2018; Romano et al., 2020; Sung, 2021; Xue et al., 2020). This change in focus is based on the following four
points: First, retailers have realized that they can strategically use AR and VR to differentiate themselves from their competitors
(Sihi, 2018). This leads to the second point: Because of this differentiation from the benchmark, consumers can more easily
get attracted in a highly competitive market (Sihi, 2018). Third, products can be presented with richer and more detailed infor-
mation, reducing the purchase risk, decreasing the discrepancy between the expectation and the actual product and therefore
the amount of returns (Jessen et al., 2020; Lee & Xu, 2018; Y. Liu et al., 2020; Sihi, 2018; Veneruso et al., 2020). This results
in the fourth and last point, due to the fact that more product knowledge and understanding is provided, the entire online
shopping experience can be enhanced (Sihi, 2018).
2.2.1 Augmented reality
As stated by Y. Liu et al. (2020), AR refers to the overlay of computer-generated 3D objects on a physically real surrounding.
Based on the study of Azuma in 1997, Dacko (2017) argues that the theory of AR is built on the following three pillars: 1)
combining virtual and real objects, 2) interacting in real-time and 3) perceiving virtual objects in a real surrounding. Given the
temporal co-existence of virtual and real objects, AR is also referred to by researchers as ‘mixed reality continuum’ or ‘mixed
reality’ (Dacko, 2017; Do et al., 2020; Haile & Kang, 2020; Park & Kim, 2021). Related to retail, AR comprises any approach
by which product information is provided to the consumer by means of stationary devices, illustrating 3D product visualizations
via self- or environment augmentation and enabling a more engaging and richer shopping experience (Dacko, 2017; Park &
Kim, 2021; Sung, 2021; Wodehouse & Abba, 2016). In the context of e-commerce, the implementation of AR includes camera-
equipped mobile devices likes smartphones, as well as the download of a retailer or third-party supplier apps to transmit a
realistic self-explanatory 3D product visualization (Haile & Kang, 2020; Y. Liu et al., 2020; Sung, 2021). In general, AR which
has been around since the 1960s but only became widespread in the early 2000s, offers a new creative and playful dimension
of interaction with products, while giving retailers the opportunity to distinguish themselves in the market (Do et al., 2020;
Jessen et al., 2020; Sung, 2021).
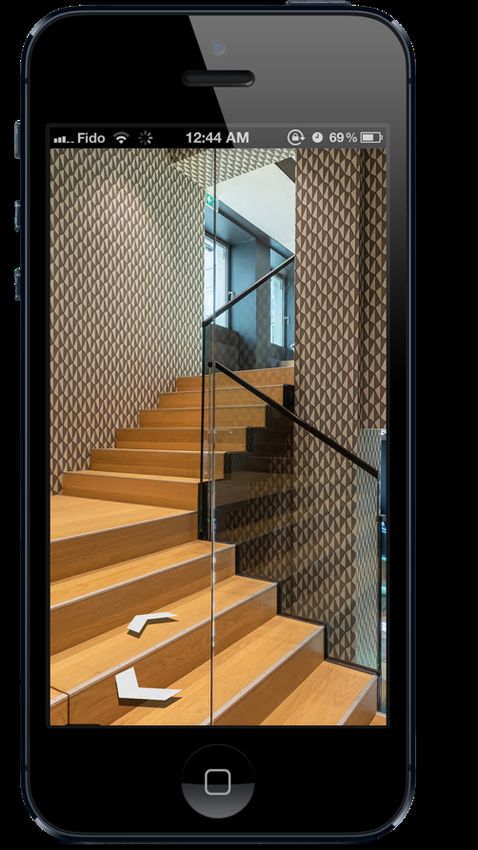
As previously mentioned, there are two application types of AR. First,
the environment-augmentation, which can be seen in Figure 1. This
type of fusion with reality enables customers to place objects such as
furniture anywhere in their environment (Sihi, 2018; Smink et al.,
2020). Also known as ‘virtual try-on’ or ‘magic mirror’ in the retail
industry, the second application option allows consumers to virtually
try products from various product categories, e.g., garments and acces-
sories by means of self-augmentation on the entire body or body parts,
as illustrated in Figure 2 (Y. Liu et al., 2020; Romano et al., 2020;
Smink et al., 2020). By enabling a ‘try before buying’ through both
application types, the biggest perceived drawback of e-commerce can Figure 1. Environment-augmentation (Ar-Ty., 2017)
be addressed (Veneruso et al., 2020). Given the fact that environment-
and self-augmentation furthermore allow to check whether the selected product corresponds to personal preferences, the overall
understanding of the product can be improved (Haile & Kang, 2020; Y. Liu et al., 2020; Ludwig et al., 2020; Park & Kim,
2021; Veneruso et al., 2020). As stated by Rauschnabel et al. (2019), AR mainly focuses on serving utilitarian benefits that
underlie a goal-oriented action. Because these 3D visualization types can visually convey more complete product information
and offer a virtual ‘trialability’, a more realistic expectation can be established, whereby reducing the purchase uncertainty
AUGMENTED & VIRTUAL REALITY IN E-COMMERCE | 3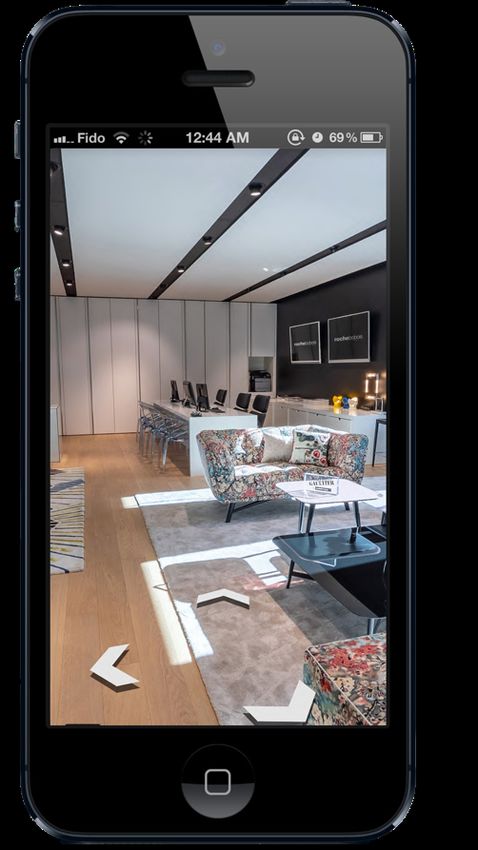
(Dacko, 2017; Jessen et al., 2020; Meißner et al., 2020; Veneruso et al., 2020;
                                                 Wodehouse & Abba, 2016).

                                                    While AR not only provides new, additional interaction points in e-commerce
                                                    compared to 2D product images, it also increasingly binds consumers with their
                                                    reality, disputing the argument of the loss of reality through digitalization (Do
                                                    et al., 2020; Ekren & Kumar, 2021; Jocevski, 2020; Ludwig et al., 2020; Sung,
                                                    2021). This is particularly recognizable in the fact that AR can not only visual-
                                                    ize one product in a defined place, but rather several products from a range of
                                                    categories within the app (Haile & Kang, 2020; Jessen et al., 2020; Romano et
                                                    al., 2020; Smink et al., 2020). By providing a ‘creative playground’ in which
      Figure 2. Self-augmentation (Grigonis., 2020) products can be moved back and forth and different combinations can be tried,
                                                    a cognitive relief can be enabled, since the strain on the mental imagination
decreases (Jessen et al., 2020). This becomes especially handy for products that require a lager spatial occupation and for which
a mentally imagery of the fit is harder (Meißner et al., 2020). Even though AR is eager to increase efficiency in e-commerce,
the approach of virtually handing over products to consumers also holds some entertainment during the information collection
process, thereby fulfilling hedonic benefits (Dacko, 2017; Do et al., 2020; Haile & Kang, 2020). By providing an examination
of products from all angles under own control terms, not only can the feeling of psychological ownership over products be
transmitted given the tangibility, but also the touch and feel sense can be indirectly stimulated (Meißner et al., 2020; Romano
et al., 2020; Smink et al., 2020). Caution should be drawn, however, to ensure that product visualizations are not considered as
too distracting and intrusive, as mentioned by Smink et al. (2020). This statement is strengthened by Hwang and Oh (2020)
and Rauschnabel et al. (2019) in Nikhashemi et al. (2021), who in addition state that the degree of interactivity offered is
decisive, as too interactive interfaces can cause cognitive overload and consequently stress and negative emotions.

Nevertheless, even if the 24/7 on-the-go 3D product visualizations of AR in real-life situations present a more realistic and
informative shopping experience (Nikhashemi et al., 2021; Park & Kim, 2021), this 3D visualization type comes at a price.
Disclosing too much private data and authorizing access to cameras of end devices, are the most sever drawbacks of AR (Dacko,
2017; Do et al., 2020). Followed by the lack of high quality content, which is particularly conspicuous in virtual try-ons of
garments (Sihi, 2018; Xue et al., 2020). According to Park and Kim (2021), this is due the fact that the current software used
for this purpose is based on 2D product images and therefore incapable to project a realistic fit of a garment on a real body.
Lastly, caused by the facts that the integration of AR in e-commerce is rather novel and that for information gathering a gami-
fication approach has been installed, there is a risk involved that interactions with the features of AR will be purely for fun and
not as support for transactions, as desired by retailers (Romano et al., 2020).

2.2.2 Virtual reality
Contrary to AR, VR, developed in 1980, refers to the immersion of users in a synthetic, virtual word in which they can freely
interact in real-time with computer-generated 3D objects as well as others via customized avatars (Cowan & Ketron, 2019;
Haile & Kang, 2020; Sihi, 2018; Su et al., 2020; Tran et al., 2011a; Xue et al., 2020). A virtual world can either be graphically
designed as a purely artificial environment or analogy to the real world, realistically reflecting its components (Elboudali et al.,
2020; Meißner et al., 2020; Tran et al., 2011c). Related to e-commerce, this means the simulation of an extensive shopping
scenario in which consumers feel engaged by the sensory of being present and thus receive an experience equivalent to brick-
and-mortar (Y. Liu et al., 2020; Su et al., 2020).
Two application types in online retail are used. Firstly, virtual fittings rooms (VFR) which are integrated by more than 84% of
fashion retailers (Fiore et al., 2005). These VFR enable consumers to virtually try on garments on an avatar, which can be
customized by manual input of body measurements and appearance (Figure 3) or automatically using a body scanning and
camera-based software (Lee & Xu, 2018). The most decisive factor is the scope of customization, as this has an influence on
self-perception and consequently on satisfaction (Y. Liu et al., 2020; Wodehouse & Abba, 2016). Secondly, the recreation of
an existing shopping situation, which often refers to an entire brick-and-mortar store where consumers can interact with both
the shopping environment and the products (Meißner et al., 2020; Park & Kim, 2021). As shown in Figure 4, not only can the
shopping environment be designed in 3D, but also products, which can be then further examined in detail thanks to the 360°
view (Hewawalpita & Perera, 2017). This 360° 3D product visualization is especially effective for design-focused and custom-
izable products such as automobiles or fashion pieces, as product attributes can be conveyed (Cowan & Ketron, 2019). Cur-
rently, this application type dominates in e-commerce as it can deliver a familiar shopping experience due to its accurate rep-
resentation of shelf levels, product portfolio and product placements to a brand’s offline retail (Tran et al., 2011c). Nevertheless,

                                      AUGMENTED & VIRTUAL REALITY IN E-COMMERCE |                                                  4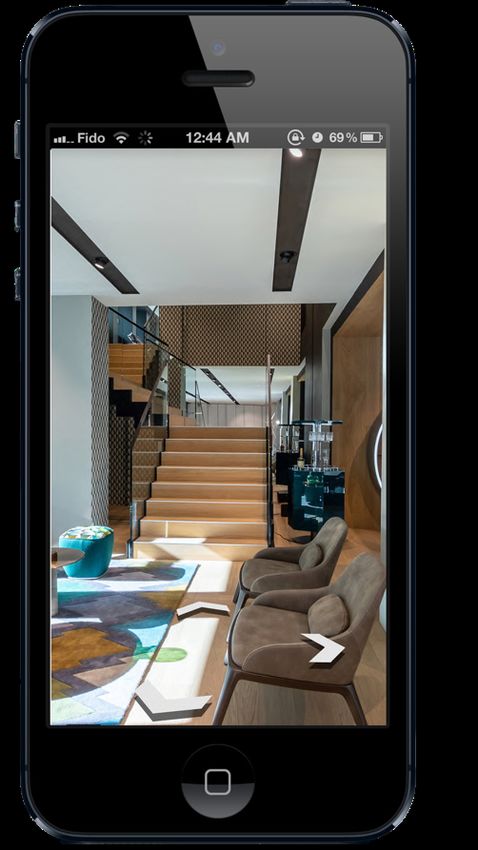
even if this visualization approach can satisfy the need to brows a store and
collect detailed product information, VR brick-and-mortar simulations are not
yet so advanced that full product interactions can take place and transactions
be carried out (Park & Kim, 2021; Tran et al., 2011a).

What VR does enable, however, is not only the personalization of products and
the visualization of retailer’s product portfolio, but also the customization of
entire online shopping environments (Elboudali et al., 2020; Papagiannidis et
al., 2013). In addition, VR, like AR, offers a ‘first-hand experience’, whereby
firstly the shopping experience becomes more tangible and secondly the pur-
chase risk reduced, as product details like material and cut shape can be exam-
ined more closely (Cowan & Ketron, 2019; Fiore et al., 2005; Sihi, 2018; Su
et al., 2020; Tran et al., 2011a).

Nonetheless, the integration of VR in e-commerce also entails its drawbacks.
While VR worlds offer vivid environments, in most cases interactivity is lim-
ited (Jang et al., 2019). Furthermore, the low integration rate of VFR has the
consequence that the software is not developed according to the needs, leading
to poor visulizations of bodies and appearances as well as lack of
representation of gestures and facial expressions, negatively affecting the
online shopping experience (Y. Liu et al., 2020). As previously stated, VR             Figure 3. VFR (MySureFit., 2021; Stemmit Inc., 2019)
simulations of brick-and-mortar are able to transmit detailed information only
to a certain degree, which in combination with the missing payment system means that the benefits of using such an online
                                                                  shopping environment are not immediately evident to new
                                                                  users (Jang et al., 2019; Tran et al., 2011c).

                                                                      Although VR does not make a clear seperation between the
                                                                      virtual and real world, and behaviour is often spilt from one to
                                                                      another, just simulating brick-and-mortar as a virtual online
                                                                      store is insufficient (Papagiannidis et al., 2013; Tran et al.,
                                                                      2011c). Nevertheless, the virtual shopping experience is to be
                                                                      designed as realistic as possible (Sihi, 2018). However, while
                                                                      designing virtual shopping environments the realistic
                                                                      visualization of products should not be neglected (Wodehouse
                                                                      & Abba, 2016). In fact, care should be taken to not only enable
                                                                      passive exploration of products, but rather a more detailed
                                                                      examination and acquisition through interactive high quality
                                                                      rendered content (Meißner et al., 2020; Wodehouse & Abba,
        Figure 4. Gucci virtual fashion boutique (Garcia, 2017)       2016).

2.3. Design & hypotheses
In general, retailers need to understand that the virtual shopping environments in e-commerce are there to make the already
available retail channels more vivid and interactive for consumers and not to replace them (Jang et al., 2019; Tran et al., 2011a).
However, when integrating 3D visualizations in e-commerce, attention should be drawn to whether the type of visualization is
suitable for the product to be displayed (Nikhashemi et al., 2021). Therefore, retailers should be aware of the features and
functions of their products as well as the degree to which they can be customized (Altarteer et al., 2013). Given the
aforementioned line of arguments, the following hypotheses have been formulated:

H1: Both an AR and VR 3D product visualization enhance consumers e-commerce experience in comparison to 2D product
   images.
H2: An AR 3D product visualization enhances consumers e-commerce experience in comparison to VR 3D product
   visualizations.
H3: An AR 3D product visualization is more suitable for a product whoes spatial placement is crucial than for a product where
   attention to detail is important.

                                           AUGMENTED & VIRTUAL REALITY IN E-COMMERCE |                                                   5
H4: An VR 3D product visualization is more suitable for a product where attention to detail is important than a product whoes
spatial placement is crucial.
By means of an experiment with a between-respondent design, which has been manipulated for both the visualization and
product type, it has been tested to what extent the visualization type can influence the e-commerce experience and how influ-
enceable the e-commerce experience is by the visualization type of a certain product type. Given that AR is better suited for
products with spatial ingestion, furniture was selected based on its dimensions. In the case of VR, due to the degree of custom-
ization and the attention to details shoes were chosen. An overview of the hypothesized relations between the variables under
study are presented in the conceptual mode in Figure 5.
Figure 5. Conceptual model controlled for gender and age
AUGMENTED & VIRTUAL REALITY IN E-COMMERCE | 6Chapter 3: Method
3.1. Research design
The current study consisted of two independent variables. First, visualization type, comprising of the three attributes: virtual
reality, augmented reality and 2D product images. Second, to further check if the acceptance or rejection of a product visuali-
zation was related to a product as indicated in the theoretical background, all three visualization types were selected for the two
product types: furniture and shoes. The dependent variable e-commerce comprised of six constructs: vividness, interactivity,
involvement, authenticity as well as utilitarian and hedonic benefits. In the context of online stores, presenting various product
offers (hereinafter also named as online store offer), the overall influence of the independent variables and their strength on the
dependent variable were examined.
In a 3x2 experiment between-respondent design the following six conditions of the independent variables (Figure 6) were
tested:
Figure 6. Instrument design
3.2. Selection of stimuli
To be able to investigate whether and to what extent the product visualization type has an impact on the e-commerce experience,
effective stimuli had to be selected. For this purpose, the first step was to check the availability of retailers’ online stores on
the market with the respective visualization types implemented. By providing participants with as realistic as possible shopping
environments, in which all interaction points of a purchase are already considered, error messages or non-execution of actions
and thus negative experiences, at least in this regard, can be avoided. Second, to prevent potential bias towards the online stores
and obtain a purely objective assessment of the delivered shopping experiences, the focus has been exclusively placed on
unbranded online stores. Thirdly, as in terms of self-visualization VR is not capable to deliver a realistic self-reflection with
the current technological applications, an environmental visualization has therefore been chosen for VR, meaning the simula-
tion of a brick-and-mortar store. For AR it was not possible to agree on one application type due to the two product types and
their completely different application areas. Accordingly, the shoes were illustrated with self-augmentation and the furniture
with environment-augmentation. In the case of the AR online stores, additional attention had to be paid as this type of 3D
product visualization can only be exploited using a separate app. Therefore, it was necessary to ensure that the apps were
available, free of charge and useable without login for the two most widespread operating systems, Apple and Android. After
several online stores had been chosen, the degree of comparison of the online stores’ product portfolios with each other were
examined as well as to what extent these shopping environments were controllable. Based on these points, a total of four
retailers, two for each product type as twice one retailer offered both a 2D website and VR environment visualization, have
been selected. Table 1 displays the individual online store offers under study.
AUGMENTED & VIRTUAL REALITY IN E-COMMERCE | 73.3. Procedure
The experimental stimuli all comprised of real online stores of unknown brands, whose e-commerce had no distortions in the
display rendering on mobile devices. However, the obstacle of using existing online stores rather than creating own ones was
that participants had to be redirected to external websites to investigate the stimuli. Resulting often in a barrier to further
participate for some due to the lack of security confidence when clicking on a provided link. To bypass this hurdle as far as
possible, participants were given a taste of the expected online store by means of
a short GIF played inside a smartphone frame, as shown in Figure 7. Due to the
continuous repetition the total viewing time was unlimited. The single images used
for each of the six stimuli can be found in Appendix I.
With the identification of the ideal retailers for the three visualization types, which
are both comparable within the visualization type between the two product types
as well as between the visualization types within the product type, the experiment
had been set up in the program ‘Qualitrics’. In total, the structure of the survey
consisted of nine question constructs, namely: shopping behaviour, familiarity
with AR and VR 3D visualizations and the usage of those while shopping online,
perception of the displayed online store with regards to its vividness, interactivity,
personal involvement, authenticity as well as utilitarian and hedonic benefits of-
fered, and overall brand perception. In Appendix III the details of each construct
and the questions asked in the conducted experiment can be found.
The beginning of the experiment included a detailed introduction to the topic, the
justification for the data collection, and information on the use, storage, and dele-
tion of the data sets obtained. Furthermore, it was pointed out that the study con-
ducted was not in collaboration with the brands presented. Subsequently, reference
was made to the anonymity of participation, which was guaranteed throughout the
entire process. Lastly, before the actual research questions were shown, partici-
pant’s consent was collected for voluntary participation, data collection and Figure 7. Online store offer 2 (furniture/VR)
AUGMENTED & VIRTUAL REALITY IN E-COMMERCE | 8further processing based on an informed consent. If a participant disagreed and thus selected no, the experiment was immedi-
ately terminated, and he/she was directed to the end of the survey.
First, general questions on demographics, shopping behaviour and familiarity with AR and VR, as well as their application in
e-commerce were asked. Followed by the display of one stimulus per participant, which was selected by computerized ran-
domization from the six available stimuli. Once the online shopping environment had been inspected in detail and participants
returned to the survey, questions were asked about the respective stimulus just experienced and its offered vividness and inter-
activity as well as participants’ involvement within the online store and its authenticity to brick-and-mortar. Thereupon ques-
tions were asked on the extent, if any, to which the online store and its product visualization type provided utilitarian and
hedonic benefits.
In order to verify the extent to which the gathered data were truly unbiased and thus valuable for inference, the following four
questions were additionally asked on a seven-point Likert scale at the end of the survey about the stimuli itself: 1) “How familiar
are you with the displayed online shop?” (not familiar at all to extremely familiar), 2) “To what extent are you familiar with
the brands displayed in the online shop?” (not familiar at all to extremely familiar), 3) “What kind of feelings emerge in you in
relation to the displayed brand/s?” (negative to positive) and 4) “How do you feel about the displayed brand/s” (dislike to like).
Finally, the experiment ended after approximately ten to fifteen minutes with the acknowledgement for participation.
To gather as much meaningful information as planned and not harm any of the participants, the research project was submitted
to the Ethics Committee of the University of Twente. The approval of the application (210560, Appendix IV) can be found in
Appendix V.
3.3.1. Pre-test – survey
To minimize operational blindness, bias and influence concerning the direction of the outcome in the structure of the experiment
as well as in its individual components and questions, the survey was forwarded to three people among acquaintances with no
prior knowledge of the study for review. See Appendix II for the tested layout of the survey. Firstly, the pre-test focused on the
general understanding of the questions and their relevance to the overall study topic. Secondly, operational aspects were
checked as to whether the procedure ran smoothly, problems occurred with the stimuli on the external platform and if the return
to the survey worked. Finally, the subjectively perceived length of the survey in relation to the objective time range stated was
tested.
Based on the feedbacks, the following four adjustments were made: (1) Introduction of the broadest definition of AR and VR
in colloquial language under the questions: “How familiar are you with augmented reality (AR)/ virtual reality (VR)?”, with
additionally one to two images that clarify the scope and differences. (2) Simplification of sentence structures, and replacement
of technical jargon by basic, more concrete words. (3) Insertion of a text block after returning to the survey and before the
study-specific questions to point out that all subsequent questions exclusively relate to the online store just explored. (4) Inte-
gration of a text block before the last two question constructs, hedonic benefits and brand perception, to highlight that the
survey was coming to an end: “You are almost done, two more slides.”. As pointed out under 3.3., the final survey of the
experiment with all these amendments is to be found in Appendix III.
3.4. Participants
3.4.1. Data collection procedure
The link and QR code to the experiment were shared in both the professional and personal environment of the researcher from
April 17 to May 9, 2021. Pinboards and private message functions of social media such as LinkedIn, Xing, Facebook and
Instagram served as indirect and direct communication pipes. In addition to the introduction and reasoning for the survey, it
was always indicated that everyone was welcome to spread the survey further to acquaintance and friends who might be inter-
ested in the topic. Snowball sampling was selected as the approach for data collection because of its fast, efficient, and cost-
effective aspects for finding participants in the predefined time slot of up to three weeks. In addition to the distribution within
the private networks, the University’s Survey Pool ‘SONA’ has been used as of April 30, 2021, after more than half of the data
volume had been recorded. In general, the recruitment of participants was based on a non-probability sampling method, as
mostly friends, family member and colleagues were included.
AUGMENTED & VIRTUAL REALITY IN E-COMMERCE | 93.4.2. Sample
According to Bentler and Chou (1987) the ratio of the sample to the number of constructs in the model of an experimental
quantitative research must be at least 5:1 or 10:1 in order to draw optimal conclusions. Since the conceptual model of this study
consisted of 13 constructs, an appropriate sample size would be from 65 to 130, preferably equally distributed between genders.
A total of 281 participants took part in the online experiment. However, because 81 participants did not complete the survey
and two participants did not give informed consent, only 198 participations were valid for further data analysis. Participants
came from 24 different countries, but Germany (123 participants) and the Netherlands (19 participants) dominated. Of these
198 participants, 104 were women and 94 were men, ranging in age from 19 to 60 years (M = 30.56, SD = 7.59). Dividing
participants further into two age groups in terms of ‘Younger’ (18-to-28-years) and ‘Older’ (29-to-60-years), 55.6% of partic-
ipants were classified as older and 44.4% as younger. A chi-square test was performed for both gender and age to determine
their distribution among the six conditions. For both, no expected cell frequencies were below 5 (gender -
χ²(5) = 6.316, p = .0277, φ = 0.277; age - χ²(5) = 9.877, p = .0079, φ = 0.079). According to this, gender and age of participants
were evenly spread across the six experimental conditions. Of all participants, over 75% had either a bachelor’s (37.9%, 75
participants) or master’s (37.9%, 75 participants) degree, only a minority hold a Ph.D. or higher (3%, 6 participants). The
remaining 42 participants had either a high school diploma or equivalent (12.6%, 25 participants), a technical or occupational
certificate (7.6%, 15 participants), or something else (1%, 2 participants).
In terms of preferred shopping channel, brick-and-mortar (47.5%) and e-commerce (52.2%) were about equal between partic-
ipants. Even if one of the purchasing channels was ranked by participants over the other, only a small percentage of participants
engage in an entire in-channel purchase approach for non-essential products, 8.1% only in stores and 6.1% exclusively online.
Consequently, the majority of participants apply a mix of both retail channels to complete their purchases, but in doing so,
45.5% increasingly rely on e-commerce and 40.4% on brick-and-mortar. This trend towards e-commerce is also reflected in
the strong familiarity of participants with online shopping (M = 6.17, SD = 1.10) as well as the monthly order frequency (M =
3.62, SD = 1.40). With reference to the familiarity with the two 3D visualization types under study, 63.6% indicated having
used AR in general before and 61.6% VR. In the context of online shopping and the implementation of AR and VR, 66.2%
highlighted that they have never used either visualization type in their purchase process. Solely 9.6% have integrated VR in
their online shopping experience and 10.6% AR. Furthermore, 13.6% participants have indicated that they already made use
of both AR and VR for their online shopping. The details of participants demographic characteristics for each experimental
condition can be found in Table 2.
AUGMENTED & VIRTUAL REALITY IN E-COMMERCE | 103.5. Measures
3.5.1. Discriminant validity of measures
To verify that the six constructs of the dependent variable and their assigned scale items were perceived as these individual
constructs in this study, a factor analysis has been performed. For this purpose, all 34 scale items for the e-commerce experience
(Appendix VI) were selected and analyzed applying the commands extract data by eigenvalue greater than 1, suppress small
coefficient below 0.50 and sorted by size. Moreover, the method Varimax has been chosen to obtain a rotated component matrix
of all scale items. The analysis showed a rearrangement of the scale items for constructs as well as an exclusion of four scale
items (Appendix VII). Resulting in the fact that the questionnaire of the experiment consisted of a total of eight constructs
instead of the intended six, namely: interactivity, authenticity, involvement with displayed product, involvement with visuali-
zation type, utilitarian benefits, multi-sensory stimulation, vividness of stimuli environment and hedonic benefits.
3.5.2. Reliability
Given that a construct is only perceived as reliable with an alpha value of 0.7 or higher, the Cronbach’s Alpha has been calcu-
lated for all e-commerce experience constructs to assess the internal consistency between each construct scale item (Boudreau
et al., 2001). As can be taken from Table 3, all constructs expect the latter, hedonic benefits, did reach acceptable internal
reliability. Consequently, the final construct was taken out for further analysis.
AUGMENTED & VIRTUAL REALITY IN E-COMMERCE | 11Based on these findings, the conceptual model was revised considering the research design explained at the beginning of this
chapter, as illustrated in Figure 8. See Appendix VIII for the coding scheme of the seven constructs of e-commerce experience
and their composition of scaling items. In the following, these constructs and their scale items are named and explained in more
detail. Unless otherwise stated, all questions have been measured on a seven-point Likert scale.
Figure 8. Revised conceptual model
3.5.3. Interactivity
Interactivity is defined as the provided degree of customization of the shopping environment in terms of content or form by the
user himself (Jang et al., 2019). In particular, the perceived control in modifying the interfaces of the online store was examined,
since this builds the core aspect of interactivity and leads to enhanced engagement (Hwang & Oh, 2020). Therefore, the meas-
urement of this construct, consisting of items from Sundar et al. (2015), Song and Zinkhan (2008) as well as Shen and
Joginapelly (2012), referred to the degree of perceived control and freedom in handling while collecting product information
(α = 0.90). Using a scale from (1) strongly disagree to (7) strongly agree, statements were proposed such as: “I felt that I had a
lot of control over the online shopping environment.”, “I felt that I could control my movements.” and “I felt that I could
interact with the products easily.”.
3.5.4. Authenticity
The measures of the construct authenticity, consisting of six questions, referred to all possible impressions and feelings that
consumers can experience during a brick-and-mortar shopping tour (α = 0.89). To investigate the extent of a realistic stimulation
of an offline shopping experience, established questions and their scales were taken from Algharabat and Dennis (2010) as
well as Merle et al. (2012). In this case, two scale variants were applied: (1) not at all to (7) a lot and (1) strongly disagree to
(7) strongly agree, and questions were asked like: “I enjoyed the online shopping experience in itself, not just for the products
I could purchase.”, “During the navigation, I felt the excitement of the hunt.” and “The online shop let me fell as if I am really
interacting with the products.”.
3.5.5. Involvement with displayed product
Since involvement has an effect on the engagement in the shopping process, four questions related to the personal relevance of
the products presented in the online store were asked to determine the extent to which participants cognitive engaged with the
online shopping experience (α = 0.92). Based on Zaichkowsky's (1994) personal involvement scale, four seven-point bipolar
scales: unimportant / important, does not matter / matters to me, of no concern / of concern to me and irrelevant /relevant, have
been proposed with the question: “How do you feel about the product type offered in the online shop?”.
AUGMENTED & VIRTUAL REALITY IN E-COMMERCE | 12You can also read