Blackstone Real Estate Income Trust - BREIT
←
→
Page content transcription
If your browser does not render page correctly, please read the page content below

PROPERT Y PROFILES
A S O F M A R C H 3 1 , 2 02 2

Blackstone Real
Estate Income Trust
BREIT

Above: Shield Industrial Portfolio, San Diego, CA

This is neither an offer to sell nor a solicitation of an offer to buy the securities described herein, and must be read in conjunction with the
prospectus in order to understand fully all of the implications and risks of the offering to which this sales and advertising literature relates. A
copy of the prospectus must be made available to you in connection with this offering, and is available at www.breit.com. The selected image
of the BREIT investment above is provided for illustrative purposes only, is not representative of all BREIT investments of a given property type
and is not representative of BREIT’s entire portfolio.

FIGURES AS OF MARCH 31, 2022 UNLESS OTHERWISE NOTED
S U M M A R Y O F R I S K FA C T O R S A N D O T H E R I N F O R M AT I O N impossible to predict, and as a result, could present material uncertainty and risk
with respect to BREIT and the performance of its investments and operations, and
BREIT is a non-listed REIT that invests primarily in stabilized income-generating
the ability of BREIT to achieve its investment objectives. Similar risks will exist to
commercial real estate investments across asset classes in the United States and,
the extent that any investments, service providers, vendors or certain other parties
to a lesser extent, real estate debt investments, with a focus on current income.
have material operations or assets in Russia, Ukraine, Belarus, or the immediate
We may invest to a lesser extent in countries outside of the U.S. This investment
surrounding areas.
involves a high degree of risk. You should purchase these securities only if you
can afford the complete loss of your investment. You should read the prospectus The properties referenced herein do not represent all BREIT investments. The
carefully for a description of the risks associated with an investment in BREIT. These selected images featured herein are provided for illustrative purposes only, are
risks include, but are not limited to, the following: not representative of all BREIT investments of a given property type and are not
representative of BREIT’s entire portfolio. It should not be assumed that BREIT’s
There is no public trading market for our common stock and repurchase of shares
investment in the properties identified and discussed herein were or will be
by us will likely be the only way to dispose of your shares. We are not obligated
profitable. Please refer to pages 27-34 for a complete list of BREIT’s real estate
to repurchase any shares under our share repurchase plan and may choose to
property holdings.
repurchase only some, or even none, of the shares that have been requested to
be repurchased. In addition, repurchases will be subject to available liquidity Neither the Securities and Exchange Commission (“SEC”), the Attorney General
and other significant restrictions. Further, our board of directors may make of the State of New York nor any other state securities regulator has approved
exceptions to, modify or suspend our share repurchase plan. As a result, our or disapproved of these securities or determined if the prospectus is truthful or
shares should be considered as having only limited liquidity and at times may complete. Any representation to the contrary is unlawful.
be illiquid.
This material makes reference to third-party data. URLs to public data have been
Distributions are not guaranteed and may be funded from sources other than provided where available. If no URL is provided, please contact BREIT for a copy of
cash flow from operations, including borrowings, offering proceeds, the sale of such source material or a summary thereto, to the extent such information may be
our assets and repayments of our real estate debt investments. We have no limits shared by BREIT. For access to the public data referenced herein, please refer to the
on the amounts we may fund from such sources. public data sources below.
The purchase and repurchase price for shares of our common stock are generally This sales material must be read in conjunction with BREIT’s prospectus in order to
based on our prior month’s net asset value (“NAV”) and are not based on any fully understand all the implications and risks of an investment in BREIT. Please refer
public trading market. While there will be independent annual appraisals of our to the prospectus for more information regarding state suitability standards and
properties, the appraisal of properties is inherently subjective, and our NAV may consult a financial professional for share class availability and appropriateness. This
not accurately reflect the actual price at which our properties could be liquidated sales material is neither an offer to sell nor a solicitation of an offer to buy securities.
on any given day. The NAV per share, if calculated as of the date on which you make An offering is made only by the prospectus, which must be made available to you
your subscription request or repurchase request, may be significantly different in connection with this offering and is available at www.breit.com/prospectus, and
than the transaction price you pay or the repurchase price you receive. Certain of a prospectus filed with the Department of Law of the State of New York. Prior to
our investments or liabilities are subject to high levels of volatility from time to making an investment, investors should read the prospectus in its entirety, including
time and could change in value significantly between the end of the prior month the “Risk Factors” section therein, which contain the risks and uncertainties
as of which our NAV is determined and the date that you acquire or repurchase that we believe are material to our business, operating results, prospects and
our shares, however the prior month’s NAV per share will generally continue to be financial condition.
used as the offering price per share and repurchase price per share.
Financial information is approximate and as of March 31, 2022, unless otherwise
We are dependent on BX REIT Advisors L.L.C. (the “Adviser”) to conduct our indicated. The words “we”, “us”, and “our” refer to BREIT, together with its
operations. The Adviser will face conflicts of interest as a result of, among consolidated subsidiaries, including BREIT Operating Partnership L.P., unless the
other things, the allocation of investment opportunities among us and Other context requires otherwise.
Blackstone Accounts (as defined in BREIT’s prospectus), the allocation of time
Blackstone Securities Partners L.P. (“BSP”) is a broker-dealer whose purpose is to
of its investment professionals and the substantial fees that we will pay to
distribute Blackstone managed or affiliated products. BSP provides services to its
the Adviser.
Blackstone affiliates, not to investors in its funds, strategies or other products. BSP
On acquiring shares, you will experience immediate dilution in the net tangible does not make any recommendation regarding, and will not monitor, any investment.
book value of your investment. As such, when BSP presents an investment strategy or product to an investor, BSP
does not collect the information necessary to determine—and BSP does not engage
There are limits on the ownership and transferability of our shares.
in a determination regarding—whether an investment in the strategy or product
If we fail to qualify as a REIT and no relief provisions apply, our NAV and cash is in the best interests of, or is suitable for, the investor. You should exercise your
available for distribution to our stockholders could materially decrease. own judgment and/or consult with a professional advisor to determine whether it
We do not own the Blackstone name, but we are permitted to use it as part of is advisable for you to invest in any Blackstone strategy or product. Please note
our corporate name pursuant to a trademark license agreement with an affiliate that BSP may not provide the kinds of financial services that you might expect from
of Blackstone Inc. (together with its affiliates, “Blackstone”). Use of the name by another financial intermediary, such as overseeing any brokerage or similar account.
other parties or the termination of our trademark license agreement may harm For financial advice relating to an investment in any Blackstone strategy or product,
our business. contact your own professional advisor.
Blackstone is a premier global investment manager. The real estate group of F O R WA R D - L O O K I N G S TAT E M E N T D I S C L O S U R E
Blackstone, Blackstone Real Estate, is our sponsor and an affiliate of our advisor.
Information regarding Blackstone and Blackstone Real Estate is included to Certain information contained in this communication constitutes “forward-looking
provide information regarding the experience of our sponsor and its affiliates. An statements” within the meaning of the federal securities laws and the Private
investment in BREIT is not an investment in our sponsor or Blackstone as BREIT is Securities Litigation Reform Act of 1995. These forward-looking statements can be
a separate and distinct legal entity. identified by the use of forward-looking terminology, such as “outlook,” “indicator,”
“believes,” “expects,” “potential,” “continues,” “identified,” “may,” “will,” “should,”
Certain countries have been susceptible to epidemics which may be designated as “seeks,” “approximately,” “predicts,” “intends,” “plans,” “estimates,” “anticipates”,
pandemics by world health authorities, most recently COVID-19. The outbreak of “confident,” “conviction” or the negative versions of these words or other
such epidemics, together with any resulting restrictions on travel or quarantines comparable words thereof. These may include our financial estimates and their
imposed, has had and may in the future have a negative impact on the economy underlying assumptions, statements about plans, objectives and expectations with
and business activity globally (including in the countries in which BREIT invests), respect to future operations, statements with respect to acquisitions, statements
and thereby may adversely affect the performance of BREIT’s investments. regarding future performance and statements regarding identified but not yet
Furthermore, the rapid development of epidemics could preclude prediction as to closed acquisitions. Such forward-looking statements are inherently uncertain and
their ultimate adverse impact on economic and market conditions, and, as a result, there are or may be important factors that could cause actual outcomes or results
presents material uncertainty and risk with respect to BREIT and the performance of to differ materially from those indicated in such statements. BREIT believes these
its investments. For further information on the impact of COVID-19 on BREIT, please factors also include but are not limited to those described under the section entitled
refer to “Risk Factors – The current outbreak of the novel coronavirus, or COVID-19, “Risk Factors” in its prospectus and annual report for the most recent fiscal year,
has caused severe disruptions in the U.S. and global economy and has had an adverse and any such updated factors included in its periodic filings with the SEC, which
impact on our performance and results of operations” in BREIT’s prospectus. are accessible on the SEC’s website at www.sec.gov. These factors should not be
On February 24, 2022, Russian troops began a full-scale invasion of Ukraine and, as construed as exhaustive and should be read in conjunction with the other cautionary
of the date of this material, the countries remain in active armed conflict. Around the statements that are included in this document (or BREIT’s prospectus and other
same time, the United States, the United Kingdom, the European Union, and several filings). Except as otherwise required by federal securities laws, we undertake no
other nations announced a broad array of new or expanded sanctions, export obligation to publicly update or revise any forward-looking statements, whether as
controls, and other measures against Russia, Russia-backed separatist regions in a result of new information, future developments or otherwise.
Ukraine, and certain banks, companies, government officials, and other individuals
in Russia and Belarus. The ongoing conflict and the rapidly evolving measures in P U B L I C D ATA S O U R C E S
response could be expected to have a negative impact on the economy and business IDC (https://www.idc.com/getdoc.jsp?containerId=prUS46286020)
activity globally (including in the countries in which BREIT invests), and therefore JLL (https://www.us.jll.com/en/trends-and-insights/research/data-center-outlook)
could adversely affect the performance of BREIT’s investments. The severity and U.S. Census Bureau (https://www.census.gov/programs-surveys/metro-micro/
duration of the conflict and its impact on global economic and market conditions are data/tables.html, https://www.census.gov/retail/index.html#ecommerce)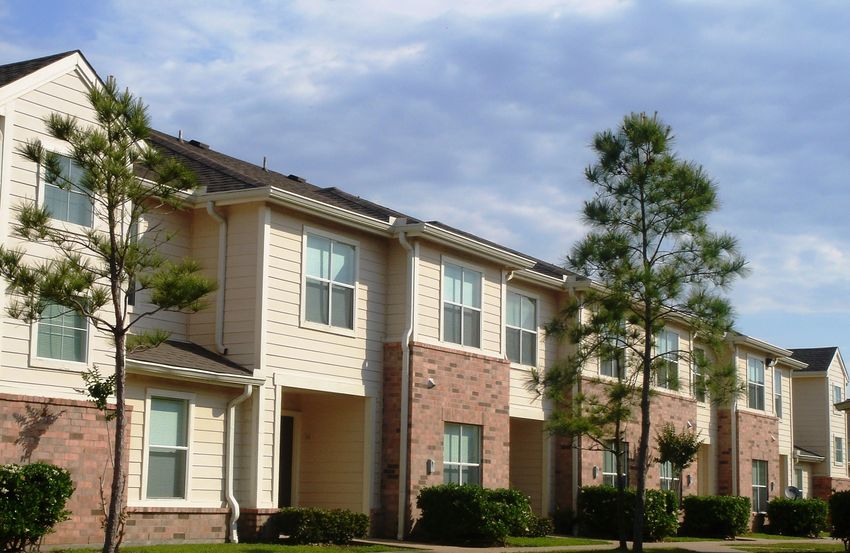
BREIT Brings Institutional
Quality Real Estate to
Income-Focused Investors
Sponsored by Blackstone Real Estate, the world’s largest
owner of commercial real estate1

$298B
Blackstone Real Estate
investor capital under management 2

789
Blackstone Real Estate
professionals globally

NOTE: “Institutional quality” refers to BREIT’s real estate portfolio and not the terms of the offering. Individual investors should be aware that institutional investors
      generally have different criteria when making investment decisions.
1.   Blackstone is a premier global investment manager. The real estate group of Blackstone, Blackstone Real Estate, is our sponsor and an affiliate of our advisor.
     Information regarding Blackstone and Blackstone Real Estate is included to provide information regarding the experience of our sponsor and its affiliates. An
     investment in BREIT is not an investment in our sponsor or Blackstone as BREIT is a separate and distinct legal entity. World’s largest owner based on Blackstone’s
     standing as the largest owner of commercial real estate globally by estimated market value and excludes governmental entities and religious organizations per Real
     Capital Analytics, as of March 31, 2022. A copy of the source materials of such data will be provided upon request.
2.   Investor capital includes co-investments and Blackstone’s GP and side-by-side commitments, as applicable.
The selected images of certain BREIT investments herein are provided for illustrative purposes only, are not representative of all BREIT investments of a given property
type and are not representative of BREIT’s entire portfolio.
Above: Canyon Industrial, Hanover, PA

                                                                                                                                  INTRODUCTION | BREIT                 01
BREIT PORTFOLIO OVERVIEW

High conviction, thematic portfolio
concentrated in growth markets1
Portfolio Snapshot

$63B                                                             3,097                                                       96%
net asset value 2                                                properties 3                                                occupancy3

Property Type4
Residential                                                                                                                                                 51%
Industrial                                                                                           29%
Net Lease                                       7%
Hospitality                         3%
Self Storage                        3%
Office                              3%
Data Centers                       2%
Retail                             2%
All figures as of March 31, 2022 unless otherwise noted. Additional information            3.   Reflects real estate investments only, including unconsolidated properties,
regarding our operations is available in our annual and interim financial statements            and does not include real estate debt investments. Single family rental homes
filed with the SEC. Investors should review this information in its entirety prior to           are not reflected in the number of properties. Occupancy is an important real
making an investment decision.                                                                  estate metric because it measures the utilization of properties in the portfolio.
1. Growth market means a market with high population growth relative to the U.S.                Occupancy is weighted by the total value of all consolidated real estate
     average. While BREIT generally seeks to acquire real estate properties located             properties, excluding our hospitality investments, and any third party interests
     in growth markets, certain properties may not be located in such markets.                  in such properties. For our industrial, data center, retail and office investments,
     Although a market may be a growth market as of the date of the publication of              occupancy includes all leased square footage as of the date indicated. For our
     this material, demographics and trends may change and investors are cautioned              multifamily, student housing and affordable housing investments, occupancy
     on relying upon the data presented as there is no guarantee that historical                is defined as the percentage of actual rent divided by gross potential rent
     trends will continue or that BREIT could benefit from such trends. U.S. Census             (defined as actual rent for occupied units and market rent for vacant units) for
     Bureau, as of July 2020, released in May 2021.                                             the three months ended on the date indicated. For our net lease investments,
                                                                                                occupancy includes leased properties as of the date indicated. For our single
2. This material contains references to our net asset value (“NAV”) and NAV-                    family rental investments, the occupancy rate includes occupied homes for the
     based calculations, which involve significant professional judgment. Our NAV               three months ended on the date indicated. For our self storage, manufactured
     is generally equal to the fair value of our assets less outstanding liabilities,           housing and senior living investments, the occupancy rate includes occupied
     calculated in accordance with our valuation guidelines. The calculated value               square footage, occupied sites and occupied units, respectively, as of the date
     of our assets and liabilities may differ from our actual realizable value or future        indicated. The average occupancy rate for our hospitality investments was 66%
     value which would affect the NAV as well as any returns derived from that                  for the 12 months ended March 31, 2022. Hospitality investments owned less
     NAV, and ultimately the value of your investment. As return information is                 than 12 months are excluded from the average occupancy rate calculation.
     calculated based on NAV, return information presented will be impacted should
     the assumptions on which NAV was determined prove to be different. NAV is             4.   “Property Type” weighting is measured as the asset value of real estate
     not a measure used under generally accepted accounting principles (“GAAP”)                 investments for each sector category (Residential, Industrial, Net Lease,
     and will likely differ from the GAAP value of our equity reflected in our financial        Hospitality, Self Storage, Office, Data Centers, Retail) divided by the total
     statements. As of March 31, 2022, our total equity under GAAP, excluding                   asset value of all real estate investments, excluding the value of any third party
     non-controlling third-party JV interests, was $43.8 billion and our NAV was                interests in such real estate investments (“Real Estate TAV”). The following
     $63.3 billion. As of March 31, 2022, our NAV per share was $14.82, $14.62,                 sectors each have subsectors comprising over 1.0% of Real Estate TAV.
     $14.53 and $14.82 for Class S, Class T, Class D and Class I shares, respectively,          Residential: multifamily, single family rental, student housing, affordable
     and GAAP equity per share/unit was $10.24. GAAP equity accounts for net                    housing and manufactured housing; Industrial: warehouses; and Hospitality:
     losses as calculated under GAAP, and we have incurred $95.9 million in net                 full service and select service hotels. “Real estate investments” includes our
     losses, excluding net losses attributable to non-controlling interests in third-           direct property investments, unconsolidated investments, and equity in public
     party JV interests, for the three months ended March 31, 2022. Our net losses              and private real estate-related companies. Please see the prospectus for
     as calculated under GAAP and a reconciliation of our GAAP equity, excluding                additional information on BREIT’s investments. Total asset value is measured as
     non-controlling third party JV interests, to our NAV are provided in our annual            (i) the asset value of real estate investments (based on fair value), excluding any
     and interim financial statements. As of March 31, 2022, 100% of inception to               third party interests in such real estate investments, plus (ii) the equity in our
     date distributions were funded from cash flows from operations. For further                real estate debt investments measured at fair value (defined as the asset value
     information, please refer to “Net Asset Value Calculation and Valuation                    of our real estate debt investments less the financing on such investments), but
     Guidelines” in BREIT’s prospectus, which describes our valuation process and               excluding any other assets (such as cash or any other cash equivalents). The
     the independent third parties who assist us.                                               total asset value would be higher if such amounts were included and the value
                                                                                                of our real estate debt investments was not decreased by the financing on such
                                                                                                investments. As of March 31, 2022, BREIT’s TAV was $100 billion.

02       BREIT | PORTFOLIO OVERVIEW
BREIT’s Top Markets1
                                                               DENVER                                    CHICAGO

                                                               3%                                        4%

                                                                                                                                                        N E W YO R K

                                                                                                                                                        2%
                                                                                                                                                        WA S H I N G TO N D.C .

                                                                                                                                                        3%
L A S V EG A S

10%
                                                                                                                                                        C H A R LO T T E

                                                                                                                                                        2%
LO S A N G E L E S

3%
                                                                                                                                                        AT L A N TA
SAN BERNARDINO

2%                                                                                                                                                      9%
                                                                                                                                                        ORLANDO
PHOENIX

4%                                                                                                                                                      4%
                                                        OT H E R
                                                       MARKETS                             DA L L A S           TA M PA                                 MIAMI

                                                       40%                                 6%                   3%                                      5%

S TAT E C O N C E N T R AT I O N

        MORE THAN 10%                        6—10%                    2—5%                 LESS THAN 2%

1.   BREIT invests primarily in U.S. commercial real estate, but may invest to a lesser extent in countries outside of the U.S. The select markets that are named represent
     all metropolitan statistical areas (“MSAs”) in the U.S. in which BREIT has at least a 2.0% weighting. BREIT is invested in additional MSAs which are not named above.
     Shading reflects the concentration of all real estate properties and unconsolidated investments in each state. “Other Markets” includes 1% of non-U.S. assets, including
     investments in Europe and Canada. Weighting is measured as the asset value of real estate properties and unconsolidated investments for each market divided by the total
     asset value of all (i) real estate properties, excluding the value of any third party interests in such real estate properties, and (ii) unconsolidated investments. Locations
     provided for any properties in this Property Book (excluding the Real Estate Property Holdings section) indicate the MSA in which such property is located. MSA names
     have been abbreviated.
The selected images of certain BREIT investments herein are provided for illustrative purposes only, are not representative of all BREIT investments of a given property
type and are not representative of BREIT’s entire portfolio.
From above left: Jupiter 12 Industrial Portfolio, Dallas, TX; Roman Multifamily Portfolio, Orlando, FL

                                                                                                                                PORTFOLIO OVERVIEW | BREIT                     03
Residential
High-quality residential portfolio
concentrated in the Western and
Southern U.S.

                                                                                     51%
                                                                                     share of BREIT’s
                                                                                                                                      228k
                                                                                                                                      units
                                                                                     real estate asset value

NOTE: Each map in this section represents all MSAs in the U.S. in which BREIT is invested at the sector or portfolio level, as applicable and unless otherwise noted. The
      largest 50 MSAs are represented for Ace Affordable Housing. All Snapshot metrics herein are as of acquisition, unless otherwise noted. The selected images of
      certain BREIT investments herein are provided for illustrative purposes only, are not representative of all BREIT investments of a given property type and are not
      representative of BREIT’s entire portfolio. For a complete list of properties please see pages 27-34.

04      BREIT | RESIDENTIAL                                                                                       Above: Gilbert Heritage Multifamily, Phoenix, AZ
Ace Affordable Housing Portfolio

Investment Highlights                                            Snapshot

Acquisition of a U.S. affordable housing portfolio originally    December 2021              acquisition date
developed under the Federal Low Income Housing Tax
Credit (LIHTC) program                                           $7.9B   purchase price at share1

                                                                 652   assets across U.S.

High-quality portfolio consisting of primarily suburban,         ~80,000       units
garden-style properties located in markets such as
Austin, Dallas, Denver, Fort Collins, Houston, Kansas
City, Las Vegas, Los Angeles, Sacramento, Seattle and
Washington D.C.

Rents for LIHTC units can provide an opportunity for
strong, stable cash flows given they are based on local
income levels

NOTE: Map locations represent the 50 largest MSAs.
1.   BREIT ownership interest at acquisition: 71%.
Clockwise from above left: Denver, CO; Houston, TX; Austin, TX

                                                                                             RESIDENTIAL | BREIT   05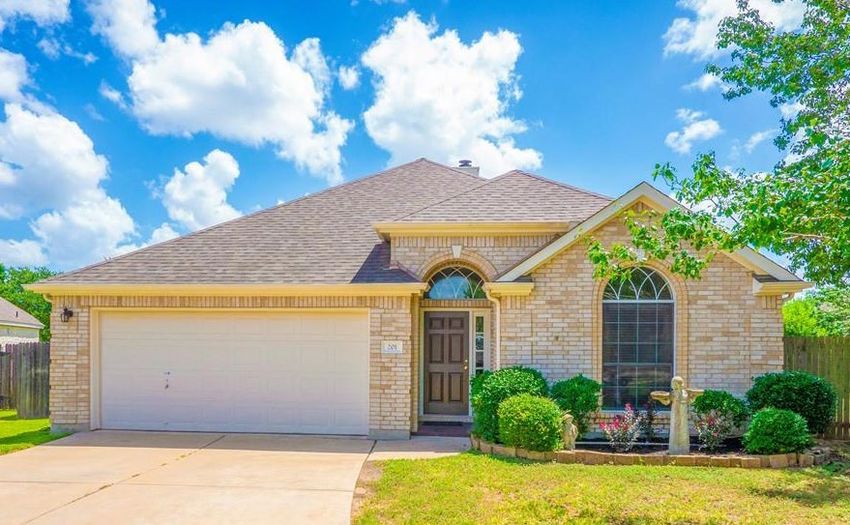
Home Partners of America

Investment Highlights                                                      Snapshot

Home Partners of America (“Home Partners”) is a premier                    July 2021    acquisition date
private owner / operator of single family rental homes in
the U.S.                                                                   $5.9B   purchase price at share 2

                                                                           18,809   homes

High-quality portfolio concentrated in U.S. growth markets
that are undersupplied1

Choice Lease program launched to expand the accessibility
of single family housing for low-to-moderate-income
residents

1.   U.S. Census Bureau, as of July 2020, released in May 2021. Growth
     market means a market with high population growth relative to the
     U.S. average. Housing undersupply based on U.S. Census Bureau as of
     December 31, 2021.
2.   The investment comprises three entities of which BREIT’s ownership
     interest at acquisition is 100%, 28% and 12%, respectively.
Clockwise from above left: Atlanta, GA; Austin, TX; Houston, TX

06     BREIT | RESIDENTIAL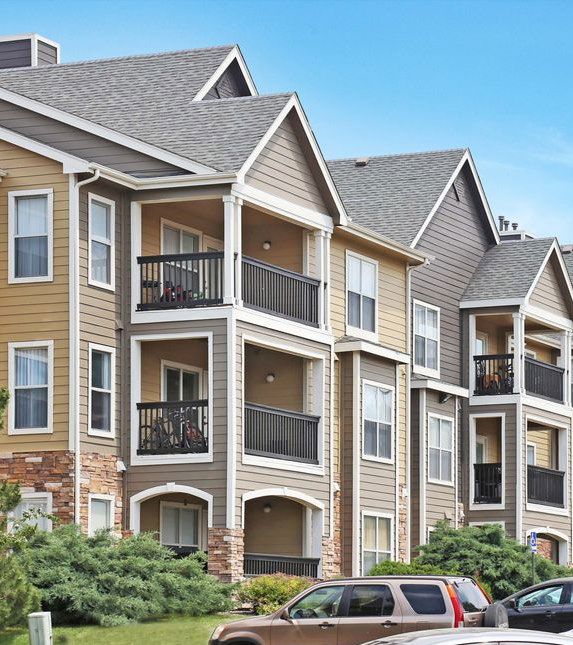
Roman 2.0 Multifamily Portfolio

Investment Highlights                                             Snapshot

Off-market acquisition of a portfolio of high-quality,            December 2021             acquisition date
garden-style apartment communities concentrated in
Atlanta, Dallas, Denver, Orlando and Phoenix                      $2.1B    purchase price

                                                                  20   assets across U.S.

Well-located properties in submarkets near employment             6,341    units
centers and in close proximity to major highways
and interstates

Highly amenitized with resort-style pools, fitness centers
and clubhouses

Clockwise from above left: Dallas, TX; Orlando, FL; Phoenix, AZ

                                                                                             RESIDENTIAL | BREIT   07
Acorn 2.0 Multifamily Portfolio

Investment Highlights                                               Snapshot

Off-market acquisition of a portfolio of high-quality               May 2021           acquisition date1
apartment communities concentrated in Atlanta, Austin,
Charlotte, Phoenix and Tampa                                        $1.7B     purchase price at share 2

                                                                    18   assets across U.S.

Well-located properties in submarkets near employment               6,997      units
centers and in close proximity to major highways
and interstates

Recently renovated properties with high-quality interior
finishes that are highly amenitized with resort-style pools,
fitness centers, clubhouses and pet parks

1.   BREIT acquired the properties between May and October 2021.
2.   BREIT ownership interest at acquisition: 98%.
Clockwise from above left: Charlotte, NC; Austin, TX; Phoenix, AZ

08     BREIT | RESIDENTIAL
Industrial
Strong e-commerce tailwinds propelling
industrial demand1
29%
share of BREIT’s
305M
s q uare fe e t
real estate asset value
NOTE: Each map in this section represents all MSAs in the U.S. in which BREIT is invested at the sector or portfolio level, as applicable. All Snapshot metrics herein
are as of acquisition, unless otherwise noted. The selected images of certain BREIT investments herein are provided for illustrative purposes only, are not
representative of all BREIT investments of a given property type and are not representative of BREIT’s entire portfolio. For a complete list of properties please
see pages 27-34.
1. U.S. Census Bureau, as of March 31, 2022.
Above: Jupiter 12 Industrial Portfolio, San Bernardino, CA INDUSTRIAL | BREIT 09Jupiter 12 Industrial Portfolio
Investment Highlights Snapshot
BREIT’s strategic acquisition of high-quality U.S. industrial
assets in one of Blackstone Real Estate’s highest conviction September 2019 acquisition date
investment themes $5.3B purchase price
Portfolio of predominately Class A distribution buildings and infill 315 assets across U.S.
small-bay warehouses
64M square feet
Part of Blackstone Real Estate’s $18.7 billion investment, the
largest private real estate transaction in history at the time
of acquisition
Primarily concentrated in infill locations in major distribution
markets including Atlanta, Chicago, Cincinnati, Dallas, Harrisburg
and Orlando
Top five tenants include Amazon, Lowe’s, Starbucks, the U.S.
Government and Whirlpool, which represent 22% of the total
square feet. Portfolio has a four-year weighted average lease length
(“WALL”) with no more than 18% of square footage expiring in a
single year1
1. The portfolio is occupied by over 700 tenants. Tenants listed herein
have a seven-year WALL.
Clockwise from above left: Dallas, TX; Orlando, FL; Chicago, IL
10 BREIT | INDUSTRIALWinston Industrial Portfolio
Investment Highlights Snapshot
Public to private acquisition of high-quality industrial REIT October 2021 acquisition date
domiciled in Canada with a portfolio consisting entirely of
U.S. industrial properties $3.2B purchase price at share 2
133 assets across U.S.
High-quality assets located in established industrial 40M square feet
submarkets across the U.S. and concentrated in Atlanta,
Dallas, Houston, Indianapolis, Los Angeles, Memphis,
Minneapolis and Philadelphia
Top tenants include Amazon, FedEx, General Mills, IKEA
and International Paper. Portfolio has a four‑year WALL1
1. The portfolio is occupied by over 150 tenants. Tenants listed herein
represent 18% of the total square feet, have a five-year WALL and are
among the top 10 largest tenants across the portfolio.
2. The investment comprises five entities of which BREIT’s ownership
interest at acquisition is 100%, 55%, 51%, 10% and 0.4%, respectively.
Clockwise from above left: Minneapolis, MN; Houston, TX; Los Angeles, CA
INDUSTRIAL | BREIT 11Canyon 2.0 Industrial Portfolio
Investment Highlights Snapshot
Portfolio of predominately Class A distribution buildings November 2021 acquisition date
and infill, small-bay warehouses
$2.3B purchase price at share 2
Concentrated in Chicago, Dallas, Indianapolis, Miami, 102 assets across U.S.
New York and San Bernardino 15M square feet
Highly diversified tenant base, featuring credit tenants
including Amazon and XPO Logistics. Portfolio has a
five‑year WALL1
1. The portfolio is occupied by nearly 200 tenants. Tenants listed herein
represent 11% of the portfolio’s total square feet, have a six-year WALL
and are the top 2 largest tenants across the portfolio.
2. BREIT ownership interest at acquisition: 99%.
Clockwise from above left: Miami, FL; Dallas, TX; Atlanta, GA
12 BREIT | INDUSTRIALNet Lease
Stable long-term income
with built-in annual rent growth
7%
share of BREIT’s
3
properties
real estate asset value
NOTE: Each map in this section represents all MSAs in the U.S. in which BREIT is invested at the sector or portfolio level, as applicable. All Snapshot metrics herein
are as of acquisition, unless otherwise noted. The selected images of certain BREIT investments herein are provided for illustrative purposes only, are not
representative of all BREIT investments of a given property type and are not representative of BREIT’s entire portfolio. For a complete list of properties please
see pages 27-34.
Above: Bellagio, Las Vegas, NV NET LEASE | BREIT 13Bellagio Net Lease
Investment Highlights Snapshot
The Bellagio is a high-quality resort located on 77 acres November 2019 acquisition date
at the center of the Las Vegas Strip. The property is
well‑amenitized with 155k square feet of gaming space, $4.0B purchase price at share1
85k square feet of retail and 29 food & beverage outlets
Las Vegas, NV location
BREIT acquired the property from MGM Resorts 9M square feet
International (“MGM”) in a 95%/5% joint venture
with MGM
MGM leased back the property for 30 years with two
10‑year extension options with built-in contractual annual
rent growth
MGM provided a full corporate guaranty for all rent
payments and continues to manage, operate and
be responsible for all aspects of the property on a
day‑to‑day basis
1. BREIT ownership interest at acquisition: 95%.
Above: Las Vegas, NV
14 BREIT | NET LEASEMGM Grand and Mandalay Bay Net Lease
Investment Highlights Snapshot
The MGM Grand and Mandalay Bay are high-quality February 2020 acquisition date
resorts located on the Las Vegas Strip. The properties are
well-amenitized with 300k square feet of gaming space and $2.3B purchase price at share1
3M square feet of meeting space across 226 acres
Las Vegas, NV location
BREIT acquired the MGM Grand and the Mandalay Bay in 16M square feet
a 49.9%/50.1% joint venture with MGM Growth Properties
MGM leased back the properties for 30 years with two
10-year extension options with built-in contractual annual
rent growth
MGM provided a full corporate guaranty for all rent
payments and continues to manage, operate and
be responsible for all aspects of the properties on a
day‑to‑day basis
1. BREIT ownership interest at acquisition: 49.9%.
Above: Las Vegas, NV
NET LEASE | BREIT 15Hospitality
High-quality hotels
with strong brands
3%
share of BREIT’s
11k
keys
real estate asset value
NOTE: Each map in this section represents all MSAs in the U.S. in which BREIT is invested at the sector or portfolio level, as applicable. All Snapshot metrics herein
are as of acquisition, unless otherwise noted. The selected images of certain BREIT investments herein are provided for illustrative purposes only, are not
representative of all BREIT investments of a given property type and are not representative of BREIT’s entire portfolio. For a complete list of properties please
see pages 27-34.
16 B R E I T | H O S P I TA L I T Y Above: Raven Select Service Portfolio, Austin, TXJW Marriott San Antonio
Hill Country Resort & Spa
Investment Highlights Snapshot
High-quality resort on 622 acres in San Antonio’s August 2018 acquisition date
Hill Country
$616M purchase price
Well-located destination within driving distance of San Antonio, TX location
San Antonio and Austin 1,002 keys
Recently built in 2010, renovated in 2018 and
well-amenitized with over 200k square feet of meeting
space, two PGA golf courses, water park, spa and eight
food & beverage outlets
Above: San Antonio, TX
H O S P I TA L I T Y | B R E I T 17Hyatt Regency Atlanta
Investment Highlights Snapshot
High-quality, group-oriented hotel located in the heart of September 2019 acquisition date
downtown Atlanta within walking distance of the city’s
football stadium, convention center and top attractions $355M purchase price
Atlanta, GA location
Well-amenitized with 180k square feet of meeting space, 1,260 keys
a seasonal outdoor pool, four food & beverage outlets and
indoor access to the train station and convention center
Atlanta ranks 10th among the largest metropolitan
economies in the U.S.1
1. U.S. Census Bureau, as of July 2020, released in May 2021.
Above: Atlanta, GA
18 B R E I T | H O S P I TA L I T YSelf Storage
Historically resilient sector with
limited capital expenditures
3%
share of BREIT’s
14M
square feet
real estate asset value
NOTE: Each map in this section represents all MSAs in the U.S. in which BREIT is invested at the sector or portfolio level, as applicable. All Snapshot metrics herein
are as of acquisition, unless otherwise noted. The selected images of certain BREIT investments herein are provided for illustrative purposes only, are not
representative of all BREIT investments of a given property type and are not representative of BREIT’s entire portfolio. For a complete list of properties please
see pages 27-34.
Above: Simply Self Storage, Los Angeles, CA SELF STOR AGE | BREIT 19Simply Self Storage
Investment Highlights Snapshot
High-quality self storage portfolio located across the U.S. December 2020 acquisition date
and concentrated in Chicago, Dallas, Houston, Memphis,
New York, Oklahoma City, Orlando and Tampa $1.2B purchase price
102 assets across U.S.
Fully integrated self storage platform with significant 8M square feet
potential for growth through future acquisitions in a highly
fragmented sector
Following this acquisition, BREIT became the third largest
non-listed owner of storage in the U.S.1
1. At acquisition, December 2020. Includes private owners and
non‑listed REITs.
Clockwise from above left: Minneapolis, MN; Seattle, WA; Orlando, FL
20 BREIT | SELF STOR AGEOffice
High-quality office properties
in innovation-focused markets
3%
share of BREIT’s
4M
square feet
real estate asset value
NOTE: Each map in this section represents all MSAs in the U.S. in which BREIT is invested at the sector or portfolio level, as applicable. All Snapshot metrics herein
are as of acquisition, unless otherwise noted. The selected images of certain BREIT investments herein are provided for illustrative purposes only, are not
representative of all BREIT investments of a given property type and are not representative of BREIT’s entire portfolio. For a complete list of properties please
see pages 27-34.
Above: Coleman Highline Office, San Jose, CA OFFICE | BREIT 21One Manhattan West Office
Investment Highlights Snapshot
Constructed in 2019 to the highest physical standards, March 2022 acquisition date
the 70-story trophy office asset is located adjacent
to Penn Station in the heart of New York City’s $1.4B purchase price at share 2
Manhattan West / Hudson Yards submarket in Midtown New York, NY location
2M square feet
Property features skyline views, floor-to-ceiling glass
windows, column-free floorplates and outdoor terrace space
Diversified, high-quality tenant base across various
industries including Skadden, EY, Accenture and the
National Hockey League1
1. The property is occupied by nine tenants. The tenants referenced
above are the largest tenants, representing 83% of the property’s total
square feet.
2. BREIT ownership interest at acquisition: 49%.
Above: New York, NY
22 BREIT | OFFICEData Centers
Surging growth in data
driving demand for data centers1
2%
share of BREIT’s
11M
square feet
real estate asset value
NOTE: Each map in this section represents all MSAs in the U.S. in which BREIT is invested at the sector or portfolio level, as applicable. All Snapshot metrics herein
are as of acquisition, unless otherwise noted. The selected images of certain BREIT investments herein are provided for illustrative purposes only, are not
representative of all BREIT investments of a given property type and are not representative of BREIT’s entire portfolio. For a complete list of properties please
see pages 27-34.
1. CBRE 2022 U.S. Real Estate Market Outlook – Data Centers, as of December 8, 2021.
Above: QTS Data Centers, Arlington, VA D ATA C E N T E R S | B R E I T 23QTS Data Centers
Investment Highlights Snapshot
Acquisition of one of the largest U.S. portfolios of mission August 2021 acquisition date
critical data centers located in top tier data center markets
$3.2B purchase price at share1
Concentrated in Arlington, Atlanta and Dallas 48 assets across U.S. and Europe 2
8M square feet
Tenants are primarily investment grade global technology,
media and financial services companies
QTS is a high-quality platform with a talented and
experienced management team
1. BREIT and other Blackstone co-investment and supplemental
vehicles participated in this transaction. BREIT ownership interest at
acquisition: 33%.
2. Includes 27 data centers in the U.S., two data centers in Europe and
19 land and development sites in the U.S.
Clockwise from above left: Atlanta, GA; Atlanta, GA; Dallas, TX
24 B R E I T | D ATA C E N T E R SRetail
Primarily grocery-anchored shopping centers
in high-density locations with strong demographics
and limited new supply
2%
share of BREIT’s
6M
square feet
real estate asset value
NOTE: Each map in this section represents all MSAs in the U.S. in which BREIT is invested at the sector or portfolio level, as applicable. All Snapshot metrics herein
are as of acquisition, unless otherwise noted. The selected images of certain BREIT investments herein are provided for illustrative purposes only, are not
representative of all BREIT investments of a given property type and are not representative of BREIT’s entire portfolio. For a complete list of properties please
see pages 27-34.
Above: SoCal Grocery Portfolio, Los Angeles, CA R E TA I L | B R E I T 25Bingo Retail Portfolio
Investment Highlights Snapshot
12 grocery-anchored shopping centers located in affluent December 2021 acquisition date
and densely populated areas primarily in Western and
Southern U.S. markets, with concentrations in Atlanta, $800M purchase price
Chicago, Los Angeles, Newark and Seattle 12 assets across U.S.
2M square feet
Properties are anchored by high performing grocers, such
as BJ’s, HEB, Kroger, Mariano’s, Publix and Whole Foods1
Portfolio has a six-year WALL and features a variety of
other service-oriented and necessity-based tenants
1. The portfolio is occupied by 303 tenants. The anchor tenants
referenced above are among the top 20 largest tenants and have a
seven-year WALL. In total, grocery tenants comprise 34% of portfolio
square footage.
Clockwise from above left: Atlanta, GA; Houston, TX; Newark, NJ
26 B R E I T | R E TA I LBREIT Real Estate Property Holdings
NUMBER OF OWNERSHIP OCCUPANCY
SEGMENT AND INVESTMENT PROPERTIES1 LOCATION ACQUISITION DATE INTEREST2 UNITS1 RATE3
RESIDENTIAL
TA Multifamily Portfolio 5 Various Apr 2017 100% 2,053 units 93%
Emory Point 1 Atlanta, GA May 2017 100% 750 units 95%
Nevada West Multifamily 3 Las Vegas, NV May 2017 100% 972 units 92%
Mountain Gate & Trails Multifamily 2 Las Vegas, NV Jun 2017 100% 539 units 94%
Elysian West Multifamily 1 Las Vegas, NV Jul 2017 100% 466 units 96%
Gilbert Multifamily 2 Gilbert, AZ Sep 2017 90% 748 units 95%
Domain & GreenVue Multifamily 2 Dallas, TX Sep 2017 100% 803 units 94%
ACG II Multifamily 3 Various Sep 2017 94% 740 units 94%
Olympus Multifamily 3 Jacksonville, FL Nov 2017 95% 1,032 units 92%
Amberglen West Multifamily 1 Hillsboro, OR Nov 2017 100% 396 units 94%
Aston Multifamily Portfolio 17 Various Various 100% 3,731 units 94%
Talavera and Flamingo Multifamily 2 Las Vegas, NV Dec 2017 100% 674 units 93%
Walden Pond & Montair Multifamily Portfolio 2 Everett, WA & Thornton, CO Dec 2017 95% 636 units 93%
Signature at Kendall Multifamily 1 Miami, FL Dec 2017 100% 546 units 93%
Blue Hills Multifamily 1 Boston, MA May 2018 100% 472 units 94%
Wave Multifamily Portfolio 6 Various May 2018 100% 2,199 units 94%
ACG III Multifamily 2 Gresham, OR & Turlock, CA May 2018 95% 475 units 93%
Carroll Florida Multifamily 2 Jacksonville & Orlando, FL May 2018 100% 716 units 92%
Solis at Flamingo 1 Las Vegas, NV Jun 2018 95% 524 units 91%
Velaire at Aspera 1 Phoenix, AZ Jul 2018 100% 286 units 95%
Coyote Multifamily Portfolio 6 Phoenix, AZ Aug 2018 100% 1,752 units 94%
Avanti Apartments 1 Las Vegas, NV Dec 2018 100% 414 units 96%
Gilbert Heritage Apartments 1 Phoenix, AZ Feb 2019 90% 256 units 94%
Roman Multifamily Portfolio 14 Various Feb 2019 100% 3,743 units 94%
Elevation Plaza Del Rio 1 Phoenix, AZ Apr 2019 90% 333 units 96%
Courtney at Universal Multifamily 1 Orlando, FL Apr 2019 100% 355 units 92%
Citymark Multifamily 2-Pack 2 Las Vegas, NV & Lithia Springs, GA Apr 2019 95% 608 units 93%
Tri-Cities Multifamily 2-Pack 2 Richland & Kennewick, WA Apr 2019 95% 428 units 92%
Raider Multifamily Portfolio 4 Las Vegas, NV Various 100% 1,514 units 94%
Bridge II Multifamily Portfolio 6 Various Various 100% 2,363 units 93%
Miami Doral 2-Pack 2 Miami, FL May 2019 100% 720 units 96%
Davis Multifamily 2-Pack 2 Raleigh, NC & Jacksonville, FL May 2019 100% 454 units 93%
Slate Savannah 1 Savannah, GA May 2019 90% 272 units 98%
Amara at MetroWest 1 Orlando, FL May 2019 95% 411 units 94%
Colorado 3-Pack 3 Denver & Fort Collins, CO May 2019 100% 855 units 94%
Edge Las Vegas 1 Las Vegas, NV Jun 2019 95% 296 units 96%
NOTE: As of March 31, 2022. Past performance does not guarantee future results. Actual results may vary. Diversification does not assure a profit or
protect against a loss in a declining market. Please refer to the endnotes on page 34.
R E A L E S TAT E P R O P E R T Y H O L D I N G S | B R E I T 27BREIT Real Estate Property Holdings (Cont’d)
NUMBER OF OWNERSHIP OCCUPANCY
SEGMENT AND INVESTMENT PROPERTIES1 LOCATION ACQUISITION DATE INTEREST2 UNITS1 RATE3
RESIDENTIAL (CONT’D)
ACG IV Multifamily 2 Woodland, CA & Puyallup, WA Jun 2019 95% 606 units 95%
Perimeter Multifamily 3-Pack 3 Atlanta, GA Jun 2019 100% 691 units 94%
Anson at the Lakes 1 Charlotte, NC Jun 2019 100% 694 units 94%
San Valiente Multifamily 1 Phoenix, AZ Jul 2019 95% 604 units 94%
Edgewater at the Cove 1 Oregon City, OR Aug 2019 100% 244 units 91%
Haven 124 Multifamily 1 Denver, CO Sep 2019 100% 562 units 92%
Villages at McCullers Walk Multifamily 1 Raleigh, NC Oct 2019 100% 412 units 95%
Canopy at Citrus Park Multifamily 1 Largo, FL Oct 2019 90% 318 units 93%
Ridge Multifamily Portfolio 4 Las Vegas, NV Oct 2019 90% 1,220 units 93%
Charleston on 66th Multifamily 1 Tampa, FL Nov 2019 95% 258 units 93%
Evolve at Timber Creek Multifamily 1 Garner, NC Nov 2019 100% 304 units 95%
Solis at Towne Center Multifamily 1 Glendale, AZ Nov 2019 100% 240 units 95%
Arches at Hidden Creek Multifamily 1 Chandler, AZ Nov 2019 98% 432 units 91%
Terra Multifamily 1 Austin, TX Dec 2019 100% 372 units 94%
Arium Multifamily Portfolio 5 Various Dec 2019 100% 1,684 units 93%
Easton Gardens Multifamily 1 Columbus, OH Feb 2020 95% 1,064 units 95%
Acorn Multifamily Portfolio 21 Various Feb & May 2020 98% 8,309 units 94%
Indigo West Multifamily 1 Orlando, FL Mar 2020 100% 456 units 93%
The Sixes Multifamily 1 Holly Springs, GA Sep 2020 100% 340 units 95%
Park & Market Multifamily 1 Raleigh, NC Oct 2020 100% 409 units 94%
Cortland Lex Multifamily 1 Alpharetta, GA Oct 2020 100% 360 units 96%
The Palmer Multifamily 1 Charlotte, NC Oct 2020 90% 318 units 95%
Grizzly Multifamily Portfolio 2 Atlanta, GA & Nashville, TN Oct & Nov 2020 100% 767 units 94%
Jaguar Multifamily Portfolio 11 Various Nov & Dec 2020 100% 3,788 units 94%
Kansas City Multifamily Portfolio 2 Overland Park & Olathe, KS Dec 2020 100% 620 units 93%
The View at Woodstock Multifamily 1 Woodstock, GA Jan 2021 100% 320 units 97%
Southeast Multifamily Portfolio 2 Lebanon, TN & Sanford, FL Feb 2021 98% 330 units 94%
Cortona South Tampa Multifamily 1 Tampa, FL Apr 2021 100% 300 units 93%
Crest at Park Central Multifamily 1 Dallas, TX Apr 2021 100% 387 units 96%
Archer & Rosery Multifamily Portfolio 2 Acworth, GA & Largo, FL Apr & May 2021 100% 539 units 92%
Encore Tessera Multifamily 1 Phoenix, AZ May 2021 80% 240 units 94%
Acorn 2.0 Multifamily Portfolio 18 Various Various 98% 6,997 units 85%
Vue at Centennial Multifamily 1 Las Vegas, NV Jun 2021 100% 372 units 95%
Charlotte Multifamily Portfolio 3 Various Jun & Aug 2021 100% 876 units 92%
Haven by Watermark Multifamily 1 Denver, CO Jun 2021 100% 206 units 94%
Legacy North Multifamily 1 Plano, TX Aug 2021 100% 1,675 units 93%
NOTE: As of March 31, 2022. Past performance does not guarantee future results. Actual results may vary. Diversification does not assure a profit or
protect against a loss in a declining market. Please refer to the endnotes on page 34.
28 B R E I T | R E A L E S TAT E P R O P E R T Y H O L D I N G SBREIT Real Estate Property Holdings (Cont’d)
NUMBER OF OWNERSHIP OCCUPANCY
SEGMENT AND INVESTMENT PROPERTIES1 LOCATION ACQUISITION DATE INTEREST2 UNITS1 RATE3
RESIDENTIAL (CONT’D)
The Brooke Multifamily 1 Atlanta, GA Aug 2021 100% 537 units 91%
One Boynton Multifamily 1 Boynton Beach, FL Aug 2021 100% 494 units 92%
Falcon Landing Multifamily 1 Katy, TX Aug 2021 90% 386 units 94%
Town Lantana Multifamily 1 Lantana, FL Sep 2021 90% 360 units 94%
Ring Multifamily Portfolio 12 Various Sep 2021 100% 3,030 units 94%
Villages at Pecan Grove Multifamily 1 Holly Springs, NC Nov 2021 100% 336 units 94%
Cielo Morrison Multifamily Portfolio 2 Charlotte, NC Nov 2021 90% 419 units 91%
FiveTwo at Highland Multifamily 1 Austin, TX Nov 2021 90% 390 units 95%
Roman 2.0 Multifamily Portfolio 20 Various Dec 2021 & Jan 2022 100% 6,341 units 95%
Kapilina Beach Homes Multifamily 1 Ewa Beach, HI Dec 2021 100% 1,459 units 87%
SeaTac Multifamily Portfolio 2 Edgewood & Everett, WA Dec 2021 90% 480 units 93%
Villages at Raleigh Beach Multifamily 1 Raleigh, NC Jan 2022 100% 392 units 94%
Raider 2.0 Multifamily Portfolio 1 Las Vegas, NV Mar 2022 100% 492 units 92%
Highroads MH 3 Phoenix, AZ Apr 2018 99.6% 265 units 97%
Evergreen Minari MH 2 Phoenix, AZ Jun 2018 99.6% 115 units 96%
Southwest MH 12 Various Jun 2018 99.6% 2,568 units 90%
Hidden Springs MH 1 Desert Hot Springs, CA Jul 2018 99.6% 317 units 85%
SVPAC MH 2 Phoenix, AZ Jul 2018 99.6% 233 units 99%
Riverest MH 1 Tavares, FL Dec 2018 99.6% 130 units 95%
Angler MH Portfolio 4 Phoenix, AZ Apr 2019 99.6% 770 units 93%
Florida MH 4-Pack 4 Various Apr & Jul 2019 99.6% 799 units 95%
Impala MH 3 Phoenix & Chandler, AZ Jul 2019 99.6% 333 units 99%
Clearwater MHC 2-Pack 2 Clearwater, FL Mar & Aug 2020 99.6% 207 units 97%
Legacy MH Portfolio 7 Various Apr 2020 99.6% 1,896 units 91%
May Manor MH 1 Lakeland, FL Jun 2020 99.6% 297 units 79%
Royal Oaks MH 1 Petaluma, CA Nov 2020 99.6% 94 units 99%
Southeast MH Portfolio 34 Various Dec 2020 99.6% 7,442 units 86%
Redwood Village MH 1 Santa Rosa, CA Jul 2021 99.6% 67 units 100%
Courtly Manor MH 1 Hialeah, FL Oct 2021 99.6% 525 units 100%
Crescent Valley MH 1 Newhall, CA Nov 2021 99.6% 85 units 93%
EdR Student Housing Portfolio 20 Various Sept 2018 95% 3,460 units 97%
Mercury 3100 Student Housing 1 Orlando, FL Feb 2021 100% 228 units 99%
Signal Student Housing Portfolio 8 Various Aug 2021 96% 1,749 units 94%
Standard at Fort Collins Student Housing 1 Fort Collins, CO Nov 2021 97% 237 units 97%
Intel Student Housing Portfolio 4 Reno, NV Various 98% 805 units 99%
Signal 2.0 Student Housing Portfolio 2 Buffalo, NY & Athens, GA Dec 2021 97% 366 units 98%
NOTE: As of March 31, 2022. Past performance does not guarantee future results. Actual results may vary. Diversification does not assure a profit or
protect against a loss in a declining market. Please refer to the endnotes on page 34.
R E A L E S TAT E P R O P E R T Y H O L D I N G S | B R E I T 29BREIT Real Estate Property Holdings (Cont’d)
NUMBER OF OWNERSHIP OCCUPANCY
SEGMENT AND INVESTMENT PROPERTIES1 LOCATION ACQUISITION DATE INTEREST2 UNITS1 RATE3
RESIDENTIAL (CONT’D)
Robin Student Housing Portfolio 8 Various Mar 2022 98% 1,703 units 95%
Legacy on Rio Student Housing 1 Austin, TX Mar 2022 97% 149 units 99%
Home Partners of America 4
N/A 1
Various Various Various 4
23,724 units 97%
Quebec Independent Living Portfolio 10 Quebec, Canada Aug 2021 95% 2,877 units 81%
Ace Affordable Housing Portfolio 5
650 Various Dec 2021 Various 6
79,658 units 96%
Florida Affordable Housing Portfolio 44 Various Various 100% 11,157 units 98%
TOTAL RESIDENTIAL 1,079 228,218 units
NUMBER OF OWNERSHIP SQ. FT. OCCUPANCY
SEGMENT AND INVESTMENT PROPERTIES LOCATION ACQUISITION DATE INTEREST2 (IN THOUSANDS) RATE3
INDUSTRIAL
Stockton Industrial Park 1 Stockton, CA Feb 2017 100% 878 sq. ft. 100%
HS Industrial Portfolio 36 Various Apr 2017 100% 5,838 sq. ft. 97%
Fairfield Industrial Portfolio 11 Fairfield, NJ Sep 2017 100% 578 sq. ft. 99%
Southeast Industrial Portfolio 5 Various Nov 2017 100% 1,927 sq. ft. 100%
Kraft Chicago Industrial Portfolio 3 Aurora, IL Jan 2018 100% 1,693 sq. ft. 100%
Canyon Industrial Portfolio 145 Various Mar 2018 100% 20,954 sq. ft. 98%
HP Cold Storage Industrial Portfolio 6 Various May 2018 100% 2,259 sq. ft. 100%
Meridian Industrial Portfolio 106 Various Nov 2018 99% 14,014 sq. ft. 98%
Stockton Distribution Center 1 Stockton, CA Dec 2018 100% 987 sq. ft. 100%
Summit Industrial Portfolio 8 Atlanta, GA Dec 2018 100% 631 sq. ft. 95%
4500 Westport Drive 1 Harrisburg, PA Jan 2019 100% 179 sq. ft. 100%
Morgan Savannah 1 Savannah, GA Apr 2019 100% 357 sq. ft. 100%
Minneapolis Industrial Portfolio 34 Minneapolis, MN Apr 2019 100% 2,459 sq. ft. 96%
Atlanta Industrial Portfolio 61 Atlanta, GA May 2019 100% 3,779 sq. ft. 92%
Patriot Park Industrial Portfolio 2 Durham, NC Sep 2019 100% 323 sq. ft. 100%
Denali Industrial Portfolio 18 Various Sep 2019 100% 4,098 sq. ft. 100%
Jupiter 12 Industrial Portfolio 306 Various Sep 2019 100% 62,145 sq. ft. 98%
2201 Main Street 1 San Diego, CA Oct 2019 100% 260 sq. ft. N/A
Triangle Industrial Portfolio 37 Greensboro, NC Jan 2020 100% 2,783 sq. ft. 90%
Midwest Industrial Portfolio 27 Various Feb 2020 100% 5,940 sq. ft. 95%
Pancal Industrial Portfolio 12 Various Feb & Apr 2020 100% 2,109 sq. ft. 99%
Grainger Distribution Center 1 Jacksonville, FL Mar 2020 100% 297 sq. ft. 100%
Diamond Industrial 1 Pico Rivera, CA Aug 2020 100% 243 sq. ft. 100%
Inland Empire Industrial Portfolio 2 Etiwanda & Fontana, CA Sep 2020 100% 404 sq. ft. 100%
Shield Industrial Portfolio 13 Various Dec 2020 100% 2,079 sq. ft. 100%
NOTE: As of March 31, 2022. Past performance does not guarantee future results. Actual results may vary. Diversification does not assure a profit or
protect against a loss in a declining market. Please refer to the endnotes on page 34.
30 B R E I T | R E A L E S TAT E P R O P E R T Y H O L D I N G SBREIT Real Estate Property Holdings (Cont’d)
NUMBER OF OWNERSHIP SQ. FT. OCCUPANCY
SEGMENT AND INVESTMENT PROPERTIES LOCATION ACQUISITION DATE INTEREST2 (IN THOUSANDS) RATE3
INDUSTRIAL (CONT’D)
7520 Georgetown Industrial 1 Indianapolis, IN Dec 2020 100% 425 sq. ft. 100%
WC Infill Industrial Portfolio 6
19 Various Jan & Aug 2021 85% 2,927 sq. ft. N/A
Vault Industrial Portfolio 6
35 Various Jan 2021 46% 6,587 sq. ft. N/A
Chicago Infill Industrial Portfolio 7 Various Feb 2021 100% 1,058 sq. ft. 100%
Greensboro Industrial Portfolio 19 Various Apr 2021 100% 2,068 sq. ft. 95%
NW Corporate Center 3 El Paso, TX Jul 2021 100% 692 sq. ft. 100%
I-85 Southeast Industrial Portfolio 4 Various Jul & Aug 2021 100% 739 sq. ft. 100%
Alaska Industrial Portfolio 6
27 Various UK Jul & Oct 2021 22% 8,720 sq. ft. N/A
Stephanie Industrial Portfolio 2 Henderson, NV Sep 2021 100% 338 sq. ft. 100%
Capstone Industrial Portfolio 2 Brooklyn Park, MN Sep 2021 100% 219 sq. ft. 86%
Winston Industrial Portfolio 133 Various Oct 2021 Various 32,113 sq. ft. 98%
Tempe Industrial Center 1 Tempe, AZ Oct 2021 100% 175 sq. ft. 100%
Procyon Distribution Center Industrial 1 Las Vegas, NV Oct 2021 100% 122 sq. ft. 100%
Northborough Industrial Portfolio 2 Malborough, MA Oct 2021 100% 600 sq. ft. 100%
Coldplay Logistics Portfolio6 13 Various Germany Oct 2021 10% 1,153 sq. ft. N/A
Canyon 2.0 Industrial Portfolio 102 Various Nov 2021 99% 15,218 sq. ft. 98%
Tropical Sloane Las Vegas Industrial 1 Las Vegas, NV Nov 2021 100% 171 sq. ft. 100%
Explorer Industrial Portfolio 6
328 Various Nov 2021 12% 70,499 sq. ft. N/A
Carrix Ports Portfolio 7
0 Various Nov 2021 8% 0 sq. ft. N/A
Evergreen Industrial Portfolio 6
12 Various Dec 2021 10% 6,068 sq. ft. N/A
Maplewood Industrial 14 Various Dec 2021 100% 3,169 sq. ft. 99%
Meadowland Industrial Portfolio 3 Las Vegas, NV Dec 2021 100% 1,138 sq. ft. 100%
Bulldog Industrial Portfolio 7 Suwanee, GA Dec 2021 100% 512 sq. ft. 99%
SLC NW Commerce Industrial 3 Salt Lake City, UT Dec 2021 100% 529 sq. ft. 52%
Bluefin Industrial Portfolio6 70 Various Dec 2021 23% 10,922 sq. ft. N/A
73 Business Center Industrial Portfolio 1 Greensboro, NC Dec 2021 100% 218 sq. ft. 100%
Amhurst Industrial Portfolio 11 Waukegan, IL Mar 2022 100% 1,440 sq. ft. 83%
TOTAL INDUSTRIAL 1,660 305,034 sq. ft.
NUMBER OF OWNERSHIP SQ. FT. OCCUPANCY
SEGMENT AND INVESTMENT PROPERTIES LOCATION ACQUISITION DATE INTEREST2 (IN THOUSANDS) RATE3
NET LEASE
Bellagio Net Lease 1 Las Vegas, NV Nov 2019 95% 8,507 sq. ft. 100%
MGM Grand Net Lease6 1 Las Vegas, NV Feb 2020 49.9% 6,917 sq. ft. N/A
Mandalay Bay Net Lease6 1 Las Vegas, NV Feb 2020 49.9% 9,324 sq. ft. N/A
TOTAL NET LEASE 3 24,748 sq. ft.
NOTE: As of March 31, 2022. Past performance does not guarantee future results. Actual results may vary. Diversification does not assure a profit or
protect against a loss in a declining market. Please refer to the endnotes on page 34.
R E A L E S TAT E P R O P E R T Y H O L D I N G S | B R E I T 31BREIT Real Estate Property Holdings (Cont’d)
NUMBER OF OWNERSHIP SQ. FT. OCCUPANCY
SEGMENT AND INVESTMENT PROPERTIES LOCATION ACQUISITION DATE INTEREST2 (IN THOUSANDS) RATE3
DATA CENTERS
D.C. Powered Shell Warehouse Portfolio 9 Ashburn & Manassas, VA Jun & Dec 2019 90% 1,471 sq. ft. 100%
Highpoint Powered Shell Portfolio 2 Sterling, VA Jun 2021 100% 430 sq. ft. 100%
QTS Data Centers 6
53 Various Aug 2021 33.1% 9,354 sq. ft. N/A
TOTAL DATA CENTERS 64 11,255 sq. ft.
NUMBER OF OWNERSHIP OCCUPANCY
SEGMENT AND INVESTMENT PROPERTIES LOCATION ACQUISITION DATE INTEREST2 KEYS RATE3
HOSPITALITY
Hyatt Place UC Davis 1 Davis, CA Jan 2017 100% 127 keys 67%
Hyatt Place San Jose Downtown 1 San Jose, CA Jun 2017 100% 240 keys 47%
Florida Select-Service 4-Pack 4 Tampa & Orlando, FL Jul 2017 100% 476 keys 76%
Hyatt House Downtown Atlanta 1 Atlanta, GA Aug 2017 100% 150 keys 68%
Boston/Worcester Select-Service 3-Pack 3 Boston & Worcester, MA Oct 2017 100% 374 keys 64%
Henderson Select-Service 2-Pack 2 Henderson, NV May 2018 100% 228 keys 79%
Orlando Select-Service 2-Pack 2 Orlando, FL May 2018 100% 254 keys 87%
Corporex Select Service Portfolio 5 Various Aug 2018 100% 601 keys 74%
JW Marriott San Antonio Hill Country Resort 1 San Antonio, TX Aug 2018 100% 1,002 keys 54%
Hampton Inn & Suites Federal Way 1 Seattle, WA Oct 2018 100% 142 keys 67%
Staybridge Suites Reno 1 Reno, NV Nov 2018 100% 94 keys 80%
Salt Lake City Select Service 3-Pack 3 Salt Lake City, UT Nov 2018 60% 454 keys 78%
Courtyard Kona 1 Kailua-Kona, HI Mar 2019 100% 455 keys 76%
Raven Select Service Portfolio 21 Various Jun 2019 100% 2,555 keys 68%
Urban 2-Pack 1 Chicago, IL Jul 2019 100% 337 keys 39%
Hyatt Regency Atlanta 1 Atlanta, GA Sep 2019 100% 1,260 keys 49%
RHW Select Service Portfolio 9 Various Nov 2019 100% 923 keys 73%
Key West Select Service Portfolio 4 Key West, FL Oct 2021 100% 545 keys 93%
Sunbelt Select Service Portfolio 3 Various Dec 2021 100% 716 keys 64%
HGI Austin University Select Service 1 Austin, TX Dec 2021 100% 214 keys 40%
TOTAL HOSPITALITY 66 11,147 keys
NUMBER OF OWNERSHIP SQ. FT. OCCUPANCY
SEGMENT AND INVESTMENT PROPERTIES LOCATION ACQUISITION DATE INTEREST2 (IN THOUSANDS) RATE3
SELF STORAGE
East Coast Storage Portfolio 21 Various Aug 2019 98% 1,446 sq. ft. 92%
Phoenix Storage 2-Pack 2 Phoenix, AZ Mar 2020 98% 111 sq. ft. 93%
Cactus Storage Portfolio 18 Various Sep & Oct 2020 98% 1,109 sq. ft. 89%
NOTE: As of March 31, 2022. Past performance does not guarantee future results. Actual results may vary. Diversification does not assure a profit or
protect against a loss in a declining market. Please refer to the endnotes on page 34.
32 B R E I T | R E A L E S TAT E P R O P E R T Y H O L D I N G SYou can also read