Building a Resilient Energy Future: How the Gas System Contributes to US Energy System Resilience - American Gas Foundation
←
→
Page content transcription
If your browser does not render page correctly, please read the page content below

January 2021

Building a Resilient
Energy Future:
How the Gas System Contributes to
US Energy System Resilience

   An American Gas Foundation Study Prepared by:
Background and Methodology

This study was conducted to investigate the resilience of the US gas system and the ways in
which the gas system contributes to the overall resilience of the US energy system. This work
was directed to ask and answer four key questions:
   •   What are the characteristics of the US gas system that contribute to its resilience?
   •   How do those resilience characteristics allow the US gas system to contribute to the
       overall resilience of the US energy system?
   •   How can the US gas system be leveraged more effectively to strengthen the US energy
       system?
   •   What are the policy and regulatory changes that may help ensure that gas infrastructure
       can be maintained and developed to continue to support energy system resilience?
These questions were explored through a qualitative assessment conducted by Guidehouse,
including discussions and interviews with many energy industry subject matter experts. Case
studies and examples of resilience were identified as a part of these discussions. Guidehouse
used these studies and examples to develop a framework for considering the resilience of the
US gas system and to identify barriers and opportunities related to the gas system’s role in
supporting the resilience of the US energy system. The findings presented in this work identify
issues that merit consideration and further exploration when developing future energy policy and
regulation to ensure a resilient, reliable, and clean future energy system in all regions and
jurisdictions.

Disclaimers

This report was prepared for the American Gas Foundation, with the assistance of its
contractors, to be a source of independent analysis. Neither the American Gas Foundation, its
contractors, nor any person acting on their behalf:
   •   Makes any warranty or representation, express or implied with respect to the accuracy,
       completeness, or usefulness of the information contained in this report, or that the use of
       any information, apparatus, method, or process disclosed in this report may not infringe
       privately owned rights,
   •   Assumes any liability, with respect to the use of, damages resulting from the use of, any
       information, method, or process disclosed in this report,
   •   Recommends or endorses any of the conclusions, methods or processes analyzed
       herein.
References to work practices, products or vendors do not imply an opinion or endorsement of
the American Gas Foundation or its contractors. Use of this publication is voluntary and should
be taken after an independent review of the applicable facts and circumstances.
Copyright © American Gas Foundation, 2020.

American Gas Foundation

Founded in 1989, the American Gas Foundation (AGF) is a 501(c)(3) organization focused on
being an independent source of information research and programs on energy and
environmental issues that affect public policy, with a particular emphasis on natural gas. When it
comes to issues that impact public policy on energy, the AGF is committed to making sure the
right questions are being asked and answered. With oversight from its board of trustees, the
foundation funds independent, critical research that can be used by policy experts, government
officials, the media and others to help formulate fact-based energy policies that will serve this
country well in the future.

Guidehouse

Guidehouse is a leading global provider of consulting services to the public and commercial
markets with broad capabilities in management, technology, and risk consulting. We help clients
address their toughest challenges with a focus on markets and clients facing transformational
change, technology-driven innovation and significant regulatory pressure. Across a range of
advisory, consulting, outsourcing, and technology/analytics services, we help clients create
scalable, innovative solutions that prepare them for future growth and success. Headquartered
in Washington DC, the company has more than 7,000 professionals in more than 50 locations.
Guidehouse is led by seasoned professionals with proven and diverse expertise in traditional
and emerging technologies, markets and agenda-setting issues driving national and global
economies. For more information, please visit: www.guidehouse.com
Building a Resilient Energy Future
How the Gas System Contributes to US Energy System Resilience

Table of Contents
EXECUTIVE SUMMARY ................................................................................................ 1
1. Introduction ............................................................................................................... 7
       1.1 A Primer on the Energy System ..................................................................................... 7
       1.2 A Primer on Resilience .................................................................................................. 9
       1.3 An Orientation to this Report ........................................................................................ 12
2. The Resilience of the Gas System ......................................................................... 13
       2.1 Fundamental Resilience Characteristics of the Gas System ....................................... 13
       2.2 Inherent Characteristics of Gas Resilience .................................................................. 14
       2.3 Physical Characteristics of Gas System Resilience ..................................................... 17
       2.4 Operational Characteristics of Gas System Resilience................................................ 20
       2.5 Resilience Limitations .................................................................................................. 23
3. Proving It: Resilience in Action.............................................................................. 24
4. Current Regulatory, Policy, and Market Structures ............................................. 46
       4.1 The Difference Between Resilience and Reliability Investments ................................. 46
       4.2 Historical Context of Gas System Development .......................................................... 47
       4.3 Natural Gas in Electric Power Generation ................................................................... 49
       4.4 The Regulatory Context ............................................................................................... 52
       4.5 Impacts on Consumers ................................................................................................ 56
5. Ensuring A Resilient Future ................................................................................... 59
       5.1 Lessons from Others .................................................................................................... 59
       5.2 Key Opportunities ........................................................................................................ 62
6. Conclusions ............................................................................................................. 64
       6.1 Implications for Policymakers and Regulators ............................................................. 64
       6.2 A Call to Action ............................................................................................................ 65
Appendix A. The Natural Gas Value Chain ............................................................. A-1
Appendix B. The Current State of US Gas Consumption and Production ........... B-1

                                                                    iii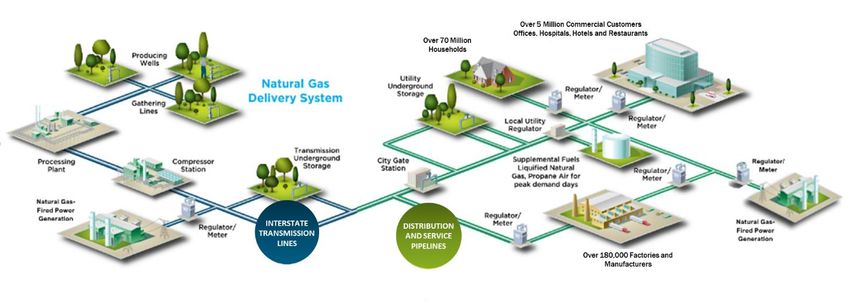
Building a Resilient Energy Future
How the Gas System Contributes to US Energy System Resilience

List of Tables
Table 1-1. Definition of the Phases of Resilience ......................................................................10
Table 2-1. Key Questions Used to Identify Resilience Characteristics ......................................13
Table 2-2. Inherent Resilience Across the Phases of Resilience ..............................................14
Table 2-3. Physical Resilience Across the Phases of Resilience ..............................................17
Table 2-4. Operational Resilience Across the Phases of Resilience .........................................21
Table 3-1. CenterPoint Energy Actions to Maintain Gas System Viability During the 2019 Polar
Vortex.........................................................................................................................................26
Table 3-2. Summary of Resilience Characteristics Used by Consumers Energy ......................31
Table 3-3. NJNG Load Sendout: August 3, 2020 through August 9, 2020 ................................39
Table 3-4. Home Natural Gas Generator Assumptions .............................................................40

                                                                        iv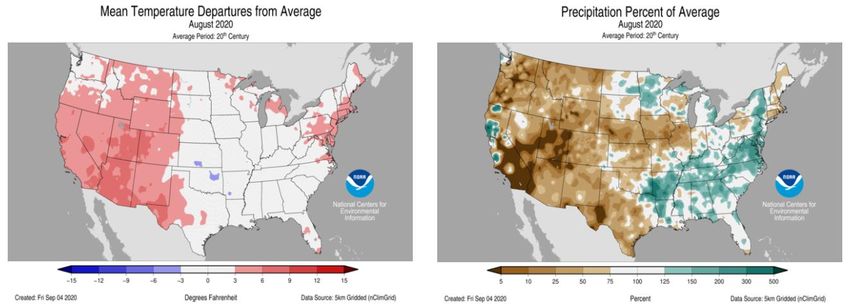
Building a Resilient Energy Future
How the Gas System Contributes to US Energy System Resilience

List of Figures
Figure 1-1. Interdependencies Between the Gas and Electric Systems ......................................7
Figure 1-2. Overview of the Gas System .....................................................................................8
Figure 1-3. Comparison of Resilience and Reliability ................................................................10
Figure 1-4. The Energy System Resilience Curve .....................................................................10
Figure 1-5. 1980-2018 Year-to-Date US Billion-Dollar Disaster Event Frequency ....................11
Figure 2-1. Resilience Characteristics of the Gas System .........................................................14
Figure 2-2. Linepack and Compressibility of Gas ......................................................................15
Figure 2-3. US Shale Plays and Formations ..............................................................................16
Figure 2-4. Major North American Natural Gas Pipelines ..........................................................23
Figure 3-1. The Science Behind the Polar Vortex ......................................................................25
Figure 3-2. Gas Supply by Source, CenterPoint Energy, Minneapolis, Minnesota, January 29-
30, 2020 .....................................................................................................................................26
Figure 3-3. Energy Distribution by Northern Illinois Utility ..........................................................29
Figure 3-4. Consumers Energy System Supply, Demand, and Reserve Capacity January 30-
31, 2019 .....................................................................................................................................32
Figure 3-5. NW Natural Service Territory ...................................................................................34
Figure 3-6. NW Natural Peak Day Firm Resources, as of Nov 1, 2013 .....................................35
Figure 3-7. NW Natural Resource Utilization During Cold Weather Event, ...............................36
Figure 3-8. Service Territories for Jersey Central Power & Light Company and New Jersey
Natural Gas Company ...............................................................................................................38
Figure 3-9. NJNG Comparison of August Actual Sendouts (Firm) ............................................40
Figure 3-10. August 2020 Mean Temperature and Precipitation, Departure from Average.......41
Figure 3-11. CAISO Supply Trend to Meet Electric Demand, July 12, 2020 .............................42
Figure 3-12. CAISO Supply Trend to Meet Electric Demand, August 17, 2020.........................43
Figure 3-13. Hourly Supply and Demand on the SoCalGas System .........................................44
Figure 4-1. Comparison of Resilience and Reliability Investments ............................................46
Figure 4-2. Incremental US Natural Gas Pipeline Additions ......................................................47
Figure 4-3. Aggregate Daily Natural Gas Load Profiles, for Residential, Small Commercial, and
Industrial Customers ..................................................................................................................48
Figure 4-4. US Gas-Fired Electric Power Generation ................................................................49
Figure 4-5. Daily Natural Gas Load Profiles for Gas-Fired Electric Power Generation..............50
Figure 4-6. Daily Natural Gas Load Profile for Intermittent Gas-Fired Plants ............................51
Figure 4-7. Comparison of Electric Power Generation During the January 2018 Bomb Cyclone
...................................................................................................................................................54

Figure A-1. US Dry Shale Gas Production, 2010-2020 ........................................................... A-1
Figure A-2. Working Gas in Underground Storage, Lower 48 States ...................................... A-2
Figure B-1. US Primary Energy Consumption by Source ........................................................ B-1
Figure B-2. Natural Gas Deliveries and Consumption by Sector ............................................. B-2
Figure B-3. Net Electric Power Generation by Source, 2000-2019 ......................................... B-3
Figure B-4. Natural Gas Share of Total Residential Energy Consumption, 2015 .................... B-4
Figure B-5. US Natural Gas Consumption, Dry Production, and Net Imports, 2000-2019 ...... B-5
Figure B-6. Low Carbon Gas Production Through Anaerobic Digestion ................................. B-7
Figure B-7. Hydrogen Production Technologies ...................................................................... B-7

                                                                          v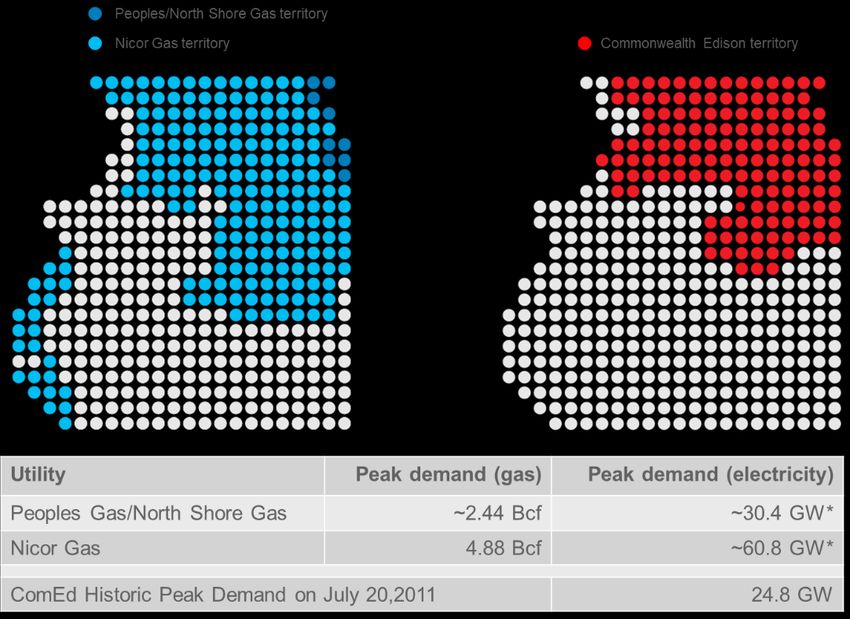
Building a Resilient Energy Future
How the Gas System Contributes to US Energy System Resilience

Abbreviations
 Abbreviation                Definition
 AGF                         American Gas Foundation
 AWIA                        America’s Water Infrastructure Act
 Bcf                         Billion Cubic Feet
 Btu                         British Thermal Units
 C&I                         Commercial and Industrial
 CAGR                        Compound Annual Growth Rate
 CAISO                       California Independent System Operator
 CHP                         Combined Heat and Power
 CIP                         Critical Infrastructure Protection
 CNG                         Compressed Natural Gas
 DSM                         Demand Side Management
 Dth                         Dekatherm
 EIA                         US Energy Information Administration
 ESR                         Energy Storage Resources
 EV                          Electric Vehicle
 FERC                        Federal Energy Regulatory Commission
 GHG                         Greenhouse Gas
 HVAC                        Heating, Ventilation, And Air Conditioning
 ISO                         Independent Service Operator
 ISO-NE                      Iso New England Inc.
 LCOE                        Levelized Cost of Electricity
 LDC                         Local Distribution Company
 LNG                         Liquified Natural Gas
 KWh                         Kilowatt-Hour
 MMcf                        Million Cubic Feet
 MMcfd                       Million Cubic Feet Per Day
 MMBtu                       Million British Thermal Units of Natural Gas
 MW                          Megawatt
 MWh                         Megawatt-Hour
 NASA                        National Aeronautics and Space Administration
 NERC                        North American Electric Reliability Corporation
 NGV                         Natural Gas Vehicle
 NOAA                        National Oceanic and Atmospheric Administration
 NJNG                        New Jersey Natural Gas
 NYISO                       New York Independent System Operator
 OBA                         Operational Balancing Agreement
 PGE                         Portland General Electric
 psi                         Pounds Per Square Inch
 PSPS                        Public Safety Power Shutoff
 PUC                         Public Utility Commission
 PV                          Photovoltaic
 RNG                         Renewable Natural Gas
 RTO                         Regional Transmission Organization
 SCADA                       Supervisory Control and Data Acquisition
 T&D                         Transmission and Distribution
 US                          United States
 UTMB                        University of Texas Medical Branch

                                                     vi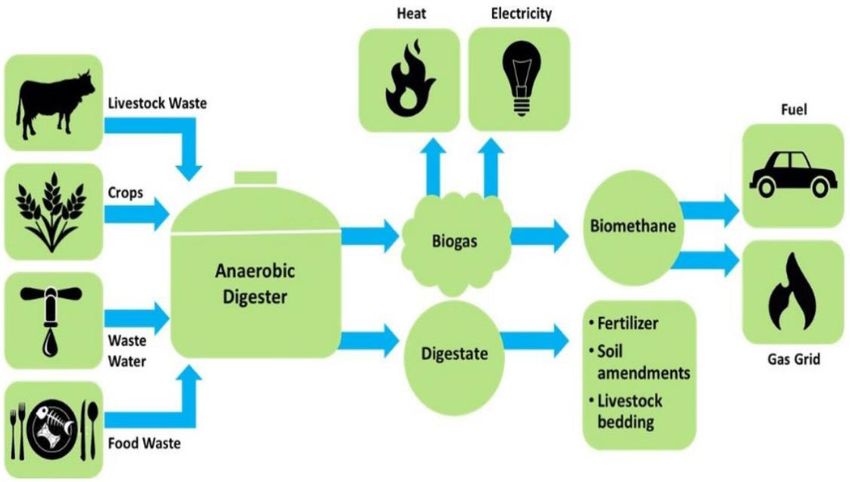
Building a Resilient Energy Future
How the Gas System Contributes to US Energy System Resilience

EXECUTIVE SUMMARY
A resilient energy system is essential to the operation of nearly every critical function and sector
of the US economy as well as the communities that depend upon its services. Disruptions to the
US energy system create widespread economic and social impacts, including losses in
productivity, health and safety issues, and—in the most extreme cases—loss of life. As utilities,
system operators, regulators, and policymakers deliberate the design and structure of the future
energy infrastructure, they must consider the resilience of the entire energy system. As the
transformation of the energy system accelerates, it is important for stakeholders to understand
the increasing interdependence of gas and electric systems and their role in creating a more
resilient future.

A Primer on the Energy System

An energy system is defined as the full range of components related to the production,
conversion, delivery, and use of energy. Energy in the US can take many forms; this report
focuses on the natural gas system, herein referred to as the gas system, and its
interdependencies with the electric system (Figure 1).

             Figure 1. Interdependencies Between the Gas and Electric Systems

Source: Guidehouse

                                                     1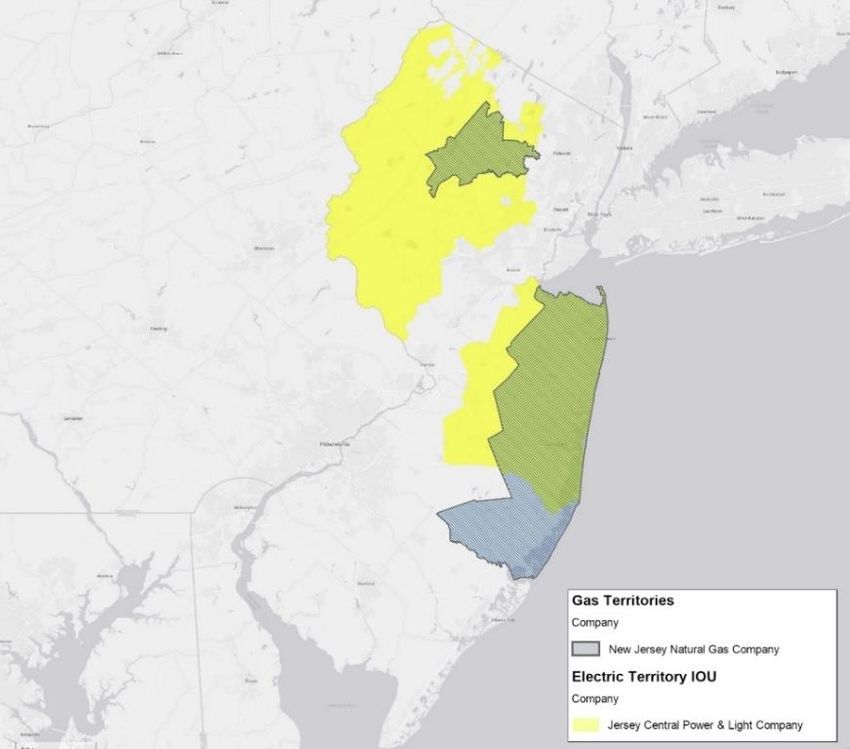
Building a Resilient Energy Future
How the Gas System Contributes to US Energy System Resilience

What Is Resilience?

Resilience is defined as a system’s ability to prevent, withstand, adapt to, and quickly recover
from system damage or operational disruption. Resilience is defined in relation to a high-impact,
low-likelihood events. The most common examples of these events are extreme weather events
(which go beyond standard hot days or snowstorms) of a size and scale to cause significant
operational disruption, system damage, and devastating societal impacts. Recent resilience
events that affected the US energy system include the 2020 California heat waves, Hurricane
Isaias, and the 2019 Polar Vortex.

                Resilience and reliability are often referenced together, but they reflect critical
                differences in system design and operation. Resilience is defined as a system’s
                ability to prevent, withstand, adapt to, and quickly recover from a high-impact,
                low-likelihood event such as a major disruption in a transmission pipeline. In
                comparison, reliability refers to a systems’ ability to maintain energy delivery
                under standard operating conditions, such as the standard fluctuations in
                demand and supply.

The increasing frequency and severity of climatic events amplifies the need to maintain the
resilience of the US energy system. System resilience is gained through diversity and
redundancy. The resilience of the US energy system is increased through evolving and holistic
management of the gas and electric systems, valuing each of their unique characteristics. To
ensure resilience, the energy system needs pipeline delivery infrastructure and storage
capabilities meeting both short- and long-duration needs.

The nation’s gas system is a critical resource for addressing resilience threats to the overall
energy system. This report examines how the characteristics of the US natural gas system
enable energy reliance today and opportunities to effectively use the gas system to achieve
future energy resilience.

Resilience Characteristics of the Gas System

The gas system supports the overall resilience of the energy system through its inherent,
physical, and operational capabilities (Figure 2) that enable it to meet the volatile demand
profiles resulting from resilience events.

                                                     2
Building a Resilient Energy Future
How the Gas System Contributes to US Energy System Resilience

                     Figure 2. Resilience Characteristics of the Gas System

Source: Guidehouse

Resilience in Action

Large, catastrophic failures of the energy system have been few and far between—the energy
system has performed well, overcoming periods of high stress that have threatened its
resilience. These high stress events are becoming more frequent due to the increase in the
frequency and severity of extreme weather events associated with climate change. To
successfully build for the future and invest in the right set of resilience solutions, it is important
for stakeholders to understand how the energy system has performed under recent resilience
events.

Recent climate events have revealed the US energy system’s potential vulnerabilities. However,
the multitude and diversity of resilience assets that already exist as part of the energy system
have made the difference—facilitating energy flows to critical services and customers. As the
following case studies illustrate, the resilience assets that are part of the gas system have
supported the overall integrity of the energy system during these high stress periods.

                  In 2019, the Midwest experienced record-breaking cold temperatures, which
                  led to increased demand on the energy system to meet heating needs.

    2019              •    CenterPoint Energy curtailed gas service to interruptible customers
                           and pulled gas from every possible storage resource to maintain
   Polar                   service to homes and businesses. In one day, CenterPoint delivered
   Vortex                  almost 50% more than a standard January day.
                      •    On January 30, 2019, Peoples Gas, North Shore Gas, and Nicor Gas
                           together delivered gas in an amount equivalent to more than 3.5 times

                                                     3
Building a Resilient Energy Future
How the Gas System Contributes to US Energy System Resilience
the amount of energy that ComEd, the electric utility serving an
overlapping territory has ever delivered in a single day.
• The Consumers Energy’s Ray Compressor Station fire on January 30
took a primary storage supply resource offline. Consumers leveraged
several gas resilience characteristics (linepack, backup storage, and a
highly networked gas system) to ensure that no critical, priority, or
residential customer lost service.
During early February 2014, a polar vortex brought extreme cold
temperatures, snowfall, and high winds to Oregon. On February 6, during the
2014 system peak, NW Natural set a company record for natural gas sendouts,
Polar which still stands today. Nearly 50% of this peak demand was met by natural
Vortex gas storage capacity. In combination with diligent planning and dedicated
employees, this case study highlights the critical role that natural gas storage
plays in meeting demand during extreme weather events.
On August 4, 2020, Hurricane Isaias made landfall in North Carolina. It
caused significant destruction as it moved north, triggering electric outages
that affected more than 1 million New Jersey homes and businesses. Many
customers experiencing electric outages turned on their natural gas backup
2020 generators, resulting in a massive increase in demand for New Jersey Natural
Hurricane Gas (NJNG). In 24 hours, NJNG experienced a 60% increase in daily demand
on its gas system—the daily demand for this one day was higher than any
Isaias other August day for the previous 10 years. Because of the built-in storage
capacity (compressibility and on-system storage) and flexibility of the gas
system, NJNG was able to ramp up service to customers with disrupted
electricity supply.
In August 2020, California was in the middle of its hottest August on record,1 a
severe drought, and its worst wildfire season in modern history. Concurrent to
2020 increased demand on the electric system driven by increased cooling loads,
California also experienced a decrease in renewable output (due to smoke
Heat, from the fires)2 and lower imports than had been anticipated by electric supply
Drought, planners. To meet increased electric demand, system operators turned to
and gas-fired generation facilities. During the week of August 11, all of SoCalGas’
Wildfires system storage assets were employed to fill the gap between abnormally high
electric demand and low renewable energy generation experienced in
Southern California.
In all of these case studies, the gas system provided significant support to the energy system in
maintaining resilience and ensuring that energy service was maintained to customers. To
understand the gas system’s contribution to resilience, it is important to differentiate between
the pipeline infrastructure system and the natural gas molecules that flow through it. The gas
pipeline system is defined as a series of physical assets that transport energy molecules from
the source of production to end users, including residential, commercial, and industrial
customers who use gas in their buildings and processes, and electric generators who use gas to
1 NOAA. National Climate Report. August 2020.
2 EIA. Smoke from California Wildfires Decreases Solar Generation in CAISO. September 30, 2020.
4Building a Resilient Energy Future
How the Gas System Contributes to US Energy System Resilience
make electricity. Today, the gas system is used to transport mostly geologic natural gas, but it
can be leveraged to transport low-carbon gases such as renewable natural gas (RNG) and
potentially hydrogen in the future as utilities move to decarbonize the energy system.
The Growing Resilience Challenge
Driven by changes in the cost and availability of new technologies and increasing political and
social pressure to decarbonize, our energy system is undergoing a transformation. This
transformation exposes an issue of energy system resilience related to the interaction of the gas
and electric systems.
As the percentage of electricity generation from intermittent renewable sources
increases, the volume of natural gas used for electric power generation may
decline; however, in responding to resilience events the necessity of the services
provided by gas-fired electric generators may increase. As current compensation
models for the gas system serving the power generation sector are tied to the
volume of gas delivered to the facility, there becomes an increasing disconnect
between the value of the services provided and associated remuneration for said
services.
To further highlight the need for energy system resilience as part of the current transformation, it
is worth considering a recent review of the root cause of the California Independent System
Operator (CAISO) electric outages during the August 2020 heatwave. One of the three factors
identified was: “In transitioning to a reliable, clean and affordable resource mix, resource
planning targets have not kept pace to lead to sufficient resources that can be relied upon to
meet [electric] demand in the early evening hours. This makes balancing demand and supply
more challenging. These challenges were amplified by the extreme heat storm.”3
The current model for maintaining the resilience of our energy system was built to support a
legacy view of how the energy system operates. As an example, natural gas infrastructure
replacement and modernization programs were designed to enhance reliability and safety. As
noted in this report they have also contributed to resilience. As the transition to the future energy
system accelerates, it is important to understand how these programs complement future
energy state resilience needs. The manner in which this energy system is regulated and
managed is becoming outdated, and an update is necessary to maintain resilience of the
evolving future energy system.
Ensuring a Resilient Future Energy System
The increasing frequency and intensity of climatic events combined with the transformation of
the energy system to one increasingly powered by intermittent renewable sources establish the
need for a new consideration of the resilience of the energy system. Utilities, system operators,
regulators, and policymakers need to recognize that resilience will be achieved through a
diverse set of integrated assets—for the foreseeable future, policies need to focus on optimizing
the characteristics of both the gas and electric systems.
3 CAISO. Preliminary Root Cause Analysis: Mid-August 2020 Heat Storm. 2020.
5Building a Resilient Energy Future
How the Gas System Contributes to US Energy System Resilience
Achieving this is easier said than done. It will require a realignment of the valuation and cost
recovery mechanisms that currently define the development of the US energy system:
• Energy system resilience must be defined as a measurable and observable set of
metrics, similar to how reliability is considered.
• Resilience solutions must be developed considering all possible energy options and
across utility jurisdictions, requiring electric, gas, and dual-fuel utilities to work together
to determine optimal solutions.
• Methodologies need to be built to value resilience, such that it can be integrated into a
standard cost-benefit analysis. Value should consider the avoided direct and indirect
costs to the service provider, customers, and society.
The resilience of the current energy system is largely dependent on the gas system’s ability to
quickly respond to events and use its extensive long-duration storage resources to meet peak
and seasonal demand. Ensuring future energy system resilience will require a careful
assessment and recognition of the contributions provided by the gas system. Utilities, system
operators, regulators, and policymakers need new frameworks to consider resilience impacts to
ensure that resilience is not overlooked or jeopardized in the pursuit to achieve decarbonization
goals.
6Building a Resilient Energy Future
How the Gas System Contributes to US Energy System Resilience
1. Introduction
A resilient energy system is essential to the operation of nearly every critical function and sector
of the US economy—and the need for energy system resilience is only increasing as
emergency services, communications, transportation, banking, healthcare, water supply, and
other critical systems become more interconnected than ever. Disruptions to the US energy
system can have widespread economic and social impacts, including losses in economic
productivity, health and safety issues, and—in the most extreme cases—loss of life.
This report examines the resilience of the current gas system with a focus on the part of the
system that is under the operational control of the gas local distribution company (LDC). It also
examines how the gas system contributes to the resilience of the overall energy system. The
work was directed to ask and answer four key questions:
1. What are the characteristics of the US gas system that contribute to its resilience?
2. How do those resilience characteristics allow the US gas system to contribute to the overall
resilience of the US energy system?
3. How can the US gas system be leveraged more effectively to strengthen the US energy
system?
4. What are the policy and regulatory changes needed to ensure that gas infrastructure can be
maintained and developed to continue to support energy system resilience?
1.1 A Primer on the Energy System
An energy system is defined as the full range of components related to the production,
conversion, delivery, and use of energy. Energy takes many forms; this report focuses on the
natural gas system, herein referred to as the gas system, and its interdependencies with the
electric system (Figure 1-1).
Figure 1-1. Interdependencies Between the Gas and Electric Systems
Source: Guidehouse
7Building a Resilient Energy Future
How the Gas System Contributes to US Energy System Resilience
The gas system is the series of assets that transport energy molecules from the source of
production to the site of consumption. The customers served by this system include residential,
commercial, and industrial buildings and processes; gas-fired electric generation facilities;
transportation fuel providers; and natural gas exporters.
Today, the gas system is used to transport mostly geologic natural gas and small amounts of
renewable natural gas (RNG). In the future, the gas system can be leveraged, with only small
upgrades, to transport a low carbon fuel supply including RNG, hydrogen, and synthetic
methane.
Figure 1-2. Overview of the Gas System
Source: American Gas Association
The gas system can generally be divided into three sections (Appendix A presents further
details):
1. Production and Processing: Encompasses the process of gathering the gas and
treating it to remove impurities.
• Wells extract natural gas primarily from geologic shale formations.
• Gathering pipelines transport gas to processing facilities where impurities are
removed.
• Compressors move the gas through midstream pipelines to the connection with
interstate transmission pipelines.
2. Transmission: Includes the network of high-pressure transmission lines that transport
gas from supply basins to market demand centers and, in some cases, across local gas
LDC systems.
• Compressor stations are located approximately every 50 to 60 miles along long-
haul transmission pipelines and within gas systems to regulate pressure and
keep gas moving.
• Storage assets connected to the transmission system (defined as off-system
storage) exist along these transmission pipelines enabling operators to adjust
flow to meet daily and seasonal demand requirements. Storage assets are either
underground (i.e., depleted gas reservoirs, aquifers, or salt caverns) or
aboveground (where gas is stored as LNG or CNG).
8Building a Resilient Energy Future
How the Gas System Contributes to US Energy System Resilience
3. Distribution: Under the operational control of the LDC, the gas distribution system is
primarily comprised of regulator stations, gas pipeline mainlines, and gas pipeline
service lines that collectively reduce pressure and move gas from the transmission
system to customers.
• In many cases, gas passes through a city-gate where custody is transferred from
the interstate transmission system to the LDC. At this point, gas volumes are
measured, typically odorized, and pressure is reduced.
• LDCs may have LNG, CNG, or underground storage assets on the distribution
system (defined as on-system storage), allowing the LDC to maintain reliability
and meet short-term demand increases.
1.2 A Primer on Resilience
Resilience is defined as a system’s ability to prevent, withstand, adapt to, and quickly recover
from system damage or operational disruption. The term is defined in relation to a high-impact,
low-likelihood event. The most common examples of these events are extreme weather events
(which go beyond standard hot days or snowstorms) of a size and scale to cause significant
operation disruption, system damage, and devastating human health impacts. Common threats
that test the durability of the energy system include extreme weather events (e.g., hurricanes,
wildfires, and extreme heat/cold), cyberattacks (e.g., malware and cyber intrusions), and
accidents.
Recent examples of resilience events that affected the US energy system include the 2020
California heat waves, Hurricane Isaias, and the 2019 Polar Vortex; each of which are explored
in greater detail in Section 3. Other recent resilience events that have exposed the value of the
gas system in maintaining energy system delivery include the 2017 Bomb Cyclone,4 the 2017
Californian wildfires and landslides, Hurricane Irma, and Hurricane Harvey.5
Resilience and reliability are often referenced in tandem, but there is a critical difference
between the terms and their impact on the design and operation of energy systems. Reliability is
defined in relation to a low-impact, high-likelihood event. The US energy system manages
reliability daily—in the standard fluctuations in energy supply and demand. Figure 1-3 illustrates
resilience and reliability events, along with typical energy system responses and associated
outcomes.
4 The Natural Gas Council; Prepared by RBN Energy. 2018. Weather Resilience in the Natural Gas Industry: The
2017-18 Test and Results.
5 ICF. 2018. Case Studies of Natural Gas Sector Resilience Following Four Climate-Related Disasters in 2017.
9Building a Resilient Energy Future
How the Gas System Contributes to US Energy System Resilience
Figure 1-3. Comparison of Resilience and Reliability
Source: Guidehouse
One way to conceptualize a resilience event is to separate it into distinct phases, where each
phase is defined by a time period in relation to the event’s onset. Figure 1-4. illustrates this
approach with a resilience curve. Table 1-1Table 1-1. defines the four phases of this curve:
preparation, withstanding, recovery, and adaptation.
The resilience curve provides a framework for understanding how an energy system’s resilience
can be strengthened. It is used in Section 2 to classify the resilience characteristics of the gas
system.
Figure 1-4. The Energy System Resilience Curve
Source: Guidehouse
Table 1-1. Definition of the Phases of Resilience
Phase Resilience Characteristics Timeframe
1. Preparation The ability to prepare for and prevent initial Leading up to the disruption event
system disruption
10Building a Resilient Energy Future
How the Gas System Contributes to US Energy System Resilience
Phase Resilience Characteristics Timeframe
2. Withstanding The ability to withstand, mitigate, and During the disruption event
manage system disruption
3. Recovery The ability to quickly recover normal Following the end of the
operations and repair system damage disruption, until system functions
are fully restored
4. Adaptation The ability to adapt and take action to Throughout, but especially during
strengthen the energy system in face of and following the recovery phase
future disruption events
Source: Guidehouse
1.2.1 The Increasing Importance of Resilience
The increased frequency and severity of extreme weather events increasingly put the US
energy system at risk. Over the last 50 years, much of the US has experienced increasingly
extreme weather including prolonged periods of excessively high temperatures, heavy
downpours, flooding, droughts, and severe storm activity.6
In the last decade, the US has experienced historic numbers of inflation-adjusted billion-dollar
disasters. From 2016-2018 there were 15 billion-dollar disasters per year, up from an average of
6.2 billion-dollar disasters per year since 1980.7 Figure 1-5. illustrates this trend and shows the
cumulative inflation-adjusted billion-dollar disasters on an annual basis since 1980.
Figure 1-5. 1980-2018 Year-to-Date US Billion-Dollar Disaster Event Frequency
(CPI-Adjusted, Events Statistics are Added According to the End Date)
Source: NOAA, 2018’s Billion Dollar-Disasters in Context
6 NOAA. 2014. Fourth National Climate Assessment.
7 NOAA. 2019. 2018’s Billion Dollar Disasters in Context.
11Building a Resilient Energy Future
How the Gas System Contributes to US Energy System Resilience
To further highlight the importance of placing focus on the resilience of the energy system,
consider California in August 2020. California was in the middle of its hottest August (record
warmest in 126 years),8 a severe drought, and its worst wildfire season in modern history.
These weather events resulted in increased demand on the electric system, driven by increased
cooling load. Concurrently, the state was experiencing a decrease in the anticipated electricity
supply from hydroelectricity imports and solar electric generation due to smoke from the
wildfires.9 The coincidence of these events resulted in a significant gap between electricity
demand and supply on the California system that led to rolling blackouts on August 14 and 15.10
As explored in Case Study 3, in Section 3, because the gas system filled a considerable portion
of the gap between abnormally high electric demand and low renewable energy generation,
Southern California avoided catastrophic failure.
The increasing frequency and severity of climate events amplify the need to maintain and
strengthen the resilience of the US energy system. The energy system needs redundancy and
storage capabilities to respond to dramatic shifts in supply and demand quickly.
1.3 An Orientation to this Report
The remaining content in this report is separated into five major sections.
• Section 2 The Resilience of the Gas System describes the various inherent, physical,
and operational characteristics of the gas system that contribute to the resilience of the
US energy system.
• Section 3 Proving It: Resilience in Action details five case studies that demonstrate how
gas distribution companies across the country have demonstrated gas system resilience
through real-world examples.
• Section 4 Current Regulatory, Policy, and Market Structure summarizes how current
regulatory, policy, and market structures create challenges for building gas resilience
assets.
• Section 5 Ensuring A Resilient Future explores how decarbonization-driven changes to
the electric system may present challenges for future resilience and lessons learned
from other economic sectors.
• Section 6 Conclusions presents a call to action for how the findings in this report can be
used and their implications for policymakers and regulators.
8 NOAA. National Climate Report – August 2020. https://www.ncdc.noaa.gov/sotc/national/202008
9 EIA. Smoke from California Wildfires Decreases Solar Generation in CAISO. September 30, 2020.
https://www.eia.gov/todayinenergy/detail.php?id=45336
10 California Independent System Operator. 2020. Preliminary Root Cause Analysis.
12Building a Resilient Energy Future
How the Gas System Contributes to US Energy System Resilience
2. The Resilience of the Gas System
This section explores the fundamental resilience characteristics of the gas value chain and
describes how it provides resilience services to customers. These characteristics are detailed
further in Section 3 in case studies that demonstrate gas system resilience through real-world
examples.
2.1 Fundamental Resilience Characteristics of the Gas System
Guidehouse examines the fundamental inherent, physical, and operational characteristics of the
gas system in relation to their contribution along the resilience curve phases, i.e. how they help
the gas system prepare for, withstand, recover from, and adapt to a resilience event. Table 2-1
outlines the key questions considered in evaluating these characteristics within the gas value
chain.
Table 2-1. Key Questions Used to Identify Resilience Characteristics
Resilience Phase Key Identifying Questions
1. Preparation • Does it help the system prepare for or prevent threats?
• Does it reduce the physical exposure of system infrastructure to the threat?
2. Withstanding • Does it help minimize system impacts or sensitivity to potential disruptions?
• Does it help prevent the occurrence of cascading failures?
• Does it help the system maintain functioning if a disruption occurs?
3. Recovery • Does it assist in restoring or repairing lost functionality?
4. Adaptation • Does it help the system adjust to changing climate or operating conditions?
• Does it facilitate learning and resilience investments to prevent future threats?
Source: Guidehouse
Gas system characteristics that contribute to energy system resilience are highlighted in Figure
2-1. they are also discussed in greater detail throughout this section.
13Building a Resilient Energy Future
How the Gas System Contributes to US Energy System Resilience
Figure 2-1. Resilience Characteristics of the Gas System
Source: Guidehouse
2.2 Inherent Characteristics of Gas Resilience
As a molecular form of energy storage, natural gas molecules have several inherent
characteristics that contribute to the resilience of the gas system. Chief among these
characteristics is its compressibility, which allows additional volumes of gas to be packed into
the pipeline or under- and above-ground storage. Natural gas supply is also abundant and
geographically diverse, allowing it to meet current energy needs even in the event of a supply
chain disruption. The inherent characteristics also hold true for low carbon forms of gas supply
which may replace natural gas in the future gas system. Table 2-2 summarizes the inherent
characteristics of gas resilience, which are also discussed further in this section.
Table 2-2. Inherent Resilience Across the Phases of Resilience
Resilience Phases
Characteristic Preparation Withstanding Recovery Adaptation
Compressibility Buffers against
Storage Reduces sensitivity to disruptions cascading
Linepack failures
Low carbon
Maintains production in the event of
Abundance and options for a
a regionally isolated supply-side
Diversity of Supply future energy
disruption
system
Source: Guidehouse
14Building a Resilient Energy Future
How the Gas System Contributes to US Energy System Resilience
2.2.1 Compressibility
Natural gas is made up of inherently stable and compressible molecules, making it a desirable
energy storage carrier and pipeline system buffer.
• Storage – Long-duration gas storage is frequently used to meet seasonal demand
patterns and can be used as a complement to the electric system in meeting demand
during low-likelihood, high-impact resilience events. Natural gas can be compressed and
stored underground in geological formations (e.g., in depleted gas reservoirs, aquifers,
or salt caverns) or aboveground in tanks (as LNG or CNG). As LNG, the volume of
natural gas is about 600 times smaller than its gaseous form at atmospheric pressure;
whereas, as CNG, it is 100 times smaller.
• Linepack – Excess natural gas molecules, i.e. more than what would be needed to meet
customer demand can be compressed and stored within pipelines, acting as a buffer to
minimize the impact of short-term hourly supply and demand fluctuations on the gas
system (Figure 2-2).11 Gas system operators, including LDCs, can control the amount of
linepack in the pipes, allowing them to meet rapid, intraday changes in demand even if
upstream supply is insufficient.
Figure 2-2. Linepack and Compressibility of Gas
Source: Guidehouse
Figure 2-2 provides a clear example of how linepack and storage can be used in tandem to
prevent and mitigate the effects of a major gas system disruption. These characteristics are
different from the electricity grid where disruptions can immediately impact all connected gas
systems and increase the risk of cascading failures. Electric supply and demand must be
balanced across the electric system near instantaneously and electricity can only be stored in
specified storage assets, such as batteries.
2.2.2 Abundance and Diversity of Supply
Natural gas is supplied from a variety of sources across North America, including:
• Conventional production: Currently, natural gas is primarily produced from shale plays
and formations; it is also produced in smaller quantities from conventional gas
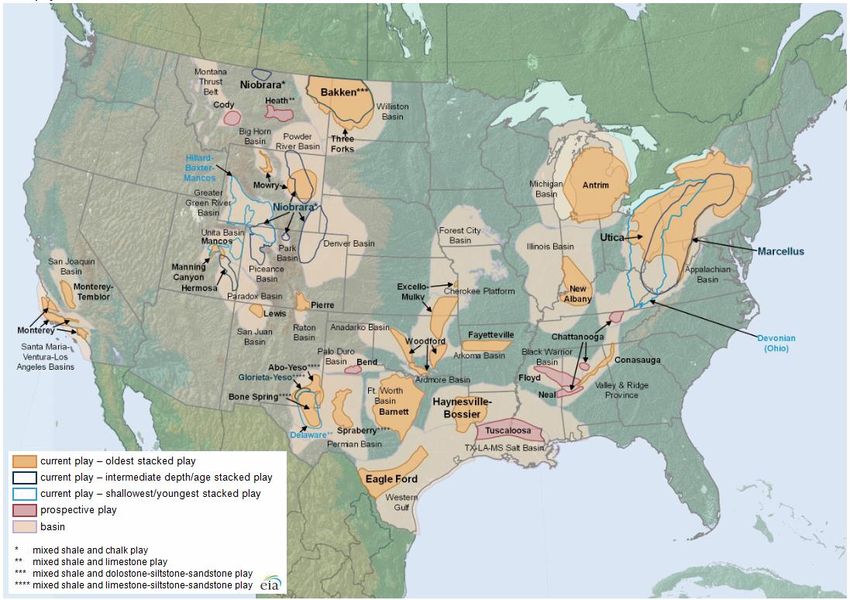
reservoirs, tight sands, carbonates, and coal-bed methane. Figure 2-3 highlights the
geographic diversity of US shale plays and formations. Additionally, an evaluation by the
Potential Gas Committee at year-end 2018 indicated that the US possesses a
technically recoverable resource base of natural gas of nearly 3,400 trillion cubic feet
(Tcf).12 The US Energy Information Administration additionally reported that US proved
11 Natural Gas Council. 2019. Natural Gas: Reliable and Resilient.
12 Potential Gas Committee. 2019. Potential Supply of Natural Gas in the United States. Accessed November 2020.
15Building a Resilient Energy Future
How the Gas System Contributes to US Energy System Resilience
reserves stood at 504.5 Tcf as of 2018. The combination of these supplies suggests a
future gas supply resource enough to meet over 100 years of consumption at current
levels.13
This abundance and diversity of natural gas supply ensures that natural gas can
continue to meet customer demand even during regionally isolated supply-side
disruptions such as a major storm event. For example, limited supply interruptions during
recent hurricanes demonstrates the value of shifting natural gas production from the Gulf
of Mexico to geographically diverse shale plays and formations.
Figure 2-3. US Shale Plays and Formations
Source: US Energy Information Administration
• Low Carbon Production: The abundance and diversity of resources transportable
through the gas system will increase as RNG and hydrogen become increasingly
commercially viable. Though it is only a small portion of current US gas supply, RNG
supply is growing dramatically--produced from a variety of waste feedstocks from the
sewage, agriculture, food, and forestry sectors, as detailed in Appendix B. Hydrogen is
projected to serve a larger portion of future US gas demand, but it is earlier in the
process of developing commercial viability in the US, though it is already flowing
through the pipes in Europe as discussed in Appendix B.
13 Natural Resources Canada. 2020. Natural Gas Facts. Accessed October 2020.
16Building a Resilient Energy Future
How the Gas System Contributes to US Energy System Resilience
• Pipeline Imports: Natural gas is also imported via pipeline from Canada, and from
elsewhere as LNG. These are critical supply sources during peak periods and lend to
greater gas system flexibility.
2.3 Physical Characteristics of Gas System Resilience
The gas system’s physical characteristics lend themselves to providing stability to the energy
system. Most pipeline infrastructure is underground and looped, creating flexibility in a delivery
system that is shielded from many major disruptive events. Much of the gas delivery system
also runs on its own supply, making it self-reliant. The ability to store gas further strengthens the
self-reliant attributes of the gas system, enabling it to respond to disruption or an extreme peak
caused by unprecedented demand or upstream disruption. Table 2-3 summarizes these
physical characteristics of gas resilience, which this section also discusses.
Table 2-3. Physical Resilience Across the Phases of Resilience
Resilience Phases
Characteristic Preparation Withstanding Recovery Adaptation
Reduces Minimizes impact
Underground
exposure to of potential
Infrastructure
threat disruptions
Improves deliverability in the event of
Looped and Parallel
regionally isolated gas network
T&D Network
disruption
Maintains gas
Self-Reliant Gas-Fired delivery during
Equipment an electric grid
outage
Reduces electric
Enables customer flexibility in the
Distributed Customer grid demand
event of an electric grid disruption
Generation during extreme
outage
weather event
Prepares system Balances supply Improves Facilitates
System Storage supply-side
for expected and demand deliverability
Capacity diversity
demand increase fluctuations during disruption (renewable integration)
Source: Guidehouse
2.3.1 Underground Infrastructure
Natural gas is one of the few energy resources predominantly delivered to customers by
pipeline. In contrast, other common energy forms, such as electricity, are mostly delivered by
aboveground wires. Although each delivery method has advantages, the underground gas
delivery system has significantly reduced exposure to disruptive events from extreme weather
such as hurricanes and snowstorms. Because of this, significant weather events rarely disrupt
localized segments of the network and damage is typically limited to aboveground facilities
where pipeline assets may be exposed.14
14 EIA. Natural Gas Explained: Natural Gas Pipelines. Accessed October 2020.
17Building a Resilient Energy Future
How the Gas System Contributes to US Energy System Resilience
2.3.2 Looped and Parallel Transmission and Distribution Network
The gas system is extensively interconnected with multiple pathways for rerouting deliveries.
This interconnectivity enables the sourcing of natural gas from various production centers
across the country. Additionally, distribution mains are typically interconnected in multiple grid
patterns with strategically located shut-off valves. These valves allow operators the ability to
isolate segments of a gas system, which minimizes customer service disruptions. To reinforce
the resilience of gas delivery, the valves are paired with on-system storage and mobile pipeline
solutions.
A 2019 study by the Rhodium Group on natural gas system reliability indicated
that, “the US natural gas system typically deals with a handful of disruptions
every month that last a day or more. Despite these disruptions, deliverability to
end-use sectors, including electric power generators, is rarely impacted because
of the redundancy built into the system.”15 While this study focused on reliability,
it highlights the system redundancy that is available to respond to higher-impact
resilience events.
In addition to the interconnectivity of the gas system design, pipeline capacity is often increased
by installing two or more parallel pipelines in the same right-of-way (called pipeline loops),
making it possible to shut off one loop while keeping the other in service. Further, in the event of
one or more equipment failures, gas pipelines can continue to operate at pressures necessary
to maintain deliveries to pipeline customers, at least outside the affected segment. Considering
customer impacts of individual equipment failures in the design of gas pipelines and facilities to
determine where investment in redundant infrastructure is prudent, is part of the gas utility risk
management process.
2.3.3 Self-Reliant Gas-Fired Equipment
Much of the equipment used on the gas system, including compressors, dehydration equipment,
pressure regulators, and heaters, are usually powered by the gas that flows through the pipes
they serve. Powering equipment by the gas in the system limits the gas system’s reliance on
external supply chains. If gas continues to flow through the pipes—which has demonstrated to
be a resilient supply chain itself—the gas system will continue to operate, and gas will flow to
customers.
In some cases, the pursuit of decarbonization goals has resulted in the replacement of gas
compressors with electric compressors. While electric compressors are not yet widespread,
their use does reduce this resilient aspect of gas system operation.
2.3.4 Distributed Customer Generation
The US Department of Energy has documented how combined-heat and power (CHP) systems
serve as a resilience solution, with specific case studies on how CHP has provided resilience for
critical facilities during major weather events, giving them the flexibility to produce thermal
energy and electricity onsite.16 Example 1 highlights one such case study. CHP systems at
15 Rhodium Group. 2019. Natural Gas Supply Disruption: An Unlikely Threat to Electric Reliability.
16 US Department of Energy. 2018. “CHP Technology Fact Sheet Series.”
18Building a Resilient Energy Future
How the Gas System Contributes to US Energy System Resilience
these facilities are largely dependent on the resilience of the US gas system and its ability to
continue delivering natural gas during resilience events.
At the end of 2019, there were 3,186 commercial and industrial (C&I) CHP sites fueled by
natural gas with a total capacity of 58,140 MW.17 This distributed generation is equivalent to
over 5% of total US electric power generation capacity. Distributed CHP systems exemplify how
the gas system supports the resilience of end-use customers by giving them alternative options
to generate heat and electricity in the case of unplanned energy system disruptions. The costs
and inconvenience of a power outage can be substantial, including losses in productivity,
product, revenue, and customers. Gas-fired standby generators also provide a resilience benefit
by helping to avoid the impact of a power outage. This benefit is discussed further in Case
Study 5.
Example 1. CHP and Distributed Generation Support Critical Infrastructure
During Extreme Weather Events18
Hurricanes. In 2008, Hurricane Ike flooded over 1 million square feet of the University of Texas
Medical Branch (UTMB) in Galveston, Texas. The hurricane interrupted utility services and resulted in
the complete loss of UTMB’s underground steam distribution system. Learning from this experience,
the UTMB installed a 15 MW CHP facility (11 MW fueled by natural gas) to improve resilience and
allow for an immediate return of hospital and clinical operations.
This resilience solution was tested during Hurricane Harvey in 2017 when the campus lost power. In
circumstances that would have otherwise caused a blackout, the CHP system continued to operate
during and after the storm, allowing the hospital to maintain regular operations. As a co-benefit, the
CHP system saves UTMB approximately $2 million per year in utility costs and reduces campus
emissions by 16,476 tons of CO2 per year.
2.3.5 Gas System Storage Capacity
The ability to store large quantities of energy supply is a fundamental strength of the gas system
allowing it to respond to, prepare for, withstand, and recover from disruption. In addition, gas
storage facilities offer further geographic supply diversity to the gas system, as these storage
assets can often maintain supply if disruptions are experienced on the system. Gas system
storage capacity is built as a result of long-term planning in response to forecasted seasonal
and peak demand. Gas system storage can be classified by where it is connected to the gas
value chain.
• On-System Storage: This storage is operated and controlled by the LDC, allowing it to
respond quickly to peak demand requirements and emergency situations. On-system
storage is often aboveground, and in some situations underground. One advantage of on-
system storage is that it can be sited at specific locations on the gas distribution system to
best provide a resilience benefit (both supply and pressure support) in the event of an
upstream disruption. This benefit is exemplified in Case Study 4.
17 U.S. Department of Energy. 2019. U.S. Department of Energy Combined Heat and Power Installation Database.
Accessed October 2020.
18 Southcentral CHP Technical Assistance Partnerships. 2019. Project Profile: University of Texas Medical Branch 15
MW CHP System. Accessed October 2020.
19You can also read