Building on progress: Infrastructure development still a major challenge in Africa
←
→
Page content transcription
If your browser does not render page correctly, please read the page content below
Afrobarometer Round 6
        New data from
         across Africa

                                                                  Dispatch No. 69 | 14 January 2016

Building on progress: Infrastructure
development still a major challenge in Africa
Afrobarometer Dispatch No. 69 | Winnie V. Mitullah, Romaric Samson,
Pauline M. Wambua, and Samuel Balongo

Summary
Infrastructure is a bedrock for development. As an essential part of a supportive environment
for investment and livelihood, adequate infrastructure promotes economic growth, reduces
poverty, and improves delivery of health and other services (World Bank, 2014; Wantchekon,
2014). The African Development Bank (AfDB), whose Strategy for 2013-2022 makes
infrastructure development one of its five operational priorities, notes that “Africa still has
massive infrastructure needs” yet invests only 4% of its gross domestic product (GDP) in
infrastructure, compared to China’s 14% investment. The AfDB estimates that “bridging the
infrastructure gap could increase GDP growth by an estimated 2 percentage points a year”
(African Development Bank, 2013).
Both political leaders and ordinary citizens emphasize the importance of infrastructure
development in Africa. Under the leadership of the African Union, the New Partnership for
Africa’s Development, and the AfDB, the Programme for Infrastructure Development in Africa
is designed to address an “infrastructure deficit in Africa [that] penalises growth and
development of the continent.” As South African President Jacob Zuma said during the
program’s launch in 2010, “Africa's time has come, and without infrastructure, our dreams will
never be realised” (New Partnership for Africa’s Development, 2010).
Like their leaders, African citizens call for greater investment in infrastructure. Asked what they
consider the most important problems facing their country, 22% of Afrobarometer survey
respondents in 32 countries cited infrastructure and transport among the top three problems

Copyright © Afrobarometer 2016                                                                        1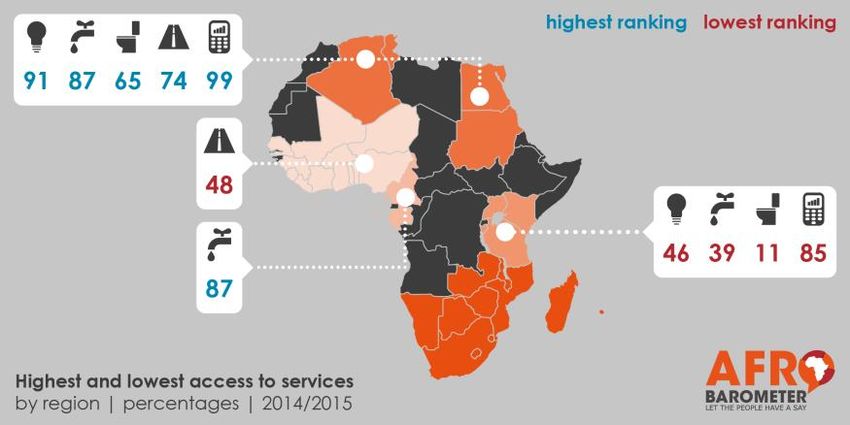
that government should address – only unemployment, health, and education ranked higher
(Bentley, Olapade, Wambua, & Charron, 2015). When asked about their priorities for
increased government spending across six key sectors, about one in four respondents said
they would prioritize infrastructure.
To assess and track citizens’ access to basic infrastructure, Afrobarometer records direct
community-level observations of the presence and absence of infrastructure in the many
communities visited by its field teams. This paper focuses on five basic types of infrastructure:
electricity, piped water, sewerage, tarred/paved roads, and cell phone service. (Later
publications will report on other services, such as health, school, police, and bank services.)
Findings show that despite some progress, infrastructure remains an enormous challenge.
While a few countries have achieved universal coverage for electricity and piped water,
and several have made major progress over the past decade, in other countries less than
one in five citizens have access to these essential services. Only about half of citizens live in
zones with tarred or paved roads. Sewerage is especially rare, available to less than one in
three citizens, and very little progress has been made over the past decade in expanding
access to this service. The exception is cell phone service, which has rapidly increased in
recent years and is now available to 93% of Africans.

Availability of infrastructure varies widely by region – with North Africa ranking first and East
Africa last on most services – as well as by country. Rural residents remain particularly
disadvantaged; on average, less than half of rural residents have access to electricity, piped
water, sewerage, or tarred/paved roads, and urban-rural access gaps within countries range
up to 90 percentage points.

Afrobarometer survey
Afrobarometer is a pan-African, non-partisan research network that conducts public attitude
surveys on democracy, governance, economic conditions, and related issues across more
than 30 countries in Africa. Five rounds of surveys were conducted between 1999 and 2013,
and findings from Round 6 surveys (2014/2015) are currently being released. Afrobarometer
conducts face-to-face interviews in the language of the respondent’s choice with nationally
representative samples that yield country-level results with margins of error of +/-2% (for
samples of 2,400) or +/3% (for samples of 1,200) at a 95% confidence level.

Copyright © Afrobarometer 2016                                                                      2
The contextual data on service infrastructure reported here are captured before and after
interviews with survey respondents. Afrobarometer field teams make on-the-ground
observations in each sampled census enumeration area (EA) that they visit about the
services and facilities that are available in the area. These observations are recorded and
confirmed by survey field supervisors. Since the EAs visited are selected to represent the
population of the country as a whole, these data provide reliable indicators of infrastructure
and service availability.
This dispatch uses data from 35 countries (see Appendix Table A.1 for a list of countries and
fieldwork dates). Interested readers should watch for additional findings to be released over
the coming months (see http://afrobarometer.org/countries/results-round).
Key findings
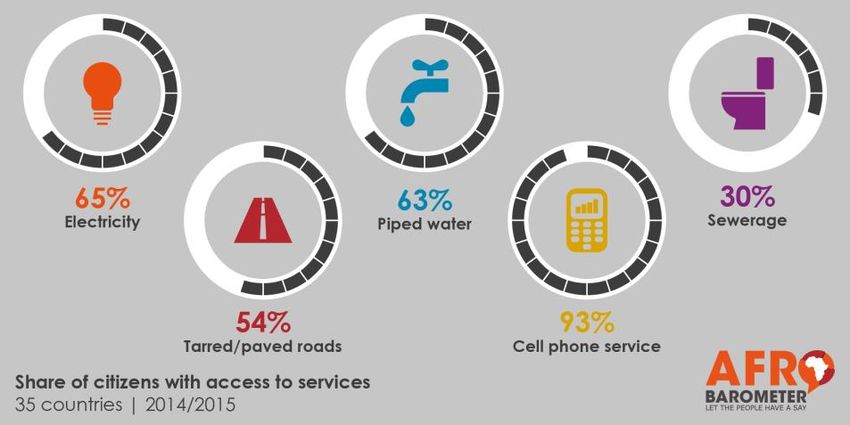
Provision of basic service infrastructure remains a challenge. On average across 35
African countries, only about two-thirds of citizens live in communities with an electric
grid (65%) and/or piped water infrastructure (63%), and less than one in three have
access to sewerage (30%). More than three times as many have access to cell phone
service (93%), while about half (54%) live in zones with tarred or paved roads.
Eighteen countries tracked since 2005/2006 show steady, though slow, progress in
infrastructure development. On average, the availability of all five services has
increased. Sewerage shows the least progress, with access increasing by just 8
percentage points over the past decade.
Countries vary enormously in their provision of basic service infrastructure. For
example, while availability of electricity and piped water is universal in Mauritius and
Egypt, only 17% of Burundians live in zones with an electric grid, and only 17% of
Liberians have access to piped water.
Regional
comparisons show
North Africa with
the best availability
of all five services,
followed closely by
Central Africa. East
Africa ranks last in
the availability of
electricity, piped
water, sewerage,
and cell phone
service.
Rural residents continue to be severely disadvantaged in most countries, with urban-
rural gaps of more than 40 percentage points in the average availability of an
electric grid, sewerage, and piped water infrastructure. In cell phone service, the
average gap is only 10 percentage points. At the country level, urban-rural gaps vary
widely, ranging up to 88 percentage points for access to the electric grid in Guinea,
and 87 and 90 points for piped water and sewerage in Zimbabwe.
Copyright © Afrobarometer 2016 3
Progress on infrastructure development
Despite the high priority assigned to infrastructure by both citizens and their governments,
providing it remains a major challenge for many African countries. Based on Afrobarometer
observations in 35 countries, on average only about two-thirds of citizens live in zones with an
electric grid (65%) and/or piped water (63%), and only one in three live in zones with a
sewage system (30%) (Figure 1). More than three times as many have access to cell phone
service (93%), and about half (54%) live in zones with tarred or paved roads. (Note that
“access” refers to the availability of services in a given enumeration area but does not imply
the capacity of any individual or household to actually obtain the services).

Figure 1: Availability of services and roads | 35 countries | 2014/2015

     Cell phone service                                                              93%

              Electric grid                                         65%

             Piped water                                            63%

    Tarred / paved road                                       54%

           Sewage system                       30%

                              0%      20%         40%         60%         80%        100%

Interviewers were asked to record:
      1.   Whether the following were present in the enumeration area: 1
              o An electricity grid that most houses could access.
              o A piped water system that most houses could access.
              o A sewage system that most houses could access.
              o Cell-phone service.
      2.   Whether or not the road at the start point in the EA was paved or tarred.

1
  Note that interviewers were asked to record the availability of the service in the community, not whether
individual households were actually receiving the services. The proportion of households that currently receive
these services will be lower in many cases.

Copyright © Afrobarometer 2016                                                                                    4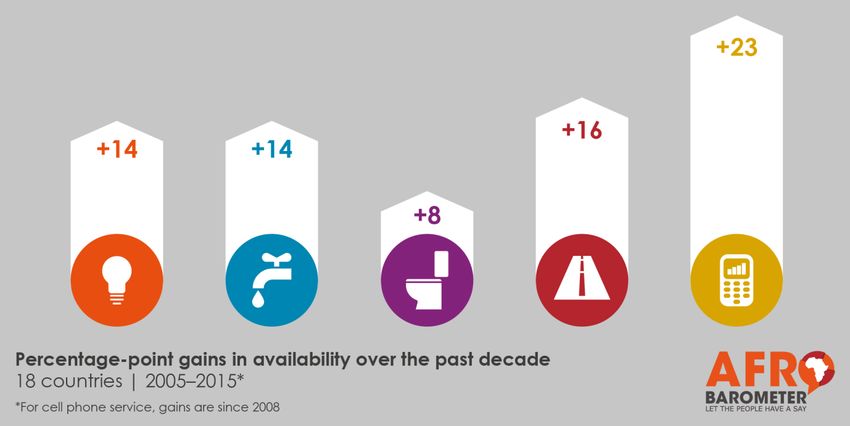
These results reflect continued steady, though slow, progress in infrastructure development.
On average, across 18 countries tracked by Afrobarometer since 2005/2006, 2 the availability
of all five of these services has improved.3 Access to electricity at the EA level has risen by 14
percentage points over the decade, and access to piped water systems has increased by
the same amount (Figure 2). The presence of a paved or tarred road at the EA level
expanded by 16 points. Cell phone services have expanded much more rapidly. In
2008/2009, the first time they were tracked by Afrobarometer, cell phone services were
accessible to 70% of respondents, but by 2014/2015, coverage had increased to 93%, a gain
of 23 percentage points. In contrast, access to sewerage has lagged, increasing just 8 points
over the decade, from 22% in 2005/2006 to 30% in 2014/2015.
Figure 2: Improved availability of basic infrastructure | 18 countries | 2005-2015
100%
90% 93%
92%
80%
70% 65%
70% 62%
58% 63%
60%
51% 55% 54%
50% 53%
49%
40% 45%
38% 41%
30% 30%
20% 22%
23% 24%
10%
0%
2005/2006 2008/2009 2011/2013 2014/2015
Electricity Piped water Sewage system
Cell phone service Paved / tarred road
National differences in access to infrastructure
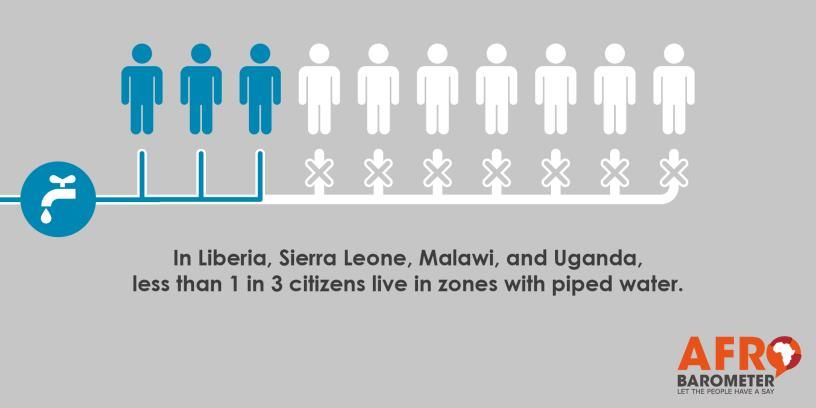
Access to basic services is highly variable across countries. For example, on average, 37% of
all citizens live in zones without piped-water infrastructure, but the proportion ranges from 0%
in Mauritius and Egypt to 83% in Liberia and 73% in Sierra Leone and Malawi.
Electric grid
Mauritius, Egypt, Algeria, and Tunisia have all attained virtually universal coverage for their
electric grids. In contrast, Burundi (17%), Burkina Faso (25%), Sierra Leone (29%), and Niger
(30%) lag far behind, with access to less than one-third of citizens (Figure 3).
2
The 18 countries are Benin, Botswana, Cape Verde, Ghana, Kenya, Lesotho, Madagascar, Malawi, Mali,
Mozambique, Namibia, Nigeria, Senegal, South Africa, Tanzania, Uganda, Zambia, and Zimbabwe.
3
Note that the figure of 70% for cell phone service in 2008/2009 is based on 16 countries rather than 18, as no
data are available for Lesotho and Madagascar during this time period.
Copyright © Afrobarometer 2016 5Figure 3: Availability of electric grid in enumeration area | 35 countries | 2014/2015
Mauritius 100%
Egypt 100%
Algeria 99%
Tunisia 99%
Cape Verde 98%
Swaziland 97%
South Africa 95%
Cameroon 93%
Nigeria 90%
São Tomé and Príncipe 90%
Botswana 89%
Ghana 85%
Kenya 83%
Côte d'Ivoire 83%
Gabon 83%
Senegal 72%
Sudan 65%
Average 65%
Namibia 62%
Zimbabwe 61%
Togo 59%
Benin 54%
Lesotho 54%
Mozambique 50%
Zambia 50%
Tanzania 44%
Malawi 42%
Uganda 39%
Madagascar 35%
Mali 32%
Guinea 31%
Liberia 31%
Niger 30%
Sierra Leone 29%
Burkina Faso 25%
Burundi 17%
0% 20% 40% 60% 80% 100%
Access in the 18 countries tracked since 2005/2006 has increased from 51% to 65%. Benin,
Cape Verde, Kenya, Lesotho, Malawi, Nigeria, and Uganda have made the largest and
most consistent gains in availability (Figure 4), led by Kenya with a gain of 36 percentage
points. Madagascar, Senegal, and Zambia actually recorded slight losses over the past
decade.
Copyright © Afrobarometer 2016 6Figure 4: Changes in access to electric grid: Countries with highest gains
| 18 countries | 2005-2015
100% 100% 98%
90% 92% 90%
87% 83%
80% 76%
70%
74% Nigeria
58% Lesotho
60% 59% 54%
50% Uganda
47% 57%
54% Benin
39% 39% 47% 42% Malawi
40%
38% 35% 36% 39% Cape Verde
24% Kenya
30%
20% 22%
0%
2005/2006 2008/2009 2011/2013 2014/2015
Piped water
Mauritius and Egypt have attained universal coverage in availability of piped water as well,
and Algeria is nearly there at 97% coverage. But 14 countries cannot provide access to
piped water to even 50% of their citizens (Figure 5). Liberia lags farthest behind, with piped
water supplies available in only 17% of EAs that were visited.
Copyright © Afrobarometer 2016 7Figure 5: Availability of piped water in enumeration area | 35 countries | 2014/2015
Mauritius 100%
Egypt 100%
Algeria 97%
São Tomé and… 92%
Botswana 91%
Cameroon 91%
Tunisia 90%
South Africa 87%
Cape Verde 87%
Côte d'Ivoire 85%
Senegal 84%
Burkina Faso 83%
Lesotho 80%
Gabon 77%
Benin 75%
Namibia 71%
Ghana 70%
Average 63%
Guinea 61%
Sudan 59%
Swaziland 59%
Togo 56%
Nigeria 48%
Madagascar 48%
Burundi 47%
Kenya 46%
Mali 44%
Niger 43%
Mozambique 39%
Zimbabwe 38%
Zambia 36%
Tanzania 34%
Uganda 30%
Malawi 27%
Sierra Leone 27%
Liberia 17%
0% 20% 40% 60% 80% 100%
Across the 18 countries tracked since 2005/2005, Benin, Cape Verde, Lesotho, Nigeria, and
Uganda are again among those recording the greatest increases, along with Mozambique.
All gained at least 13 percentage points in access to piped water over the past decade,
with Benin recording an impressive 31-percentage-point increase (Figure 6). In contrast,
Malawi, Mali, and Zimbabwe saw slight declines in coverage during the same period.
Copyright © Afrobarometer 2016 8Figure 6: Changes in access to piped water: Countries with highest gains
| 18 countries | 2005-2015
100%
88% 87%
83%
79% 80%
80%
71% Uganda
65% 75%
62% 61% Nigeria
60% 63% Lesotho
48%
Mozambique
43%
41%
39% Cape Verde
40%
35%
35% 33% Benin
26% 30%
30%
19%
20% 24%
17%
0%
2005/2006 2008/2009 2011/2013 2014/2015
Sewerage
Availability of sewerage is poor across the African continent. No country has achieved
universal availability. The average level of access across 35 countries is just 30%, and 20
countries remain below 20%. Only seven countries record coverage above 50%: Algeria
(95%), Egypt (86%), Tunisia (68%), South Africa (68%), Cameroon (56%), Ghana (54%), and
Cape Verde (54%). Malawi (3%) is the worst performer, followed by Niger (7%), Uganda (9%),
Tanzania (9%), and Sierra Leone (9%) (Figure 7).
Among the 18 countries tracked since 2005/2006, several recorded sizeable gains, led by
Cape Verde (28-percentage-point increase), Botswana (20 points), Ghana (17 points), and
Nigeria (15 points).
But nine of the 18
countries either
gained essentially no
ground over the past
decade, with
changes of 3 points or
less (Kenya, Mali,
Tanzania, and
Zimbabwe), or even
lost ground (Benin,
Madagascar, Malawi,
Namibia, and
Zambia).
Copyright © Afrobarometer 2016 9Figure 7: Availability of sewerage in enumeration area | 35 countries | 2014/2015
Algeria 95%
Egypt 86%
Tunisia 68%
South Africa 68%
Cameroon 56%
Ghana 54%
Cape Verde 54%
Côte d'Ivoire 44%
Mauritius 43%
Botswana 42%
Namibia 39%
Zimbabwe 36%
Senegal 36%
Nigeria 34%
Average 30%
São Tomé and Príncipe 26%
Togo 19%
Mozambique 18%
Gabon 18%
Zambia 17%
Swaziland 16%
Lesotho 16%
Kenya 16%
Benin 16%
Madagascar 15%
Mali 14%
Liberia 13%
Burkina Faso 13%
Sudan 13%
Burundi 11%
Guinea 11%
Sierra Leone 9%
Tanzania 9%
Uganda 9%
Niger 7%
Malawi 3%
0% 20% 40% 60% 80% 100%
Tarred/paved roads
Mauritius is the only country where field teams reported tarred or paved roads leading to all
of the sampled EAs, followed by Kenya (97%),4 Cape Verde (96%), and Egypt (91%). But the
average for Africa is just 54%, and five countries recorded paved roads in less than one in five
EAs visited: Mozambique (16%), Burkina Faso (16%), Uganda (17%), Burundi (19%), and
Swaziland (20%) (Figure 8).
4
This high figure for Kenya is surprising, especially given much lower figures (30% or less) recorded in previous
surveys, but it may at least in part reflect aggressive infrastructure development, and especially road
improvement and grading, done by many of the country’s new county governments in the past few years.
Copyright © Afrobarometer 2016 10Figure 8: Tarred/paved roads in enumeration area | 35 countries | 2014/2015
Mauritius 100%
Kenya 97%
Cape Verde 96%
Egypt 91%
São Tomé and Príncipe 89%
Algeria 89%
Sierra Leone 87%
Tanzania 87%
Tunisia 79%
Botswana 78%
Nigeria 70%
Gabon 68%
South Africa 64%
Senegal 60%
Cameroon 60%
Lesotho 58%
Liberia 57%
Average 54%
Ghana 51%
Zimbabwe 50%
Côte d'Ivoire 50%
Zambia 48%
Malawi 43%
Namibia 38%
Sudan 36%
Benin 32%
Togo 28%
Madagascar 28%
Mali 25%
Guinea 23%
Niger 23%
Swaziland 20%
Burundi 19%
Uganda 17%
Burkina Faso 16%
Mozambique 16%
0% 20% 40% 60% 80% 100%
Among the 18 countries tracked since 2005/2006, Tanzania stands out with 15- to 20-
percentage-point gains in every survey cycle; between 2002/2003 and 2014/2015, the
proportion of EAs with improved roads in Tanzania has grown from 23% to 87%, a 64-point
increase. At the other extreme, Uganda, Senegal, Mali, and Madagascar made little or no
headway, and Ghana and Mozambique saw declines over the period.
For the first time, Afrobarometer also recorded in Round 6 whether fieldworkers encountered
any impassable roads on their way to an enumeration area, which occurred for 15% of all
EAs. Benin had the most reported problems, with impassable roads on the way to 50% of EAs,
Copyright © Afrobarometer 2016 11followed closely by Burkina Faso (49%) (Figure 9). In contrast, five countries (Botswana, Cape
Verde, Mauritius, Namibia, and São Tomé and Príncipe) reported no problems with
impassable roads, and problems were reported in only 2%-3% of EAs in seven other countries
(Egypt, Ghana, Mozambique, South Africa, Tanzania, Zambia, and Zimbabwe).
Figure 9: Countries with impassable roads for 20% or more of enumeration areas
| 35 countries | 2014/2015
60%
50% 49%
50%
40% 36%
33% 33%
31%
29% 29% 29%
30%
25%
24%
22% 22%
20%
15%
10%
0%
Interviewers were asked to record whether the road to the enumeration area was impassable at any
point, for example due to absence of a bridge or a collapsed bridge, broken-down vehicles, fallen
tree, or water-logged section.
Cell phone service
Cell phone service stands out as the most highly accessible service on the continent, with an
average of 93% availability across EAs in 35 countries. Mauritius, Algeria, and Gabon have
achieved universal coverage, and all but seven countries score over 90%. In contrast,
Mozambique and Liberia rank at the bottom with 69% and 80% access, respectively (Figure
10).5
An examination of availability of cell phone service across 18 countries since Afrobarometer
Round 4 in 2008/2009 shows tremendous improvement in many countries, led by Senegal
(increasing from 30% to 99%) and Mali (from 47% to 91%). In addition, Benin and Zimbabwe
both saw increases of 27 percentage points over this period. Seven other countries had
already achieved coverage above 90% by 2008/2009.
5
Note that figures reported for cell phone service coverage in Uganda in Round 6 (2015) are even lower, but
the accuracy of this finding is still being evaluated. Findings for Uganda are therefore excluded from charts on
cell service. Another anomalous finding, Mozambique’s drop in cell phone service coverage from 89% in
2011/2013 to 69% in 2014/2015, is also being further analysed.
Copyright © Afrobarometer 2016 12Figure 10: Availability of cell phone service in enumeration area | 34 countries | 2014/2015
Mauritius 100%
Algeria 100%
Gabon 100%
Cameroon 99%
Egypt 99%
Togo 99%
Senegal 99%
Botswana 99%
Tunisia 99%
Malawi 98%
Kenya 98%
Sudan 98%
Cape Verde 97%
Zimbabwe 96%
Swaziland 96%
South Africa 96%
Lesotho 96%
Côte d'Ivoire 96%
São Tomé and Príncipe 95%
Burundi 94%
Ghana 94%
Benin 94%
Burkina Faso 93%
Average 93%
Zambia 93%
Tanzania 92%
Namibia 92%
Nigeria 92%
Mali 91%
Niger 88%
Sierra Leone 88%
Guinea 84%
Madagascar 83%
Liberia 80%
Mozambique 69%
0% 20% 40% 60% 80% 100%
Regional disparities
Beyond the country-level differences reported above, we also find regional-level differences
in infrastructure and service provision.6 North Africa stands out as a comparatively well-
provided-for region, enjoying the highest level of infrastructure access across all sectors. As
6
Regional groupings are: East Africa (Burundi, Kenya, Tanzania, Uganda), West Africa (Benin, Burkina Faso,
Cape Verde, Côte d'Ivoire, Ghana, Guinea, Liberia, Mali, Niger, Nigeria, Senegal, Sierra Leone, Togo), Southern
Africa (Botswana, Lesotho, Madagascar, Malawi, Mauritius, Mozambique, Namibia, South Africa, Swaziland,
Zambia, Zimbabwe), North Africa (Algeria, Egypt, Sudan, Tunisia), and Central Africa (Cameroon, Gabon, and
São Tomé and Principe).
Copyright © Afrobarometer 2016 13represented by the three countries currently covered by Afrobarometer surveys, Central
Africa enjoys comparable levels of delivery for all services except sewerage (33%), where it
falls far behind North Africa (65%) (Figure 11).
In contrast, the East Africa region lags behind all others in all services except tarred/paved
roads, where it surpasses West and Southern Africa.
Figure 11: Regional disparities in provision of infrastructure | 35 countries | 2014/2015
99% 98%
100% 93%
91% 89% 92%
87% 87% 85%
80% 74% 73%
67%
65%
62%
55% 60%
60% 55%
49%
48% 46%
39%
40%
33%
28%
25%
20%
11%
0%
North Africa Central Africa Southern Africa West Africa East Africa
Cell phone service Electricity grid
Piped water system Tarred/paved roads
Sewage system
Urban-rural disparities
Africa’s infrastructure development remains heavily skewed, with rural residents far less likely
than their urban counterparts to have access to basic services. Cell phone service is the least
skewed: A gap of only
10 percentage points
separates average
availability in urban
and rural areas. Other
services show far larger
disparities: 37
percentage points for
tarred or paved roads,
42 points for piped
water, 48 points for
sewerage, and 49
points for electricity
(Figure 12).
Copyright © Afrobarometer 2016 14Figure 12: Urban-rural disparities in service availability | 35 countries | 2014/2015
100% 99% 93%
89% 88%
76%
80%
57%
60%
44% 46%
38%
40%
20% 10%
0%
Cell phone Electricity grid Piped water Tarred/paved Sewage system
service road
Urban Rural
Note: 1-point differences between reported gaps and numbers shown in the figures are due to
rounding.
Urban-rural disparities vary widely at the country level. For example, availability of electricity
shows gaps of 88 percentage points in Guinea, 87 points in Mali, and 84 points in Niger
(Figure 13), while at the other extreme Tunisia, Egypt, and Mauritius have 100% coverage in
rural areas and Swaziland, Algeria, Cape Verde, and South Africa show urban-rural gaps of
less than 10 points. (See details of urban-rural disparities by country in the appendix.)
Figure 13: Urban-rural gap in availability of electric grid in the enumeration area
| countries above average (percentage-point gap in average access between
urban and rural EAs) | 2014/2015
Guinea 88
Mali 87
Niger 84
Burundi 79
Gabon 79
Madagascar 77
Zambia 74
Malawi 69
Sierra Leone 68
Mozambique 67
Lesotho 62
Togo 62
Tanzania 59
Burkina Faso 58
Benin 55
Zimbabwe 54
Uganda 53
Average 49
0 20 40 60 80 100
Copyright © Afrobarometer 2016 15With regard to piped water, the average urban-rural gap of 42 percentage points reflects
the extremes of large disparities in Zimbabwe (87 points), Gabon (87), and Mali (74 points)
(Figure 14) and no gap in Egypt and Mauritius. In São Tomé and Principe, the gap favours
rural residents (97% have access) over their urban counterparts (90%).
Figure 14: Urban-rural gap in availability of piped water in the enumeration area
| countries above average (percentage-point gap in average access between
urban and rural EAs) | 2014/2015
Zimbabwe 87
Gabon 87
Mali 74
Zambia 72
Malawi 70
Niger 68
Mozambique 66
Madagascar 62
Togo 61
Tanzania 56
Uganda 49
Swaziland 49
Burundi 48
Sudan 45
Ghana 43
Average 42
0 20 40 60 80 100
The gap between urban and rural areas in provision of tarred/paved roads (37 percentage
points on average) is led by Niger (80 percentage points), Madagascar (63 points), and
South Africa (62 points) (Figure 15). São Tomé and Principe and Mauritius have closed the
gap, while Kenya (5 points), Liberia (5 points), Malawi (6 points), and Uganda (10 points)
show the smallest gaps.
Copyright © Afrobarometer 2016 16Figure 15: Urban–rural gap in provision of tarred/paved roads in the enumeration
area | countries above average (percentage-point gap in average access
between urban and rural EAs) | 2014/2015
Niger 80
Madagascar 63
South Africa 62
Swaziland 61
Zimbabwe 60
Burundi 56
Burkina Faso 52
Côte d'Ivoire 51
Namibia 49
Mali 45
Guinea 40
Cameroon 40
Average 37
0 20 40 60 80 100
Sewerage shows the single greatest national urban-rural gap – 90 percentage points, in
Zimbabwe, followed by 86 points in Burundi, 82 points in South Africa, and 75 points in
Mauritius. São Tomé and Principe (2 points) and Togo (9 points) have the smallest urban-rural
gaps in sewerage provision (Figure 16).
Figure 16: Urban–rural gap in provision of sewage system in the enumeration area
| countries above average (percentage-point gap in average access between
urban and rural EAs) | 2014/2015
Zimbabwe 90
Burundi 86
South Africa 82
Mauritius 75
Côte d'Ivoire 72
Cape Verde 72
Namibia 66
Madagascar 63
Swaziland 62
Tunisia 58
Botswana 56
Ghana 53
Cameroon 52
Lesotho 49
Average 48
0 20 40 60 80 100
Copyright © Afrobarometer 2016 17The urban-rural gap is smallest (10 percentage points on average across all countries) in cell
phone service as the private sector continues its successful push toward universal coverage.
Guinea has the largest gap (24 percentage points), followed by Madagascar (21 points) and
Sierra Leone and Liberia (19 points each) (Figure 17). In contrast, Mauritius and Algeria have
closed the gap completely, while 20 other countries have gaps of between 1 and 9
percentage points.
Figure 17: Urban-rural gap in availability of cell phone service in the enumeration
area | countries above average (percentage-point gap in average access
between urban and rural EAs) | 2014/2015
Guinea 24
Madagascar 21
Sierra Leone 19
Liberia 19
Mozambique 18
Namibia 15
Niger 14
Ghana 13
Zambia 12
Tanzania 12
Mali 12
Benin 12
Average 10
0 10 20 30
Infrastructure and poverty
Previous analysis of Afrobarometer data has confirmed the strong link between poverty and
whether or not individuals have access to key services in their communities (Mattes, Dulani, &
Logan, 2013; Logan, 2014). Afrobarometer data describe “lived poverty” based on how
frequently people go without basic necessities (food, clean water for home use, medicines
or medical treatment, fuel for cooking, and a cash income) during the course of a year. The
frequency with which a household goes without food, in particular, is a good proxy for
overall household experience of poverty.
Where infrastructure services are not present, individuals are significantly more likely to go
hungry. For example, where an electric grid is available, 38% experienced hunger in the past
year, while 62% did not. In contrast, where no grid is present, experience of hunger is much
higher, with 60% saying they went without food at least once in the past year (Figure 18).
Similar patterns are evident with respect to all of the other services: Levels of hunger are
much higher in areas where the service is not available.7
7
Pearson’s chi-square tests confirm that the differences are significant for all five types of infrastructure: for
2 2 2
electric grid, X =1908.90, p=0.000; for piped water, X =1520.28, p=0.000; for tarred/paved roads, X =1065.36,
2 2
p=0.000; for cell phone service, X =251.07, p=0.000; and for sewerage, X =1838.31, p=0.000.
Copyright © Afrobarometer 2016 18Figure 18: Access to infrastructure and experience of poverty (hunger) | 35 countries
| 2014/2015
80%
70%
62% 62% 62%
60% 58% 59% 59%
60% 56%
52%
46% 48%
44% 44%
40% 42% 41%
38% 38%
40%
30%
20%
0%
No Electric No Piped No Tarred No cell Cell No Sewer
electric grid piped water tarred road service service sewer service
grid water road service
Never gone without food Gone without food
Respondents were asked: Over the past year, how often, if ever, have you or anyone in your family
gone without enough food to eat? (Responses are divided into two categories: Those who have “never
gone without food” and those who have gone without “once or twice,” “several times,” “many times,”
or “always” (all combined into “gone without food”)
While these results do not prove that better infrastructure causes reductions in poverty, they
do suggest that a lack of key service infrastructure is related to the experience of poverty. An
understanding of this association may explain why poor respondents and poor countries are
especially likely to cite infrastructure as the most important problem facing their country, and
as a priority for additional government investment (Bentley, Olapade, Wambua, & Charron,
2015).
Conclusion
These findings point to the need for African governments to intensify efforts to develop basic
infrastructure across the continent. Of particular concern are infrastructure deficits in rural
areas, where a majority of the population lives and works, but where on average less than
half of all people have access to electricity, piped water, sewerage, and tarred/paved
roads. Building on, and accelerating, the progress made over the past decade will move
Africa toward the inclusive growth that its citizens demand.
Do your own analysis of Afrobarometer data – on any question,
for any country and survey round. It’s easy and free at
www.afrobarometer.org/online-data-analysis.
Copyright © Afrobarometer 2016 19References
African Development Bank. (2013). AfDB strategy for 2013-2022: At the center of Africa’s
transformation. Available at http://www.afdb.org/en/documents/document/afdb-strategy-
for-2013-2022-at-the-center-of-africas-transformation-31420/.
Bentley, T., Olapade, M., Wambua, P., & Charron, N. (2015). Where to start? Aligning sustainable
development goals with citizen priorities. Afrobarometer Dispatch No. 67. Available at
http://afrobarometer.org/sites/default/files/publications/
Dispatches/ab_r6_dispatchno67_african_priorities_en.pdf.
Logan, C. (2014). Developing Africa’s infrastructure: The rough road to better services.
Afrobarometer Dispatch No. 3. Available at http://afrobarometer.org/sites/default/
files/publications/Dispatch/ab_r6_dispatchno3.pdf
Mattes, R., Dulani, B., & Logan, C. (2013). After a decade of growth in Africa, little change in poverty
at the grassroots. Afrobarometer Policy Paper No. 1. Available at
http://www.afrobarometer.org/publications/policy-papers?start=25.
New Partnership for Africa’s Development. (2010). Africa launches an ambitious programme for
infrastructure development. Available at http://www.nepad.org/
regionalintegrationandinfrastructure/news/1628/africa-launches-ambitious-programme-
infrastructure-de.
Wantchekon, L. (2014). Breaking the cycle of rural poverty: One infrastructure investment at a time.
Posted on World Bank Blog “Africa Can End Poverty.” 14 October 2014. Available at
http://blogs.worldbank.org/africacan/breaking-cycle-rural-poverty-one-infrastructure-
investment-time.
World Bank. (2014). Logistics performance index, 2014 (database). World Bank.
http://lpi.worldbank.org/.
Copyright © Afrobarometer 2016 20Appendix
Table A.1: Afrobarometer Round 6 fieldwork dates and previous survey rounds
Months when Round 6
Country Previous survey rounds
fieldwork was conducted
Algeria May-June 2015 2013
Benin May-June 2014 2005, 2008, 2011
Botswana June-July 2014 1999, 2003, 2005, 2008, 2012
Burkina Faso April-May 2015 2008, 2012
Burundi September-October 2014 2012
Cameroon January-February 2015 2013
Cape Verde November-December 2014 2002, 2005, 2008, 2011
Côte d'Ivoire August-September 2014 2013
Egypt June-July 2015 2013
Gabon* September 2015 N/A
Ghana May-June 2014 1999, 2002, 2005, 2008, 2012
Guinea March-April 2015 2013
Kenya November-December 2014 2003, 2005, 2008, 2011
Lesotho May 2014 2000, 2003, 2005, 2008, 2012
Liberia May 2015 2008, 2012
Madagascar December 2015-January 2015 2005, 2008, 2013
Malawi March-April 2014 1999, 2003, 2005, 2008, 2012
Mali December 2014 2001, 2002, 2005, 2008, 2013
Mauritius June-July 2014 2012
Morocco* November 2015 2013
Mozambique* June-August 2015 2002, 2005, 2008, 2012
Namibia August-September 2014 1999, 2003, 2006, 2008, 2012
Niger April 2015 2013
Nigeria December 2014-January 2015 2000, 2003, 2005, 2008, 2013
Sao Tome & Principe* July-August 2015 N/A
Senegal November-December 2014 2002, 2005, 2008, 2013
Sierra Leone May-June 2015 2012
South Africa August-September 2015 2000, 2002, 2006, 2008, 2011
Sudan June 2015 2013
Copyright © Afrobarometer 2016 21Months when Round 6
Country Previous survey rounds
fieldwork was conducted
Swaziland April 2015 2013
Tanzania August-November 2014 2001, 2003, 2005, 2008, 2012
Togo October 2014 2012
Tunisia April-May 2015 2013
Uganda May 2015 2000, 2002, 2005, 2008, 2012
Zambia October 2014 1999, 2003, 2005, 2009, 2013
Zimbabwe November 2014 1999, 2004, 2005, 2009, 2012
* Round 6 data from Morocco were not available at the time of writing but will be available by February 2016.
Copyright © Afrobarometer 2016 22Table A.2: Urban-rural disparities by country (% of enumeration areas with the
service)
Piped water Sewage Tarred/paved Cell phone
Electric grid
system system roads service
Urban Rural Urban Rural Urban Rural Urban Rural Urban Rural
Algeria 100 98 99 93 99 87 100 68 100 100
Benin 82 28 81 69 28 4 48 16 100 88
Botswana 100 71 100 77 63 7 92 54 100 97
Burkina Faso 69 12 100 78 49 3 57 5 100 91
Burundi 87 7 89 41 86 - 68 12 100 93
Cameroon 100 84 99 82 81 29 79 39 100 98
Cape Verde 100 96 96 72 80 9 100 88 100 91
Côte d'Ivoire 100 63 98 69 78 6 74 23 100 91
Egypt 100 100 100 100 100 74 99 85 100 98
Gabon 99 20 95 9 22 4 75 42 100 98
Ghana 98 68 89 47 78 25 61 39 100 87
Guinea 91 3 89 47 32 1 50 10 100 76
Kenya 99 74 70 33 41 2 100 95 100 97
Lesotho 98 36 100 72 50 1 71 53 100 95
Liberia 42 20 29 7 23 4 60 54 89 71
Madagascar 97 20 98 36 65 3 79 16 100 79
Malawi 98 29 84 14 16 - 48 41 100 98
Mali 97 10 100 26 43 4 59 14 100 88
Mauritius 100 100 100 100 87 12 100 100 100 100
Mozambique 93 26 82 16 45 4 33 6 81 63
Namibia 84 41 85 58 73 7 62 14 100 85
Niger 100 16 100 32 43 - 90 10 100 86
Nigeria 99 84 60 39 51 20 76 65 92 91
SãoTomé/Príncipe 97 77 90 97 26 24 89 90 96 93
Senegal 99 51 99 73 47 27 75 48 100 98
Sierra Leone 72 4 43 18 25 - 95 82 100 81
South Africa 98 89 98 67 95 14 85 23 98 94
Sudan 92 49 88 43 30 2 56 24 100 97
Swaziland 97 97 97 48 65 2 67 6 100 95
Tanzania 83 24 71 15 26 - 95 83 100 88
Togo 95 33 92 30 24 15 39 20 100 98
Tunisia 99 100 98 72 87 30 86 65 100 96
Uganda 83 29 70 21 33 3 25 15 NA NA
Zambia 95 20 80 8 40 1 68 35 100 88
Zimbabwe 95 42 92 5 92 2 88 28 100 94
Average 93 44 88 46 57 10 76 38 99 89
Copyright © Afrobarometer 2016 23Other Round 6 global releases
Where to start? Aligning sustainable development goals with citizen priorities.
Bentley, T., Olapade, M., Wambua, P., & Charron, N. (2015). Afrobarometer Dispatch
No. 67. Available at http://afrobarometer.org/sites/default/files/publications/
Dispatches/ab_r6_dispatchno67_african_priorities_en.pdf.
Winnie V. Mitullah is director of the Institute for Development Studies (IDS) at the University of
Nairobi. Email: mitulla@uonbi.ac.ke.
Romaric Samson is assistant program manager at the Institute for Empirical Research in
Political Economy (IERPE) in Benin. Email: rsamson@afrobarometer.org.
Pauline M. Wambua is a MasterCard scholar pursuing a master’s degree in public policy in
the Department of Political Science at Michigan State University. Email:
wambuapa@msu.edu.
Samuel Balongo is Afrobarometer data manager for East Africa at IDS, University of Nairobi.
Email: sbalongo@gmail.com.
Afrobarometer is produced collaboratively by social scientists from more than 30 African
countries. Coordination is provided by the Center for Democratic Development (CDD) in
Ghana, the Institute for Justice and Reconciliation (IJR) in South Africa, the Institute for
Development Studies (IDS) at the University of Nairobi in Kenya, and the Institute for Empirical
Research in Political Economy (IREEP) in Benin. Michigan State University (MSU) and the
University of Cape Town (UCT) provide technical support to the network.
Core support for Afrobarometer Rounds 5 and 6 has been provided by the UK’s Department
for International Development (DFID), the Mo Ibrahim Foundation, the Swedish International
Development Cooperation Agency (SIDA), the United States Agency for International
Development (USAID), and the World Bank.
For more information, please visit www.afrobarometer.org.
Follow our global release updates on #VoicesAfrica on Twitter and Facebook.
Afrobarometer Dispatch No. 69 | 14 January 2016
Copyright © Afrobarometer 2016 24You can also read