Building resilience through disruption - New Zealand Ports and Freight Yearbook 2022 - Deloitte
←
→
Page content transcription
If your browser does not render page correctly, please read the page content below

Building resilience
through disruption
New Zealand Ports and Freight Yearbook 2022
New Zealand Ports and Freight Yearbook 2022 | Contents

Contents

                                      Welcome                          3

                             1. Supply chain context                   4

                        Supply chain: A year like no other

          Deloitte Access Economics: A year of disrupted recovery

                      Supply chain: National state-of-play

            2. In focus: Thought leadership from across Deloitte       21

              Supply chain resilience through digital technology

           ESG: Beyond relevance and risk to materiality and value

                  Decarbonising Aviation: Cleared for take-off

                  Wellbeing: Not a matter of luck, but design

                              3. Port sector insights                  36

                        Financial and operational trends

                        Comparator tables and analytics

                                  Port summaries

          4. Deloitte’s Infrastructure and Capital Projects Offering   67

                                      Glossary                         71

                                                                            2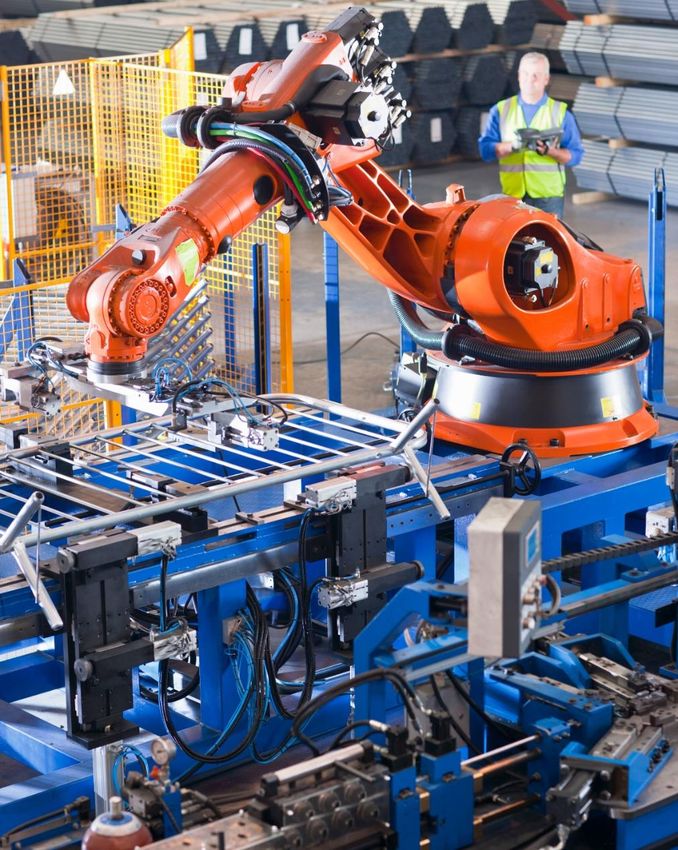
1. Supply chain   2. In focus: Thought leadership   3. Port sector insights   4. ICP
New Zealand Ports and Freight Yearbook 2022 | Welcome

Welcome

The Deloitte New Zealand Ports and Freight              As always, the Yearbook details operational and
Yearbook provides a concise snapshot of                 financial performance data for New Zealand’s
domestic port and freight activity. In addition,        major ports. For the second year, this data is also
we present insight into the global and domestic         presented via an interactive dashboard, which
environment, and a series of “in focus” thought         we encourage you to explore.
leadership pieces relevant to the sector.
                                                        We are pleased to release this Yearbook as part
In the past 12 months, the sector has been in           of Deloitte’s Infrastructure & Capital Projects
the spotlight like never before. Our Yearbook           (ICP) integrated market offering.
provides reflections and insights on the
                                                        Our domestic and global network of ICP
extraordinary year that was, but also keeps an
                                                        professionals allows us to bring together deep
eye to the future. We begin with commentary
                                                        skills and provide integrated solutions to all
on recent supply chain challenges and the
                                                        segments of the infrastructure sector and across
economic outlook. This section has been
                                                        the asset lifecycle.
prepared with contribution from Deloitte’s
specialist economic advisory team, Deloitte             If you have any questions, please reach out to
Access Economics, who have provided global              either myself or the other contributing authors.
and domestic economic insights. To accompany
                                                        We welcome your feedback and look forward to
our economic insights, we also provide an
                                                        future discussion and engagement.
overview of recent policy and other
developments touching on ports and freight.

Via a series of “in focus” pieces from across
Deloitte, we also present insights and guidance
on topics relevant to an increasingly complex
operating environment. These thought
leadership pieces include:

•   Opportunities to improve supply chain
                                                                            John Marker
    resilience through digital technology,
                                                                            National Partner
•   Perspectives on the changing nature of ESG                              Infrastructure & Capital Projects
    considerations,                                                         Auckland, New Zealand

•   Insights into workforce wellbeing, and

•   Insights into the decarbonisation of aviation.

                                                                                                                                                                                                       3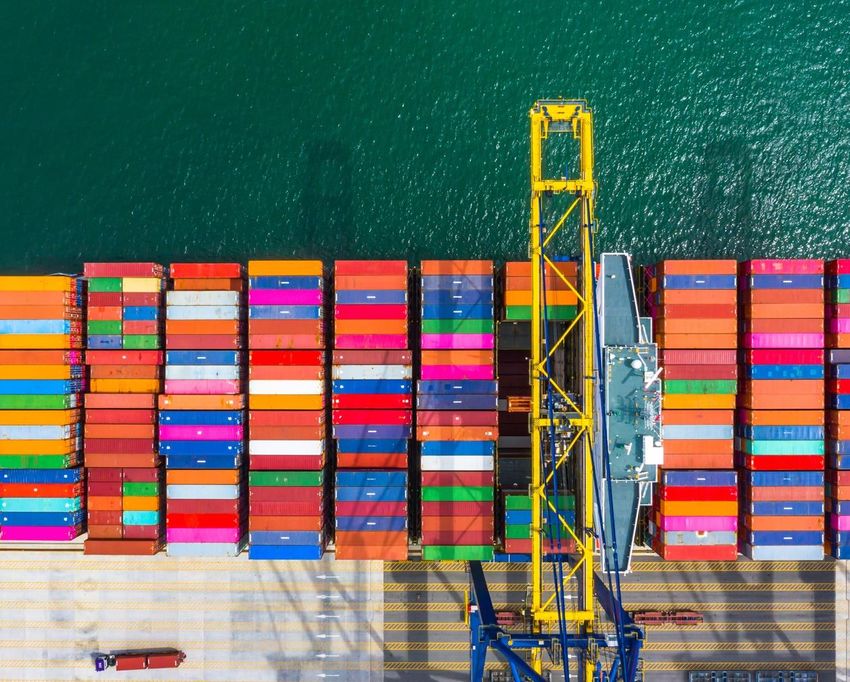
New Zealand Ports and Freight Yearbook 2022 | Supply chain context   1. Supply chain   2. In focus: Thought leadership   3. Port sector insights   4. ICP

  Supply chain context
  Strategic and economic
  insights

                                                                                                                                                            4
1. Supply chain   2. In focus: Thought leadership   3. Port sector insights   4. ICP
New Zealand Ports and Freight Yearbook 2022 | Supply chain context

Supply chain:
A year like no other
The domestic and global supply chain has been in focus like never
before. Supply chain woes are making headlines on a regular
basis, leaving little doubt that the pandemic has both highlighted
and exacerbated vulnerabilities of a ‘just in time’ supply chain.
The ports and freight sector is a key enabler of the supply chain,
which in turn impacts the performance of our economy and our
standard of living. While New Zealand has weathered the COVID-
19 pandemic relatively well, it has not been immune to impacts
on its supply chains. These effects are anticipated to persist in the
near term.

To set the scene for this Yearbook, we highlight some drivers of
disruption, both at a global and domestic level, and provide a
view of the outlook.

Authors

                          John Marker
                          National Partner
                          Infrastructure & Capital Projects
                          Auckland, New Zealand

                          Guy Finny
                          Manager
                          Infrastructure & Capital Projects
                          Auckland, New Zealand

                                                                                                                                                               5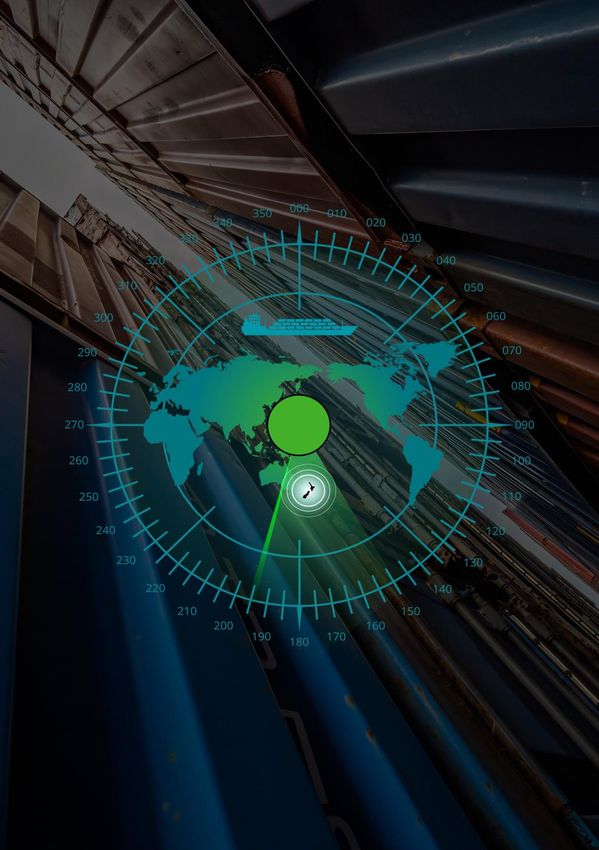
1. Supply chain    2. In focus: Thought leadership   3. Port sector insights   4. ICP
New Zealand Ports and Freight Yearbook 2022 | Supply chain context

A global supply chain under pressure

The impact of the pandemic has                                        Global container rates increased dramatically in
                                                                                                                                                         World Container Index
been significant                                                      2021 (see figure top right). The cost of
                                                                      international shipping has increased by up to ten                                  $12,000
Shipping capacity was idled in the early stages of
                                                                      times when compared with 2019 levels. While in
the pandemic. However, an unexpected surge in

                                                                                                                              US $ per 40 ft container
                                                                      recent months this has decreased slightly, rates                                   $10,000
consumer demand, combined with reduced
                                                                      continue to be well in excess of a pre-pandemic
capacity, as well as industrial action and COVID-                                                                                                         $8,000
                                                                      environment.
19 related disruptions at key international ports,
has caused ongoing congestion throughout the                          “The pressures have been relentless, with                                           $6,000                                                 Graph
global supply chain. This has had consequent                          logistics teams suffering sustained and systemic
flow on effects for New Zealand, being at the end                     global supply chain disruption, record port                                         $4,000
of international freight routes.                                      congestion, cargo delays, chronic capacity
                                                                                                                                                          $2,000
                                                                      shortages, breaches or near breaches of shipping
There is now an international shortage of
                                                                      contract commitments – and ocean freight rates                                            $-
containers and most available shipping capacity
                                                                      surging to extreme levels.” – Phillip Damas,                                               October         February        June 2020       October           February   June 2021         October
is in use. Schedule reliability is currently well
                                                                      Managing Director, Drewry                                                                    2019            2020                           2020               2021                        2021
below pre-pandemic levels (see figure bottom
right), reflecting congestion at major                                While operating costs for shipping lines have
international ports. This disruption continued                        increased (the cost of marine fuel more
throughout 2021, with reliability hovering                            than doubled in 2021), collectively the lines have
                                                                                                                                                         Global Schedule Reliability
between 33% - 35% in the past six months.                             made more profit in the last 12 months than at
Maersk recently estimated that between 12 to                          any other time in the last decade on the back of                                   90%
15% of current global capacity is void because of                     surging freight rates.2 AP Moller-Maersk
                                                                                                                                                         80%
slow vessel turnarounds.1                                             A/S, one of the world’s largest container
                                                                      shipping lines, reported EBITDA for 2021 of US$         Schedule reliability       70%
As a result of unreliable schedules, more vessels
                                                                      24 billion, compared to US$ 8 billion in 2020.                                     60%
are needed on the water to carry the same
amount of cargo. However, while ship orders                           During the pandemic, the cost of air freight has                                   50%
surged in 2021, significant additional capacity is                    become more competitive relative to sea freight.
                                                                                                                                                         40%
unlikely to arrive until 2023, as it takes an                         Pre-pandemic, the average price to move air
average of 18 months to build a container ship.                       cargo was 12.5 times more expensive than sea                                       30%
Container lines will also be wary of investing in                     shipping. In September 2021, it was only three                                     20%
excess additional capacity, recalling earlier boom                    times more expensive. However, air freight has                                                Jan      Feb       Mar       Apr       May     Jun       Jul      Aug     Sep       Oct       Nov      Dec
and bust cycles experienced by the industry.                          still faced capacity constraints as demand surged
                                                                      while capacity reduced.3                                                                                      2018                    2019                     2020                   2021

1. Maersk: https://www.maersk.com/news/articles/2021/11/23/asia-pacific-market-update-november
                                                                                                                                                         Source: Sea-Intelligence, GLP report issue 124
2. Bloomberg: https://www.bloomberg.com/news/articles/2021-09-12/the-world-s-shippers-are-earning-the-most-money-since-2008
3. IATA: https://www.airlines.iata.org/news/capacity-problems-but-cargo-still-strong
                                                                                                                                                                                                                                                                                 6
1. Supply chain      2. In focus: Thought leadership      3. Port sector insights     4. ICP
New Zealand Ports and Freight Yearbook 2022 | Supply chain context

Domestic impacts
Less reliable, more expensive
New Zealand is a minnow in the global supply                     different to their original destination as lines        In line with global trends, container rates to and                      Supply chain challenges are seeping into domestic
chain. Our ports and freight sector has been                     attempt to maintain international schedules.            from New Zealand have increased by up to six                            inflation. While shipping costs for imported goods
significantly impacted by disrupted international                                                                        times pre-pandemic rates, reflecting global                             (as a percentage of value) have eased in recent
                                                                 Local transport is required to shift to whichever
shipping and reduced air travel, compounded by                                                                           shortages of containers and limited shipping                            months, they remain significantly higher than pre-
                                                                 port has received offloaded goods, thereby moving
local COVID-19 impacts and domestic port                                                                                 capacity. However, commercial arrangements,                             pandemic levels (see figure below). Statistics New
                                                                 logistics patterns out of sync and further reducing
operational issues.                                                                                                      such as the Kotahi supply chain collaboration                           Zealand revealed transport prices also increased by
                                                                 effective capacity in the system. Capacity has also
                                                                                                                         initiative, have provided some insulation from                          15 percent in 2021, boosted by record petrol
In the past year, there has been strong domestic                 been constrained in the trucking industry by a
                                                                                                                         this.                                                                   prices. On average, the price of 91 octane petrol
demand for goods as well as ongoing demand for                   shortage of truck drivers.
                                                                                                                                                                                                 increased 30 per cent in Q4 2021, from $1.87 per
capacity from exporters. However, capacity has not                                                                       Ships are regularly arriving off window at New
                                                                 International vessels are also unavailable to                                                                                   litre to $2.45. Diesel prices increased by
kept pace due to unreliable shipping schedules and                                                                       Zealand ports due to the ongoing delays and
                                                                 undertake key coastal shipping services and are                                                                                 approximately 50 percent in 2021.
congestion at key New Zealand ports. Airfreight                                                                          disruptions. Berth windows were suspended at
                                                                 less willing to take on empty containers, which has
capacity is also under pressure, notwithstanding                                                                         most main New Zealand ports in 2021. Media                              Cost pressures show few signs of abating, as we
                                                                 further exacerbated the impact to New Zealand’s
that government subsidies have kept capacity at                                                                          reports suggested it was taking up to three weeks                       look at the outlook of New Zealand’s supply chain
                                                                 supply chain.
90% of pre-pandemic levels, in light of strong                                                                           to move product from Tauranga to Auckland by                            over the page. Deloitte Access Economics, in the
demand.                                                          “We are at the mercy of some very large, global         truck, when it previously took three days. The                          next article, also provides insight into the impacts
                                                                 shipping lines, we don't have very much ability to      ongoing shortage of truck drivers and increasing                        of this disruption, and the global and national
Shipping unreliability for imports and exports has
                                                                 influence a lot of the global issues because of the     fuel costs in New Zealand could likely add further                      economic outlook.
had ripple effects throughout the domestic supply
                                                                 size of our country and position” – Harriet Shelton,    pressure to logistics costs.
chain. Due to shipping delays and congestion
                                                                 Manager, Supply Chain, Ministry of Transport
experienced, goods are being offloaded at ports
                                                                                                                          Shipping costs for imported consumer goods

                                                                                                                            14
                                                                                                                            12
                                                                                                                            10
                                                                                                                        %

                                                                                                                             8
                                                                                                                             6
                                                                                                                             4
                                                                                                                             2
                                                                                                                                 2015            2016              2017             2018             2019             2020             2021
                                                                                                                                                                      Sea %                Air %               Total %
                                                                                                                        Source: Stats NZ, RBNZ, Deloitte

                                                                                                                        Chart derived by taking the value of consumer merchandise imports including freight and insurance costs (CIF) and subtracting the reported
                                                                                                                        value for duty (VFD), which excludes these costs. It is expressed as a percentage of the VFD figure.
                                                                                                                                                                                                                                                                     7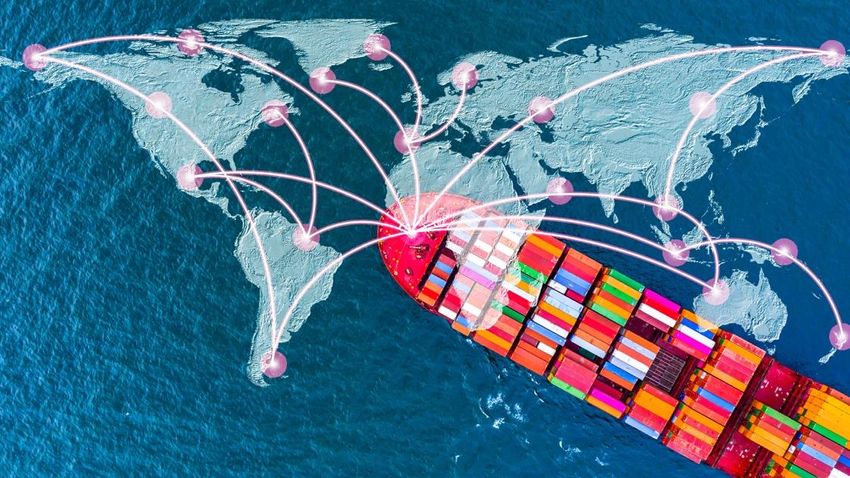
1. Supply chain   2. In focus: Thought leadership   3. Port sector insights   4. ICP
New Zealand Ports and Freight Yearbook 2022 | Supply chain context

‘Just in Time’ to ‘Just in Case’?

Outlook                                                        We expect firms will increasingly take risk
                                                               mitigation into their supply chain strategy going
The outlook for global supply chain disruption is
                                                               forward. This may involve diversifying suppliers,
the subject of debate. However, with the
                                                               including across geographies, near-shoring
pandemic unresolved, global logistics are likely to
                                                               manufacturing to key markets, or holding
be disrupted for another 12-24
                                                               additional inventory. Another mitigant could
months. Disruption has a cascading effect
                                                               include forming freight alliances. An increased
which takes a long time to resolve. At the time of
                                                               focus on digital technology will be also important
writing, the full impacts of the Omicron outbreak
                                                               to improve resilience and productivity.
have yet to be felt in New Zealand. The Russian
invasion of Ukraine is sending further                         Reflecting on observed supply chain constraints,
shockwaves through global supply chains as well                and in anticipation of environmental challenges
as driving up energy costs.                                    and commitments, the Government is working
                                                               on a national supply chain strategy, with a draft
A key driver of how quickly the supply chain
                                                               strategy to be completed by the end of 2022.
normalises will be consumer behaviour. If
consumer demand falls, and firms reduce                        At a national level, we are also seeing a greater
inventory, this may take pressure off the system.              focus on rail for the transportation of goods, as
However, elevated shipping rates are now                       well as a focus on coastal shipping. These policy
flowing into long term contracts between                       developments are discussed in more detail on
shipping lines and their customers. The hangover               pages 16 to 20.
from the disruption experienced in 2021 may
                                                               It remains to be seen if the sustained supply
continue for many years.
                                                               chain pressures will see a need to expand
A focus on resilience                                          investment in port-side and related
                                                               infrastructure. Major ports, such as Tauranga and
The issues affecting the New Zealand supply
                                                               Auckland, have plans underway for terminal
chain will likely only settle when wider
                                                               automations and other capacity enhancements.
international constraints on capacity are
                                                               Container depots have been at capacity and will
resolved. With that being said, there is a good
                                                               be looking to expand. However, firms may also
chance that the post-pandemic supply chain will
                                                               be reluctant to accelerate and expand
look different to the previous ‘just in time’
                                                               investment plans given the uncertain outlook.
approach, with businesses seeking to build more
resilience into their logistics operations.                    For better or worse, these are interesting times
                                                               for ports and freight in New Zealand.

                                                                                                                                                                                                           8
1. Supply chain   2. In focus: Thought leadership   3. Port sector insights   4. ICP
New Zealand Ports and Freight Yearbook 2022 | Supply chain context

Deloitte Access Economics:
A year of disrupted recovery
Ports and logistics infrastructure have been, and will               health and economic activity had a profound effect
continue to, play a key role in ensuring security of                 on global and domestic supply chains in particular,
supply of products into New Zealand, especially                      putting into sharp focus some of the vulnerabilities
given our limited domestic manufacturing                             of a “just in time” approach and a greater need to
capacity. This is especially important for                           shift to a “just in case” approach.
intermediate goods or specialised parts that
                                                                     In this article, we take a closer look at the
support wider economic growth.
                                                                     performance of the global and New Zealand
The COVID-19 pandemic and geopolitical tensions                      economy across 2021, providing insight into the key
continue to significantly impact economic activity                   events and factors driving economic performance
throughout the globe and in New Zealand. Over                        and trade.
2021, continued disruption has meant that shipping
                                                                     We also provide an overview of our outlook for
rates, availability, access and delay have all affected
                                                                     New Zealand over 2022 and beyond, and the key
the supply chain and impacted consumer access,
                                                                     issues facing the economy and the logistics sector.
choice and prices. We had a year of record high
inflation, oil and electricity prices, record low                    Our outlook is current as at 25 February 2022.
unemployment and migration and supply-chain                          Events are moving apace in New Zealand and
gridlock.                                                            abroad and our view may change as the impact of
                                                                     recent developments play out.
The disruption caused by COVID-19 and measures
taken by governments to support both human

Authors

                            Liza Van Der Merwe
                            Director
                            Deloitte Access Economics
                            Wellington, New Zealand

                            Mayuresh Prasad
                            Manager
                            Deloitte Access Economics
                            Wellington, New Zealand

                                                                                                                                                                                                                   9
1. Supply chain   2. In focus: Thought leadership   3. Port sector insights   4. ICP
New Zealand Ports and Freight Yearbook 2022 | Supply chain context

Global economy – A year of recovery
but doubts lie ahead
                                                                                                                               Percentage difference in regional GPD projections for 2021 - IMF
Delta and Omicron stall recovery                               Doubts lie ahead                                                WOE July 2021 versus January 2022
The global economy bounced back strongly at                    Despite the strong recovery in 2021, the global                                       2.0
the start of 2021, spurred on by increasing                    economy enters 2022 in a weaker position than                                         1.5
vaccination rates, easing of restrictions and                  previously expected. The IMF now projects that
                                                                                                                                                     1.0
significant fiscal and monetary stimulus.                      global growth will moderate from 5.9% in 2021

                                                                                                                              % point difference
However, the growth was not even across the                    to 4.4% in 2022, half a percentage point lower                                        0.5
globe, with vaccine access emerging as the                     than their projections in July 2021.                                                  0.0
principal fault line along which the global
                                                               The markdown is a reflection of earlier than                                         -0.5
recovery was split; those that could look forward
                                                               expected withdrawal of fiscal stimulus, continued
to normalisation of activities (most advanced                                                                                                       -1.0
                                                               supply shortages in the United States, and
economies) and those that still faced the
                                                               continued financial stress among property                                            -1.5                                                   2021 projections           2022 projections
prospect of resurgent infections.
                                                               developers in China.                                                                 -2.0
The emergence of the Delta and Omicron                                                                                                                     World     AE        US       EMDE      EDA       China       EDE        LAC      MECA        SSA
                                                               We now expect global growth is likely to be
variants has dulled what was expected to be a
                                                               lower than 4.4% with the risk of new COVID-19             Source: IMF World Economic Outlook July 2021 and January 2022
strong global economic recovery in 2021. The                                                                             Notes: AE = Advanced economies; US = United States; EDME = Emerging market and developing economies; EDA =
                                                               variants, further supply chain disruptions and            Emerging and Developing Asia; EDE = Emerging and developing Europe; LAC = Latin America and the Caribbean; MECA =
more transmissible Omicron variant has meant
                                                               inflationary pressures as a result of the Ukraine         Middle East and Central Asia; SSA = Sub-Saharan Africa
that many countries have had to reimpose
                                                               crisis.
restrictions, which are now gradually being                                                                          World goods trade volumes - Actual and projections
phased out.                                                    Trade mirrors global economy
                                                                                                                                             15.0                                                                       Forecast
                                                                                                                                                           Exports: Advanced economies
Growth in the Chinese economy also slowed                      Global trade rebounded strongly in 2021.                                                    Exports: Emerging market and developing economies
down in the latter part of 2021 amid a property                UNCTAD expects global trade to reach US $28                                                 Imports: Advanced economies
                                                                                                                                             10.0
market correction. Decades of debt-driven                      trillion in 2021, a 23% increase on the previous                                            Imports: Emerging and developing economies
growth had stretched the nation’s developers                   year and 11% higher compared to pre-COVID-19          % change year on year
and recent policy tightening has impacted them.                levels. Global trade in goods also reached record                                   5.0
A slowdown in the property sector in China will                levels in the third quarter of 2021, reflecting the
have significant flow on effects to other parts of             dramatic shift of consumer demand from
                                                                                                                                                   0.0
the economy. China’s economy has also suffered                 services to goods due to the pandemic.
from increasing energy costs and shortages,
                                                               However, as with the global economy, the global
resulting in rolling blackouts for energy intensive                                                                                                -5.0
                                                               trade outlook looks patchy. Slowing economic
industries, disrupting manufacturing.
                                                               growth globally, energy costs, tightening fiscal
Overall, the International Monetary Fund                       and monetary policy and the crisis in Ukraine all                             -10.0
(IMF) projects the world economy to have grown                 mean that trade volume growth is expected to                                                   2018                  2019               2020                   2021                  2022
by 5.9% year on year in 2021.                                  moderate compared to 2021.                                      Source: IMF World Economic Outlook data October 2021

                                                                                                                                                                                                                                                                 10
1. Supply chain 2. In focus: Thought leadership 3. Port sector insights 4. ICP
New Zealand Ports and Freight Yearbook 2022 | Supply chain context
Global economy – Inflationary
pressures abound
Record levels of inflation Difficult decisions lie ahead Inflation and inflation targets
Inflation is back in the news for many countries At the onset of the pandemic, policy makers 12
across the globe. around all the world took to easing monetary 10.1
policy and expanding fiscal stimulus. This helped 10 Latest inflation reading Target
Measures by governments to stimulate prevent a sustained global recession, despite
economies through fiscal stimulus and loose lockdowns. Indeed, the strength of consumer 8 7.1
% year on year
monetary policy had the intended effect – demand for goods stemming from these policies
5.6 5.9
demand has been strong across most of the have caused, in large part, the global supply 6 5.4
4.9 4.8
globe and has centred on goods, rather than chains issues discussed, as supply chains were 4.0
services, given ongoing travel and movement 4 3.5 3.3
not able to ramp back up at the same pace as 3.0
restrictions. demand. 2.0 2.0 2.0 2.0
2.0 2.0 2.0 1.5
2
This surge in demand has come at the same time The sustained inflationary pressures worldwide,
0.8
as supply chain disruptions, which resulted in the and the presence of Omicron, present challenges -
increasing shipping costs described earlier. Rising for policy makers. While the supply and demand Brazil US Germany India France UK Italy Japan China New
energy and food prices have also recently added imbalances are likely to ease to some extent over Zealand
to costs, raising inflation rates across the globe. the course of 2022, it is clear that loose monetary Source: Refinitive Datastream, Statistics New Zealand
Consumer prices were up 7.5% in January in the policy and fiscal stimulus cannot carry on as is in
United States and Europe from the year prior. many countries.
The inflation figure in the United States is the Crude oil price (Dubai)
highest since the early 1980s. Energy prices were The global policy response to sustained inflation
100
also up 27% from a year earlier in the United is unlikely to be synchronised as it was at the
States. In New Zealand, the Consumer Price Index onset of the pandemic. Individual countries are 90
(CPI) in the December quarter of 2021 increased likely to tailor policies to the specific inflationary 80
by 5.9% compared to the previous year. This was pressures they are facing as well as the extent of
$ USD per barrel
their economic recoveries. Policy makers around 70
the biggest increase in consumer prices since
1990 and was driven by housing, utilities and the world face the unenviable task of getting 60
higher prices for petrol. Since we prepared our ahead of inflationary pressures while avoiding
50
analysis, we note that oil prices have now sharp reductions in output and employment that
reached over US$ 140 a barrel following Russia's may derail economic recovery from COVID-19. 40
invasion of Ukraine, adding further inflationary 30
“With inflationary pressures intensifying and Omicron
pressure.
generating new uncertainties, monetary policymakers 20
Core consumer inflation – a measure that strips are facing new and challenging trade-offs” – IMF
10
out volatile fuel and food inflation – has also
Differing policies of key trading partners will -
been strong in several large economies such as
impact goods trade with New Zealand, with 3/01/2020 3/05/2020 3/09/2020 3/01/2021 3/05/2021 3/09/2021 3/01/2022
the United States, United Kingdom and Canada.
faster and more sharp policy tightening acting to
Source: Ministry of Business, Innovation & Employment Oil Statistics
dampen demand and trade volume growth.
111. Supply chain 2. In focus: Thought leadership 3. Port sector insights 4. ICP
New Zealand Ports and Freight Yearbook 2022 | Supply chain context
New Zealand economy – Another
year of disruption
New Zealand GDP – Actuals and forecast
15% Forecast
10%
Quarterly percentage change
COVID-19 continues to disrupt Rising inflation and interest rates 5%
The Delta and Omicron variants disrupted what Heightened demand from loose monetary policy
promised to be strong economic recovery from and fiscal stimulus, supply chain disruptions, a 0%
the onset of COVID-19. Growth in the June 2021 tight labour market, and strong wage inflation
quarter was up 17.4% on the previous year, have all led to strong inflationary pressures. The -5%
reflecting a strong rebound from the previous Consumer Price Index hit 5.9% in the year to
year's lockdown, and was driven by the services December 2021 – a level not seen since 1991. -10%
sector and the “travel bubble” with Australia. The quarter prior it was 4.9%, which was the
fastest annual price increase since 2008
However, the Delta induced lockdown meant -15%
(excluding GST hikes).
that the economy shrank by 3.7% in the 2016 2017 2018 2019 2020 2021 2022 2023 2024 2025 2026
September quarter of 2021. Despite the Trimmed-mean measures – the average rate of Source: Statistics New Zealand; Deloitte Access Economics
September decline, economic activity inflation after ‘trimming away’ price changes at
outperformed market expectations, reflecting both ends of the distribution – show headline OCR - Actual and forecast
the fact that both firms and consumers were inflation is backed by high underlying core
4.0% Forecast
much better prepared to deal with lockdowns inflation, with quarterly growth varying from
than expected. 1.4% to 1.7% in December 2021. Inflationary 3.5%
pressure is also coming from both tradable and
New Zealand is now much more match fit for non-tradable goods, each increasing at a 3.0%
fighting COVID-19 in 2022 than previously, due in quarterly rate of 1.3% and 1.4%, respectively.
large part to high vaccination levels and a move 2.5%
away from a “zero COVID-19” strategy. We There is increasing pressure on the Reserve Bank
Rate
forecast the economy to grow in 2022 with of New Zealand (RBNZ) to increase rates and 2.0%
border restrictions easing and more positive bring inflation down to its 1-3% target band,
notwithstanding the current Omicron outbreak. 1.5%
consumer and business sentiment under the new
COVID-19 strategy. However, the spread of Indeed, the RBNZ did just that in February, 1.0%
Omicron means that economic growth will be raising the Official Cash Rate (OCR) by 0.25 basis
slower in the near term. Other factors shaping points to 1%. Given the persistent inflationary 0.5%
this slower near-term outlook include ongoing pressures and low employment, we expect the
labour shortages, supply chain disruption, RBNZ to continue to raise the OCR, which is likely 0.0%
Mar 2016 Sep 2017 Mar 2019 Sep 2020 Mar 2022 Sep 2023 Mar 2025 Sep 2026
heightened inflation and policy responses to to reach more than 3% by the end of 2023.
increased interest rates. Source: Reserve Bank of New Zealand; Deloitte Access Economics
121. Supply chain 2. In focus: Thought leadership 3. Port sector insights 4. ICP
New Zealand Ports and Freight Yearbook 2022 | Supply chain context
New Zealand economy – Labour
shortages to dominate
Net migration, seasonally adjusted
600
Departures Arrivals Net
500
400
Continued border closures Tight labour market
300
000’s
Borders remained essentially shut throughout New Zealand has been in the grips of an acute
2021, continuing restrictions instigated in early labour shortage throughout 2021. The latest 200
2020 at the onset of the pandemic. Prior to 2020, Quarterly Survey of Business Opinion (QSBO)
net migration had been a key driver of population indicates that 73% of firms are having difficulty 100
change and dynamics. New Zealand’s population finding skilled workers, while 60% are struggling to
0
had grown around 2% each year prior to 2020. We find unskilled workers, driven by border closures
now expect the growth rate to hover around 1% over the past two years. The shortage of labour -100
between 2021 and 2024. This lower growth rate is has been broad based, affecting most sectors of 2010 2011 2012 2013 2014 2015 2016 2017 2018 2019 2020 2021
largely driven by the substantial decline in the economy.
Source: Statistics New Zealand
migration, which has fallen significantly as a result
Unemployment continued to fall over 2021. The
of border closures. Net migration was the lowest
in nine years and was negative for the first time
unemployment rate fell to a record low of 3.2% in Unemployment rate
the December quarter of 2021, down 0.2% on the
since 2012. 5.5
September quarter. Wage inflation (measured by
Low net migration can hinder economic growth. the labour cost index) increased by 2.6% over the Forecast
With New Zealand’s population ageing, the year to the December quarter in 2021, reflecting 5.0
proportion of those aged 15-64 (i.e. the working businesses’ willingness to raise wages to attract
age population), is likely to shrink – especially if and retain staff. We expect wage inflation to grow
there are fewer migrants to bolster the workforce, at 3.2% annually in 2022, driven by businesses 4.5
capping the ability of firms to invest and grow. desire to attract staff and increasing living costs. %
With the government signalling the easing of We forecast the unemployment rate to remain 4.0
border restrictions recently, we expect net low throughout 2022. We do not expect relaxing
migration to rise slightly from March 2022 border restrictions to be an immediate cure for
onwards and recover from the lockdown induced the widespread labour shortages many businesses 3.5
lows, provided no further delays or changes to are facing, as we expect there to be outward
border settings are announced or required. migration from those whose overseas plans have
3.0
been put on hold. Over the longer term, we 01/03/2016 01/03/2019 01/03/2022 01/03/2025
expect unemployment to rise gradually, reaching
4% in 2025. The Ukraine crisis has the potential to Source: Statistics New Zealand; Deloitte Access Economics
increase the unemployment rate even further.
131. Supply chain 2. In focus: Thought leadership 3. Port sector insights 4. ICP
New Zealand Ports and Freight Yearbook 2022 | Supply chain context
New Zealand economy –
Port activity shows signs of recovery
Trade volumes largely mirror economic recovery
The recovery of the global and New Zealand economies, due to increasing vaccination rates in the early part of 2021 and stimulatory policy, led to strong consumer demand, especially for goods. This recovery
has been mirrored in port activity over 2021, with import and export volumes recovering from the downturn experienced in 2020 in the selected ports below, except for import volumes for Whangarei and
Nelson. However, the emergence of the Delta and Omicron variants appears to have dulled what would have been stronger recovery. Shipping supply chain disruptions will have also hampered the recovery as
well. The outlook for trade and port activity for 2022 looks weaker. Tightening policy to rein in inflation locally and in key trading partners, such as in Australia and the United States, the faltering economy in
China, and the current Ukraine crisis, can be expected to moderate trading activity.
Auckland - Change in trade volumes Tauranga - Change in trade volumes Christchurch (Lyttelton) - Change in
relative to 2019 relative to 2019 volumes relative to 2019
10% 5% 10%
10%
0% 0%
% change
% change
0%
% change 0% 0% -3%
-10% -4% -3% -10%
-10%
-7%
Exports Exports -11%
-20% Exports
Imports -20% -20%
Imports Imports -18%
-21%
-30% -25% -30% -30%
-40% -34%
-40% -40%
2020 2021 2020 2021 2020 2021
Whangarei - Change in trade volumes Napier - Change in trade volumes Nelson - Change in trade volumes
relative to 2019 relative to 2019 relative to 2019
13%
9% 10%
10% 10%
0%
0% 0%
% change
% change
% change
-1% -2% -10% -4%
-10% -10%
-9%
-14% -12% -20%
-20% Exports -20% Exports -18% -18%
Imports Imports Exports
-30% -30%
-30% -27% Imports
-29%
-40% -40%
-40% 2020 2021
2020 2021 2020 2021
Source: Statistics New Zealand; Deloitte Access Economics
Notes: Trade volumes refer gross weight (tonnes) of exports and imports
141. Supply chain 2. In focus: Thought leadership 3. Port sector insights 4. ICP
New Zealand Ports and Freight Yearbook 2022 | Supply chain context
Risk of modern day stagflation ahead
As a result of pandemic-related challenges, which will intensify with Striking the right balance between inflation and We note that transitioning to a “just in case” approach is likely to
the current Ukraine crisis, we expect slow economic growth to growth impose costs, which may include necessary investment in
coincide with rising inflation - this brings the risk of modern day warehousing capacity, local manufacturing capacity, costs of
The RBNZ faces the unenviable task of reining in rampant inflation
stagflation (i.e. a combination of rising inflation and slow growth). holding extra working capital and obsolescence risks. Such costs of
in the midst of the ongoing COVID-19 outbreak and a slowing
promoting resilience in the system are likely to be borne by end-
Higher inflation and compromised supply chains global economy. The RBNZ has already indicated that it expects to
consumers.
raise rates higher and faster than previously expected.
Inflation and supply chain disruptions have been a key theme for
Supply chain disruptions have highlighted the benefits of a
New Zealand and the world. Idled capacity due to the pandemic However, it will need to take care not to unnecessarily put the
diversified supply chain, including local manufacturing and access
and buoyant consumer demand, especially for goods, led to the brakes on the New Zealand economy. Careful consideration of
to a broad range of imported supplies which together promote
elevated shipping rates and the drop in reliability described developing global economic conditions, particularly relevant to the
resilience. A key advantage is ensuring products continue to be
previously. logistics sector, will be crucial.
available in New Zealand during periods of intense supply chain
We expect consumer demand to moderate in 2022, given lower Building resilience in the logistics sector disruption. Supporting the transition to a “just in case” approach
projected economic growth, tightening monetary and fiscal will require the right policy settings and incentives.
The logistics sector faces some difficult decisions ahead. The effect
conditions and the prospect of elevated energy and oil prices. The
of COVID-19 on supply chains and recent geopolitical and trade
easing of travel restrictions worldwide may also revert consumer
risks made existing challenges in the logistics sector more
demand towards services, all of which may help alleviate the
prominent.
supply chain disruptions experienced over the past two years.
We expect firms to increasingly take risk mitigation into account for
However, the conflict in Ukraine and sanctions could further result
future supply chain strategies and investment, as well as
in disruptions to global trade flows, including energy supplies, and
considering ways of increasing productivity and reducing emissions.
potentially hamper the already burdened supply chains,
Careful forward planning, with a focus on technology and supply
contributing to further inflation risks.
contracts with strategic companies, is likely to be key into the
future, especially given the uncertain economic outlook.
COVID-19 has brought into sharp relief the importance
of ports and logistics infrastructure in ensuring security
of supply of products into New Zealand. Difficult
decisions lie ahead for logistics organisations on how
risk and resiliency are managed going forward.
Supporting the transition to a “Just in Case” approach
will require the right policy settings and incentives.
151. Supply chain 2. In focus: Thought leadership 3. Port sector insights 4. ICP
New Zealand Ports and Freight Yearbook 2022 | Supply chain context
Supply chain:
National state-of-play
Over the past year, the Government has progressed initiatives that
have an impact on ports and freight. Various plans and policies
affecting land transport have been released, with further initiatives
underway. The pandemic has shone a spotlight on the importance
of a resilient and sustainable supply chain. Key themes of resilience,
decarbonisation and productivity are seen across key policy
initiatives.
In the following pages, we provide context on the New Zealand
freight task and the role of each mode in the supply chain. We then
outline policy developments affecting key freight modes and the
wider transport sector. This includes developments in relation to rail
and coastal shipping, the Transport Emissions Action Plan and
developing a New Zealand Freight and Supply Chain Strategy.
Authors
John Marker
National Partner
Infrastructure & Capital Projects
Auckland, New Zealand
Guy Finny
Manager
Infrastructure & Capital Projects
Auckland, New Zealand
161. Supply chain 2. In focus: Thought leadership 3. Port sector insights 4. ICP
New Zealand Ports and Freight Yearbook 2022 | Supply chain context
Freight task
National Freight Demand Study (NFDS) Freight generation Southland are well-suited to dairy production, as is Canterbury if
suitable irrigation is available.
Key information in this section has been drawn from the National Clear patterns are evident in domestic freight flows. Primary
Freight Demand Study (NFDS). The NFDS forms an important role in producing areas generate flows to export ports, typically via This is similar for forestry, where warm climate and lower-value land
understanding current and future freight patterns in New Zealand. processing facilities. Population is a major driver of both consumption have attracted substantial plantings in Northland, Waikato, Bay of
However, the most recent report was commissioned in 2019 and and manufacturing activity. Plenty, Gisborne, Hawkes Bay, and Tasman / Nelson / Marlborough.
focussed on 2017/2018 data, and as a result the study is becoming
The “Golden Triangle” (Auckland, Waikato, Bay of Plenty) combines Crude oil flows are either a direct export (from Taranaki) or direct
increasingly outdated and has been covered in our previous
both population and primary industry production (forestry and dairy) import (to Marsden Point in Northland). Domestic transport of
Yearbooks.
to account for 45% of all freight tonnage produced. petroleum products is primarily from the Northland refinery via
A detailed overview of the 2019 NFDS findings can be found in our pipeline and coastal distribution, with a rising direct import share,
Canterbury is the dominant freight generator in the South Island
2021 Ports and Freight Yearbook at page 36. and then by truck to the nation’s service stations.
producing 15% of the national freight task.
Total freight task Manufacturing and retail freight tonnage correlate strongly with
Cement is manufactured at a plant in Northland for distribution by
coastal ships and then road and rail. Cement was also manufactured
Within New Zealand, an estimated 280 million tonnes of freight is population, notably in Auckland and Canterbury, which host
in the West Coast of the South Island but this has been superseded
moved by trucks, trains and coastal shipping. The majority of the manufacturing hubs, large scale distribution centres, and receive
by direct import.
freight is moved by road, with 93% of the total tonnes moved with consumer goods through their ports.
trucks, with rail and coastal shipping forming up the remainder at Southland hosts the Tiwai Point Aluminium Smelter which generates
The primary sector is located in regions offering favourable
approximately 6% and 2% of total tonnes moved respectively. import and export flows.
topography, climate, and soil. Waikato, Taranaki, Manawatu, and
171. Supply chain 2. In focus: Thought leadership 3. Port sector insights 4. ICP
New Zealand Ports and Freight Yearbook 2022 | Supply chain context
Key transport modes
By ship By road New Zealand’s Ports and Rail Network
Shipping supports over 99% of New Zealand's The majority of the freight is moved by road,
international trade by volume. Coastal shipping with 93% of the total tonnes moved with trucks.
also plays a key role in New Zealand’s domestic Road freight movements tend to be localised,
freight task, being principally specialist bulk ships with about 77% of freight (tonnes) remaining
(such as petroleum and cement) and inter-island within the region from which it was sourced, and
Roll-on Roll-off (RORO) ferries. In the general an additional 14% being transported to an
freight market, domestic ship operators are adjacent region. 1 There is very little movement
confronted by two key challenges; competition of freight by road between the North and South
with other transport modes (road, rail and air) Islands. Road freight’s core advantage is the
and competition with international ship ability to offer faster, more reliable, and flexible
operators. freight services.
Cargo can be delivered to most parts of the
While coastal shipping provides slower transit
country by road within 24 hours, and to all parts
times relative to other modes, it does deliver
of the country within 36 hours.
lower emissions. Only 1.6% of freight volumes
within New Zealand are transported by coastal Despite heavy vehicles making up only 3.5% of
shipping, however coastal capacity can be readily vehicle fleet in New Zealand, they are significant
expanded and requires limited additional port contributors to our total transport emissions as
infrastructure. highlighted in the Green Freight Strategic
Working Paper.1
By rail By air
Rail transports approximately 6% of freight Air freight makes up a significant proportion of
volumes within New Zealand (2019 NFDS). Over value, 16% of export value and 24% of import
the years, rail infrastructure has deteriorated value in 2019, for a comparatively small
with limited investment provided to the sector. proportion of volume, 0.3% of export tonnage
Despite its comparatively lower transport and 0.4% of import tonnage. Domestic air freight
emissions, moving freight via rail is slower than volumes were so small that they were not
by road and greater volumes of cargo must be included in the 2019 NFDS figures.
aggregated to maximise their utilisation on each
journey. In 2021, 20 million tonnes of freight was
moved by rail, which is on par with 2019 rail
freight volumes and a slight increase from 18.4
million tonnes in 2020.
1. Ministry of Transport, 2020 Green Freight Strategic Working Paper, 2020; accessible at: https://www.transport.govt.nz/assets/Uploads/Paper/Green-Freight-Strategic-Working-Paper_FINAL-May-2020.pdf
181. Supply chain 2. In focus: Thought leadership 3. Port sector insights 4. ICP
New Zealand Ports and Freight Yearbook 2022 | Supply chain context
Developments affecting key transport modes
Rail has released the ‘Coastal Shipping Investment Approach
State-of-Play’ report, which will inform how the $30
Rail has been a priority transport focus for the
million of funding for coastal shipping will be
Government. In recent decades, the national rail
apportioned. Suggestions from the report include
network has deteriorated with limited investment
assisting or underwriting the deployment of additional
provided to the system outside of the urban passenger
coastal vessels, pilot projects for alternative fuels and a
networks. To address this, the Government released the
feasibility study of Manukau Harbour as a hub port.
New Zealand Rail Plan in 2021, which provides the vision
Waka Kotahi intend to engage with the coastal shipping
for rail over the next decade and the investment
sector in 2022 to discuss the next steps, including
priorities for the system, and has introduced a new long-
applications for funding.
term planning and funding framework for the rail
network. In 2021, government-owned KiwiRail announced it had
entered into contracts for two new inter-island ferries,
Since 2017, over $6 billion has been committed to rail to
anticipated to enter service in 2025. KiwiRail’s
support investment and resilience in New Zealand’s rail
competitor, StraitNZ, which owns the Bluebridge ferry,
network. The Government's 2021 Budget reinforced the
was recently sold to Morgan Stanley Infrastructure
importance of rail investment, by providing $1.3 billion
Partners. The ferry and freight company, was sold by CPE
in funding for operating and capital expenditure.
Capital in December 2021, and transacted for more than
The aspiration is for New Zealand’s rail network to $500 million.
provide modern transit systems in our largest cities, and
to enable increasing volumes of freight to be moved by
Aviation
rail. By 2052, freight tonnage moved by rail is expected Over the last two years, the Government has spent more
to have increased by more than 40 percent. The rail than $700 million subsidising freight flights in and out of
network is projected to play a larger role in supporting the country to ensure international trade links stay
this growth than in prior years. While rail’s mode share open. The current MAIC (Maintaining International Air
was impacted by the 2016 Kaikōura earthquake and a Connectivity) scheme began in May 2021 and provides
subsidies to airlines to continue to provide set routes.
reduction in coal traffic, the rolling 12 month tonnage
total for rail is now well above 2016 levels. Securing sufficient air freight capacity in 2022 is
expected to be challenging. Estimated weekly demand
Coastal Shipping for air freight is 4,400 – 4,800 tonnes, with an estimated
The Government Policy Statement on land transport weekly shortfall of 273 tonnes.2 The MAIC scheme is set
2021 established a coastal shipping activity class for the to cease in March 2022, however Cabinet is considering
an extension at the time of writing. The planned
first time. Waka Kotahi New Zealand Transport Agency
reopening of the border will also help sustain capacity.
2. RNZ,Signs of few options for air freight to New Zealand next year - Govt officials, December 2021; accessible at:
https://www.rnz.co.nz/news/national/458483/signs-of-few-options-for-air-freight-to-new-zealand-next-year-govt-officials#:~:text=The%20MIAC%20%2D%20Maintaining%20International%20Air,2021%20to%20October%2031%202021.
191. Supply chain 2. In focus: Thought leadership 3. Port sector insights 4. ICP
New Zealand Ports and Freight Yearbook 2022 | Supply chain context
Other policy initiatives
National Supply Chain Strategy The Ministry of Transport intends to release an issues paper in early Shifting some of the freight task to less carbon intensive modes will
2022 for the Minister of Transport’s consideration. It is expected to help reduce emissions, including to rail and coastal shipping.
The Ministry of Transport is leading the development of the New
take two years for the strategy to be completed, with public and However, transitioning the heavy vehicle fleet to zero-emissions,
Zealand Freight and Supply Chain Strategy focusing on the next 15-30
targeted consultation planned for 2022 / 2023. which is the mainstay of the national supply chain, will be a
years. The strategy will provide an overview of the issues facing the
Decarbonisation significant challenge. In an interesting recent development, Fonterra
sector and aims to identify the best possible mix of investment,
announced it is deploying its first battery electric milk tanker as a
regulation, and other approaches to address these issues. The main Transport is the second largest source of greenhouse gas
pilot to help understand the potential for electric heavy transport.
drivers for change that the strategy will address are: emissions and contributes 20% of total domestic CO2 emissions.
Achieving zero emissions in transport is fundamental to the 2050 For aviation, the Government is proposing to do the following during
• Decarbonisation – Net zero carbon emissions by 2050 to meet
emissions reduction targets. its first emissions budget:
New Zealand’s climate change mitigation obligations.
The first New Zealand Emissions Reduction Plan, which will set out • work with the air transport industry to investigate the feasibility
• Resilience – Prepared for future threats and events including how the country will meet its first emissions budget, is due in May of sustainable aviation fuels,
extreme weather and other natural disasters, rising sea levels, 2022. The first emissions budget covers the 2022-2025 period. A large
national security, and disruption to supply lines. component of the plan will focus on the supply chain and transport. • support the establishment of an industry-led advisory body on
decarbonising aviation, and
• Productivity and innovation – While facing the challenges of In October 2021, the Government released a discussion document on
decarbonisation and resilience, adopt new technologies, access the Emissions Reduction Plan, which outlined two proposed targets • develop policy and regulatory settings to support the
skilled labour, ensure health and safety and support the economy for freight and the supply chain: development of zero-emission aircraft.
to grow. • reduce emissions from freight transport by 25 percent by 2035,
• Wellbeing – Freight investment and infrastructure provide and
broader benefits to people, communities, and the country. • reduce the emissions intensity of transport fuel by 15 per cent
by 2035.
20New Zealand Ports and Freight Yearbook 2022 | In focus 1. Supply chain 2. In focus: Thought leadership 3. Port sector insights 4. ICP
In focus
Thought leadership
from across Deloitte
211. Supply chain 2. In focus: Thought leadership 3. Port sector insights 4. ICP
New Zealand Ports and Freight Yearbook 2022 | | In focus
Supply chain
resilience through
digital technology
Businesses and society alike have truly felt the impact of COVID-19
through their respective supply chains and are constantly finding
alternatives to alleviate increasing pressure. Growing concern from
a broad set of stakeholders continue to influence organisations to
adapt, respond and take corrective action. With freight volumes
and cost predicted to increase in the coming years, fit for purpose
port and wider supply chain infrastructure is critical to ensuring
the supply chain performance meets expectations.
As we evolve into our new normal, focus should be placed on
building not only the physical infrastructure but also technology
solutions. Technology solutions like robotics and the IoT are
needed to increase productivity, resulting in more automated,
digitalised and connected supply chains. It helps the supply chain
transform from a simple logistics and transport operation to an
open and efficient community that can participate in the global
landscape of integrated world trade.
Authors
Paul Shallard
Partner
Operations Transformation
Wellington, New Zealand
Manek Marwaha
Senior Consultant
Operations Transformation
Auckland, New Zealand
221. Supply chain 2. In focus: Thought leadership 3. Port sector insights 4. ICP
New Zealand Ports and Freight Yearbook 2022 | In focus
Digitisation of the supply chain is gaining momentum, both as
a response to the pandemic and underlying structural forces
Responding to short term Renewed focus on building relationships through
disruption transparency has been a key catalyst for the
success of many throughout the pandemic.
COVID-19 had a profound impact on our economy
Supply chains which were originally multi-tiered
as the ports and freight industry became
and complex have now shifted to become a tight
disrupted. The pandemic highlighted existing
knit supply chain that is capable of responding to
practices lacked resilience and the ability to adapt
unexpected/fluctuating demand shocks.
quickly. The challenge during the pandemic has
been to effectively deploy the appropriate digital The closure of international and domestic
solutions (i.e. Internet of Things (IoT), blockchain, borders, particularly at airports, meant that
automation and artificial intelligence (AI)) to organisations had to revert to other flexible
mitigate disruption and create resilience – while modes of transport to deliver goods across the
delivering value to all stakeholders. entire value chain. Ports were handed greater
responsibility to not only control the inbound
The economic downturn took a huge toll on
and outbound flows but also rethink how to
businesses and society as unemployment rates
minimise the negative externalities.
grew to new heights along with other major
setbacks. Implications evolved as organisations Structural drivers of change
searched for new alternatives to grow revenue
A focus on digitisation has been underway for
while limiting their FTEs. At the demand end,
many years now as the supply chain has sought
retailers were severely impacted as consumers
to improve efficiency and reduce costs. The
looked to create extra buffer stock due to the
pandemic has highlighted the importance of
disruption caused, prompting organisations to
digital technologies in also securing supply chain
rethink their fulfilment and inventory strategies.
resilience.
Protectionism added an additional layer of
complexity and opportunity with many Another key driver of change is the global
relocating supply inside their own borders closer transition to a cleaner and greener supply chain.
to markets. In the maritime domain, increased international
maritime environmental regulations for sulphur
Shortages in resources is becoming a common
emissions, greenhouse gas emissions, and
theme across many countries as organisations
marine organisms and ship recycling will affect
look to optimise and build resilience into their
the industry. Ports are looking to minimise the
supply chain. As we emerge into our new
environmental impacts of their operations, with
normal, supply chains are presented with a wide
land transport also under pressure to
range of choices in which trade-offs between
decarbonise.
investment in physical capital and digital
technology will need to be evaluated.
231. Supply chain 2. In focus: Thought leadership 3. Port sector insights 4. ICP
New Zealand Ports and Freight Yearbook 2022 | In focus
Technologies supporting efficient, resilience supply chains
Momentum is likely to build as many begin to see the value technology can play in various allowing the wider ecosystem to withstand future shocks but also limit their carbon footprint. The rise
touchpoints of the supply chain. We are seeing adoption of digital technologies such as artificial of technology and adoption in many countries means investments must be made carefully considering
intelligence (AI), blockchain, automation and the Internet of Things (IoT) in pursuit of tackling some of the trade-offs to ensure the intended outcomes are achieved.
the challenges highlighted by the COVID-19 pandemic, with organisations seeking to decrease lead
While New Zealand to date has kept pace with the advancement, it does not want to be left behind
times, reduce cost and minimise waste in the supply chain. As a result, investments in physical supply
due to the benefits associated with digital technologies. For organisations to be successful with their
chain infrastructure are likely to decelerate as investment towards technological solutions increases.
digital supply chain strategy over the coming years, key areas for focus are likely to be:
Characteristics that can make a supply chain “smart” are the use of IoT, AI, blockchain and robotics to
• Smart warehousing and logistics that are safe & secure for all employees.
improve processes. These four solutions can deliver value to stakeholders in the following ways:
• Investment in the right technology advancements to enable holistic outcomes,
• Internet of Things (IoT) – to connect key assets and data to enable the development of smart
processes using a variety of software and hardware. • Greater transparency across multi-tiered networks allowing for greater collaboration, and
• Artificial Intelligence (AI) – uses machine learning to analyse big data, including historical data, • The right level of security to protect business data.
images and voice recognition.
Deloitte has deep experience in helping businesses understand their challenges in relation to
• Blockchain – an emerging tool in supply chains. A critical enabler for supply chain digitalisation, to digitisation and we regularly help business around the globe deploy these solutions across the
transform the typical analogue nature of the industry.
supply chain.
• Automation – not a new concept to the industry; a good example is the Ports of Auckland
implementing an automated container terminal.
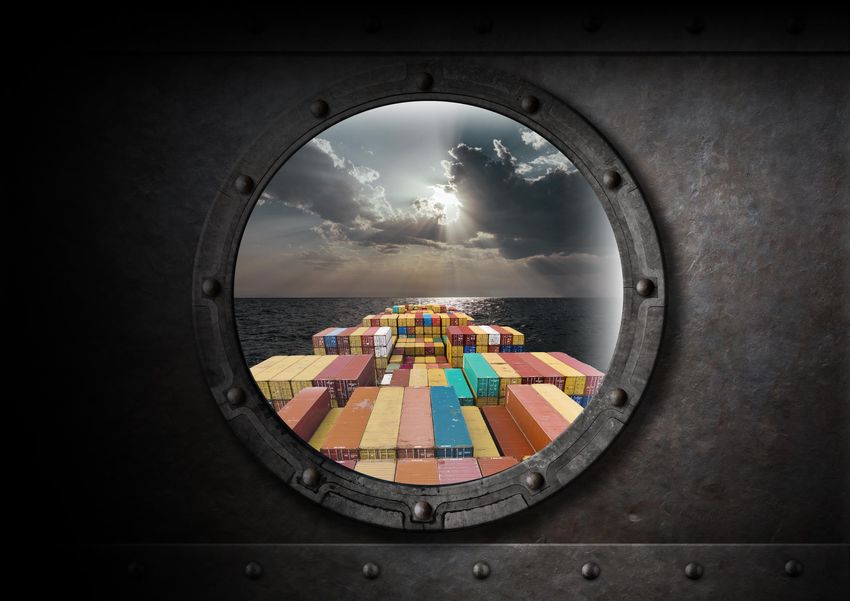
The figure below also identifies where digital technology can enhance each step of the supply chain.
Collaboration from all parties will be pivotal to the realisation of a digitally integrated value chain
Innovations across the value chain
Seaside Port Landside
Transport Maritime Approach Loading / Industrial Intermodal Hinterland
Producer Storage Dry Port
Node Transport Services Unloading Processing transport Transport
Virtual Reality Intelligent Asset RFID for Logistics Cross Functional Platform Solutions Smart Metering Smart Grids Autonomous Pricing Analytics Smart Cities
Development and Transportation Working Transport
Commodity and Data Big Data Analytics Outsourcing Collaboration Tools Machine to Machine Single View of Stock 3D Printing Drones / RoVs Collaboration tools Demand Analytics
Analytics Communication
Supply Analytics Autonomous Predictive Internet of Things Mobile Workforce Robotics Safety Analytics Supply Chain and Robotics Outsourcing
Transport Maintenance Vendor Optimisation
24You can also read