CAEE The case for agglomeration economies in Europe - Targeted Analysis 2013/2/1 Appendix C4: Barcelona Case Study | 30 June 2010
←
→
Page content transcription
If your browser does not render page correctly, please read the page content below
1

                  CAEE
The case for agglomeration
  economies in Europe
           Targeted Analysis 2013/2/1

Appendix C4: Barcelona Case Study | 30 June 2010
2

This report presents case study
results from the CAEE Targeted
Analysis conducted within the
framework of the ESPON 2013
Programme, partly financed by
the European Regional Devel-
opment Fund.

The partnership behind the
ESPON Programme consists of
the EU Commission and the
Member States of the EU27, plus
Iceland, Liechtenstein, Norway
and Switzerland. Each partner is
represented in the ESPON Moni-
toring Committee.

This report does not necessarily
reflect the opinion of the mem-
bers of the Monitoring Commit-
tee.

Information on the ESPON Pro-
gramme and projects can be
found on www.espon.eu

The web site provides the possi-
bility to download and examine
the most recent documents pro-
duced by finalised and ongoing
ESPON projects.

© ESPON & University of Man-
chester, 2010.

Printing, reproduction or quota-
tion is authorised provided the
source is acknowledged and a
copy is forwarded to the ESPON
Coordination Unit in Luxembourg.

3

          The Case for Agglomeration Economies in Europe (CAEE)
                      Barcelona City-Region Case Study

Malcolm C. Burns, Carlos Marmolejo, Josep Roca, Eduardo Chica and Jordi Freixas
    Centre of Land Policy and Valuations (CPSV), Barcelona Tech (UPC) and

                                Mariona Tomàs
         Department of Political Science, Universitat de Barcelona (UB)
4

Contents Page

Introduction:                                                       page 5

The administrative structure of the Barcelona city-region and the
evolution of metropolitan governance                                page 7

The Economic structure of the Barcelona city-region                 page 44

Conclusions                                                         page 81

References                                                          page 86
5

1. Introduction

The Barcelona city region case study report is one of the four city studies in the CAEE
project. This project forms part of the ESPON 2013 programme and is a ‘targeted analysis
based on user demand’. The user demand, in this instance, came from four key policy-making
and delivery bodies (the “policy stakeholders”) based in Manchester, Barcelona, Dublin and
Lyon which, under the leadership of the Commission for the New Economy in Greater
Manchester, were interested in exploring the impact of agglomeration economies within and
beyond the territories they cover and the extent to which the beneficial impacts of recent
patterns of agglomeration have been shaped, and might be managed more effectively, by
public policies and programmes.

The policy stakeholders, in co-operation with ESPON, established a brief that was intended to
promote the achievement of a number of key objectives:
•            To provide an understanding of the sources of agglomeration within the four case
study areas, and outline whether there is a policy role for influencing agglomeration
economies;
•            To develop strategic policy options which ensure that agglomeration growth spills
over to benefit the wider regional economy, drawing as appropriate upon lessons from the
success and failures of past policy responses and looking at policy options that could
potentially help future growth.

The research consortium commissioned by ESPON on behalf of the four policy stakeholders
for the four cities have sought to achieve these objectives through specific, detailed, and
comparative case study-based analysis - in a way that provides a basis for the practical
assessment and development of strategic policy options. The policy stakeholder in Barcelona
                                                                                 1
is the Barcelona Provincial Council, through its Territorial Observatory             and the partner in
the research consortium is the Universitat Politècnica de Catalunya (UPC) through its Centre
de Polìtica de Sòl i Valoracions (CPSV) 2.

Through their individual case study research each city was required to explore a number of
common questions, paramount among which are:
•            Is it possible not only to identify ‘past policy responses’ to agglomeration processes
but also to judge whether they have broadly failed or succeeded?
•            Is it possible to specify particular policy levers, at various levels within governmental

1
    http://www.diba.cat/territori/default.asp
2
    http://www.upc.edu/cpsv/
6

systems that can be pulled in future in order to maximise the benign effects of agglomeration
and encourage spill-over effects in neighbouring areas?
•       Is it possible to judge the effect that governance arrangements in the target areas, and
not just policy choices, have on spatial economic performance, and
•       It is possible, on the basis of case study observations, to set out practical policy and
governance implications that can be taken up in other (national) contexts?

Interviews were conducted with leading city-regional stakeholders in selected policy areas
designed to assess the way in which the levels of autonomy they command have been used to
shape the reasons factors that influence agglomeration effects.

The first part of the report examines the administrative structure of the Barcelona city-region
and the evolution of metropolitan governance; while the second part focuses upon the
economic structure of the city-region in general, prior to a more detailed analysis of a number
of key economic sectors in order to reach an understanding of the effects of agglomeration
economies over the territory.

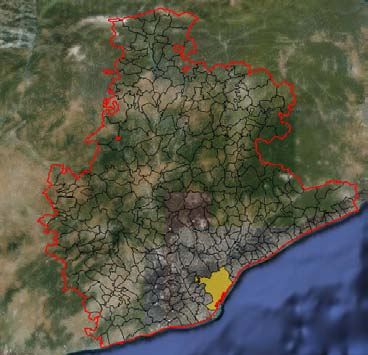
7

2. The administrative structure of the Barcelona city-region and the evolution of
metropolitan governance

The Spanish case reflects some special features because its political system changed relatively
recently to one of democracy after the Francoist dictatorship (1939–1975). The Spanish
Constitution of 1978 changed the basic territorial structure in Spain. As in some other
European countries, the decentralisation process has resulted in progressive rationalisation or
the rise of stronger levels of sub-national government (Keating and Loughlin, 1997). The
territorial model adopted was the State of Autonomies, where seventeen Autonomous
Communities (Comunidades Autónomas) have significant legislative and executive powers
over a wide range of areas – housing, urban and regional planning, agriculture, transport,
health, education, social welfare and culture – according to the terms of their individual
autonomy statutes. The Autonomous Communities (AC) have progressively achieved more
competences, demonstrated by trends in the distribution of public expenditure between
central, regional and local governments.

Article 137 of the Spanish Constitution states that: "The State is territorially organized in
municipalities, provinces and the Autonomous Communities that can be constituted: all those
entities enjoy autonomy in the management of their own interests". As a consequence there
are three levels of government: central, the regional tier (formed by the 17 Autonomous
Communities 3) and the local tier (formed by 8,113 municipalities and 50 provinces).

The treatment of local government in the 1978 Spanish Constitution is relatively brief, with
most of the articles being devoted to the newly created regions. The 1985 Local Government
Law (LBRL) specifies general principles regarding the territory, internal organisation and
functions of local government; the more concrete details are left to regional legislation. Each
Autonomous Community can determine its own local government arrangements, always
respecting the existence of municipalities and provinces, which have constitutional
recognition. This is why different local institutions are found, such as the comarcas (counties)
in Catalonia, Aragon or Galicia, Cabildos in the Canary Islands and Insular Councils in the
Balearic Islands 4 . The central government also determines the economic resources of
municipalities and provinces through the Law on Local Finances (Ley Reguladora de

3
 There are also two Autonomous Cities, Ceuta and Melilla, with fewer powers than the ACs.
4
 Bosch and Espasa (2006) identify a total of 12,943 local government units in Spain: 8,110 municipalities (N.B. increasing to
8,113 by 2010); 50 provinces; 1,070 supra-local entities comprising 10 cabildos and insular councils, 975 mancomunidades
(voluntary agreements between at least two municipalities), 81 counties and 4 metropolitan areas; 3,708 infra-local entities; and 5
other units.

8

Haciendas Locales, 1988).
In fact, as will be seen in the case of metropolitan areas, there is a share of competences
between central and regional governments in relation to the local level. Central government
sets the general legislation and then each Autonomous Community legislates its own
arrangements, respecting the general legislation.

The Barcelona city-region

For the purposes of this study, the Barcelona city-region is taken to be the spatial extent of the
Barcelona Province (NUTS3).

Map 1: (a) the city-region in the context of Catalonia; and (b) the spatial structure of the municipalities
of the city-region, highlighting the location of Barcelona.
Source: Institut Cartogràfic de Catalunya and own elaboration

However prior to examining the Barcelona city-region in detail, it is appropriate to make
some passing remarks concerning the city-region within the wider Spanish context. As part of
on-going monitoring of the Spanish urban system carried out on a periodical basis by the
Ministry of Housing, the most recent exercise positioned the urban area of Barcelona in
second place, after that of Madrid, in the list of 13 “large urban areas” 5 (Ministerio de
Vivienda, 2007). Work previously undertaken by ESPON leading to the identification of the
Functional Urban Areas (FUAs) and Metropolitan European Growth Areas (MEGAs) resulted
in both Madrid and Barcelona being classified as MEGAs and ascribed the description as
“European engines” 6 . Other Spanish MEGAs comprised Bilbao, Valencia and Palma de

5
  The list of large urban areas comprised Madrid, Barcelona, Valencia, Sevilla, Bilbao, Málaga, Central de Asturias, Zaragoza,
Alicante-Elche, la Bahía de Cádiz, Murcia, Vigo-Pontevedra and Las Palmas de Gran Canaria.
6
  The full list of “European engines” comprised Munich, Frankfurt, Madrid, Brussels, Milan, Rome, Hamburg, Copenhagen,

9

Mallorca, each described as “potential MEGAs”, and Sevilla as a weak MEGA (ESPON,
2004). Hall’s differentiation between a “political” and a “commercial” capital in relation to
Madrid and Barcelona is particularly fitting and perhaps poignantly indicates the raison d’etre
for the little relation between Spain’s two principal metropolitan urban regions (Hall, 2005).

The competences of provinces are principally those of offering technical support for the
municipalities and the coordination of supra-local services, especially for small
municipalities. They are also the electoral district for general elections and also for Catalonian
regional elections. Transfers from central government constitute the main economic resources
for provinces.

The Province, one of four within the Autonomous Community of Catalonia 7 , had a
population of 5,487,935 in 2009, distributed throughout a total of 311 municipalities and 11
counties, with an area of 7,728 km2. As can be seen from Table 1, over 50% of the population
of the city-region lies within 7 municipalities with populations in excess of 100,000
inhabitants. This population of more than 2.75 million is concentrated within 3.5% of the total
area of the city-region, focussed primarily on Barcelona (1.62 million) and two adjoining
municipalities [L’Hospitalet de Llobregat (253,782) and Badalona (219,547)], as well as
two important cities of the immediate hinterland [Terrassa (210,941) and Sabadell
(206,493)]. By contrast just over 20% of the population resides in 161 municipalities of less
than 20,000 inhabitants, distributed over more than 87% of the city-region. The remaining
29% of the population of the city-region lies within 37 towns and cities in the 20,000-100,000
range, spread over just 9.5% of the total area. Therefore the urban structure of the city-region
is clearly that of a significantly high proportion of the overall population concentrated within
a few small towns and cities, with a correspondingly small proportion of the population
spread out widely across the wider city-region as illustrated by Map 2.

Zurich, Amsterdam, Berlin, Stockholm, Stuttgart, Barcelona, Düsseldorf, Vienna and Cologne.
7
  The four Catalonian provinces comprise Barcelona (5,487,935 persons); Girona (747,782 persons); Lleida (436,402 persons)
and Tarragona (803,301 persons) contributing to an overall population of the Autonomous Community of 7,475,420 persons in
2009, and representing 16% of Spain’s total population.

10

Map 2: Population of the Barcelona city-region (2009)
Source: INE, own elaboration

Against this overall urban structure, there are many different interpretation of what constitutes
the metropolitan structure of Barcelona. From an administrative perspective two definitions
are used locally – one refers to the Metropolitan Area of Barcelona (AMB) and the other
refers to the Metropolitan Region of Barcelona (RMB). Neither of these corresponds, to
date, with an institutional level of government, as in the case of the province. These two
conceptions refer to a smaller territory than that of the province and concentrate higher urban
densities, while the province is a mixture of both urban areas of varying densities and rural
areas intrinsically linked to the urban areas.

The political future of the AMB could change in the following months. What this would
achieve would be to bring together the 36 municipalities or the first ring of the wider
metropolitan region that probably will be given a new instrument of governance if the Catalan
Parliament approves the Law of the Metropolitan Area of Barcelona (now at discussion
stage). It should be recognised that the urban continuity of these 36 municipalities which form
the central urban core of the city-region accounts for almost 60% of the total population. As
will be seen later, the objective of creating a single metropolitan authority gathering 36
municipalities is to put an end to the institutional fragmentation that has characterised the
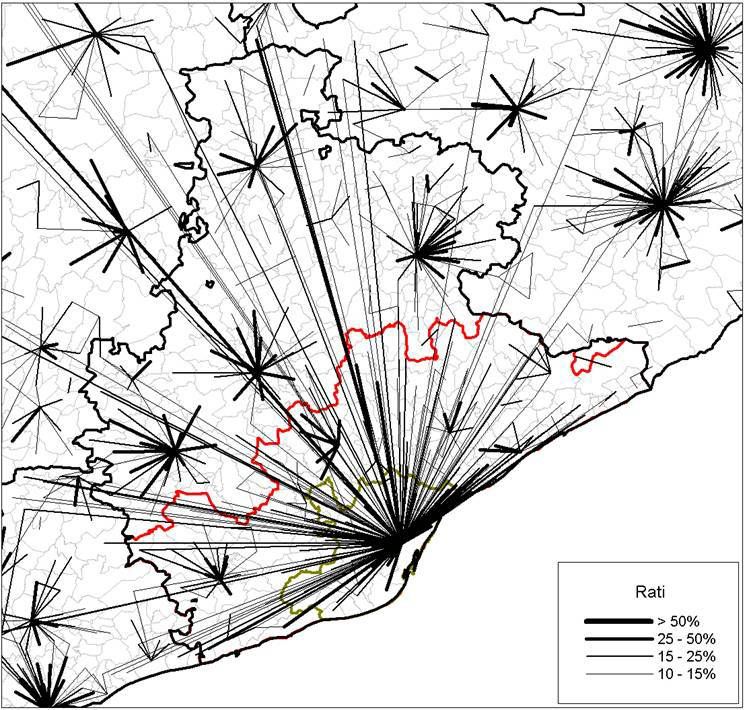
11

metropolitan area since 1987 with the demise of the former Metropolitan Corporation of
Barcelona (CMB). Although this will be discussed in depth in the section relating to
institutional capacity, it is worth remarking that spatial extent of the former CMB forms
another interpretation of the metropolitan structure of the city-region.

Population Municipalities % of total              Population     % of total         Area     % of total
   range                             muns.           (2009)          pop.           (km2)      area
200,000 <               5             1.61         2,515,556        45.84           240.6      3.11
 100,000-
  200,000               2             0.64          241,439          4.40           29.39      0.38
  50,000-
  100,000              12             3.86          824,511         15.02          305.93      3.96
  20,000-
   50,000              25             8.04          771,052         14.05          417.42      5.40
   5,000-
   20,000              86            27.65          880,936         16.05         1,749.78     22.64
  < 5,000             181            58.20          254,441          4.64         4,985.08     64.51
 TOTAL                311             100          5,487,935          100          7,728.2      100
 Table 1: Spatial structure of the municipalities of the Barcelona city-region (2009)
 Source: Own elaboration, INE

The RMB comprises 164 municipalities, being considered as the functional area of Barcelona
by urban planners, geographers and architects since the 1968 (Artal, 2002). At present it has
no institutional recognition, but this situation is at a turning point. Firstly, the territory of the
RMB corresponds to the Metropolitan Territorial Plan, which was approved by the
Regional Government on 20 April 2010. Secondly, these 164 municipalities correspond to a
new administrative level, the vegueria, which is proposed in the Catalan Law of Territorial
Organisation, at present on parliamentary commission (July 2010). If approved, the RMB will
become a level of decentralization of the Catalan Government, substituting the provinces.
However, to date it is unclear whether this law will be passed, owing to a) the lack of a
consensus about the territorial divisions proposed, and b) the fact that the Catalonian
Parliament cannot abolish provinces since they are constitutionally recognised and so this
reform would require the approval of the Spanish Parliament.

Other research relating to spatial dynamics within the wider metropolitan region has produced
alternative interpretations of the true extent of the functional metropolitan urban region of
Barcelona. An application of the methodology deriving from the Census Bureau of the
United States and based upon the statistical exploitation of travel to work data contained
within the 2001 Census of Population led to the delimitation of a metropolitan urban region of
Barcelona extending well beyond the north-eastern and south-western spatial limits of the
RMB and the Province (CPSV, 2001 and 2004; and Burns, 2008). The resulting metropolitan
12

urban region covered some 227 municipalities with an area of 4,796 km2. It had a population
of over 4.5 million persons in 2001, rising to over 5 million inhabitants by 2006.

While each one of the previously mentioned designations, be they formal or informal, relates
to territorial structures emanating from the core, in this case the municipality of Barcelona as
the political and administrative capital city of the city-region/province/region, it is important
to acknowledge the weight attached to the cities of the metropolitan arc8. The metropolitan
arc refers to a group of seven cities (Granollers, Martorell, Mataró, Sabadell, Terrassa,
Vilafranca del Penedès and Vilanova i la Geltrú) which were formerly known as the cities of
the second outer metropolitan ring. In 1992 these cities initiated a dialogue and the staging of
a number of meetings relating to the territorial issues of common interest. Each of these cities
lies within the spatial limits of the city-region and the seven cities had a combined population
of just over 730,000 inhabitants in 2009, representing over 13% of the population of the city-
region.

In order to understand the case of Barcelona it is important to take into account both the
evolution of the Spanish State and the internal dynamic of the city-region.

In Barcelona, as in many Spanish metropolitan areas, the twentieth century has witnessed a
steady migration process from rural to urban areas. The 1960s and the 1970s were the years of
greatest expansion of cities, including Barcelona, which reached 1.9 M inhabitants. From
1975 onwards the growth has continued, but its pace has been slower, and over the last two
decades urban areas have evolved towards a relative sprawl model. The present trend involves
an increasing consumption of land, a loss of population in central municipalities, and
increased growth occurring in metropolitan peripheries with relatively lower density patterns.

The population, spatial extent, density and political fragmentation of the Barcelona city-
region are illustrated in Table 2. The different definitions of the metropolitan reality are taken
into account and include the weight of the central city and each territory in relation to both the
city-region and the AC in their entireties:

8
    http://www.arcmetropolita.org
13
Territorial unit Population % of total % of total Area Density Admin.
(2009) population population (km2) (inhab./ Units(s)
of region of city- km2)
(Catalonia) region
(Province)
Barcelona 1,621,537 21.69 29.55 98.21 16,510.92 1 mun.
Former
metropolitan
corporation of 3,097,876 41.44 56.45 476.01 6,508.01 27 mun.
Barcelona
(CMB)
Metropolitan
area of 3,218,071 43.05 58.64 633.84 5,077.10 36 mun.
Barcelona 4 counties
(AMB)
Cities of the
metropolitan 730,810 9.78 13.32 211.71 3,451.94 7 mun.
arc
Metropolitan
región of 4,992,193 66.78 90.97 3,239.23 1,541.17 164 mun.
Barcelona 7 counties
(RMB)
Rest of the
Province 495,742 6.63 9.03 4,488.97 110.44 147 mun.
(excluding the 4 counties
RMB)
Province 311 mun.
(Barcelona) 5,487,935 73.41 100% 7,728.17 710.17 11 counties
1 province
Region 947 mun.
(Catalonia) 7,475,420 100% N/A 32,113.39 232.78 41 counties
4 provinces
Table 2: Portrait of the Barcelona city-region (2009)
Source: Own elaboration with data deriving from INE
The province of Barcelona represents almost 75% of the Catalan population and the City of
Barcelona just over 20%. However what is the weight of the central city in relation to the city-
region? Table 3 illustrates the differences in the distribution of population of the central city at
the three metropolitan scales: the metropolitan area, the wider metropolitan region and city-
region.
There are clear differences in the concentration of population in urban areas and the weight of
the central city (the City of Barcelona with 1.6 M inhabitants). This weight decreases when
taking into account the whole city-region, that is, the province of Barcelona. For this scale,
the central city means 30% of the total population.
Over half the 5.5 million inhabitants of the city-region live in 7 cities with 100,000
inhabitants or more. Almost 30% (1.6 million) live in the central city of Barcelona, with the14
remainder distributed amongst 6 other cities (L’Hospitalet de Llobregat, Badalona, Terrassa,
Sabadell, Mataró and Santa Coloma de Gramenet). Not all of these cities are immediately
contiguous - L’Hospitalet de Llobregat, Badalona and Santa Coloma de Gramenet are
physically adjacent to Barcelona and connected by subway. By contrast the other three cities
are located within the wider metropolitan region and are sub-centres of their own standing.
Metropolitan area Metropolitan region Province of Barcelona
(City-region)
Population No. of mun. % of total No. of mun. % of total No. of mun. % of total
range pop. pop. pop.
300,000 < 1 50.39 1 32.48 1 29.55
200,000- 2 14.81 4 17.91 4 16.29
300,000
100,000- 1 3.72 2 4.84 2 4.40
200,000
50,000- 7 15.41 11 14.98 12 15.02
100,000
20,000-50,000 11 11.85 22 13.45 25 14.05
5,000-20,000 11 3.486 63 13.84 85 16.05
< 5,000 3 0.33 61 2.507 182 4.64
Total 36 100.0 164 100.0 311 100.0
Table 3: Distribution of municipalities and population in the province of Barcelona, the metropolitan
region and the metropolitan area (2009)
Source: Own elaboration with data deriving from INE.
The remaining 50% of the population of the city-region is divided between 304
municipalities, with lower densities. Of these 304 municipalities, 182 have less than 5,000
inhabitants, representing less than 4.5% of the total population.
However it is important to recognise that over the period 1991-2009, some 35 municipalities
of the city-region underwent demographic growth of such a degree to increase their
population from under 5,000 inhabitants to place them in the 5,000-20,000 inhabitants range –
effectively constituting new urban sub-centres through their conversion from villages to
“small towns”. Of these 35 municipalities 5 lie within the limits of the metropolitan area
(AMB) 9, 24 within the limits of the remainder of the metropolitan region (RMB) 10, with the
remaining 6 within the hinterland or remaining area of the city-region 11. These 35 new “small
towns” constituted 4.7% of the city-region’s population in 2009. Over the same period some
twelve municipalities experienced demographic growth to change their status from “small
towns” (5,000-20,000 inhabitants) to “cities” (greater than 20,000 inhabitants) of the city-
9
Begues, Castellbisbal, Santa Coloma de Cervelló, Tiana and Torrelles de Llobregat
10
Ametlla del Vallès, Arenys de Munt, Bigues i Riells, Cabrils, Cubelles, Gelida, Lliçà de Vall, Matadepera, Palafolls, Polinyà,
Sant Andreu de Llavaneres, Sant Antoni de Vilamajor, Sant Esteve, Sant Feliu de Codines, Sant Fost de Campsentelles, Sant Pol
de Mar, Sant Vicenç de Montalt, Santa Eulàlia de Ronçana, Santa Margarida i els Monjos, Santa Maria de Palautordera,
Sentmenat, Sesrovires,Teià, Vacarisses and Viladecavalls
11
Artés, Masquefa, Moià, Sant Fruitós de Bages, Santpedor and Taradell15
region. Of these twelve new “cities” 2 lie within the spatial limits of the metropolitan area
(AMB) 12, 9 within the area of the remainder of the metropolitan region (RMB) 13 and just
one 14 within the remainder of the city-region. So the city-region has witnessed important
changes to its spatial and geographical structure over the past twenty years.
To sum up, the province of Barcelona gathers dense urban centres with small rural
municipalities; this is why it is seen as a “too large” administration for the metropolitan
reality. What will be seen later is that the municipalities of the metropolitan area have
developed their own networks of cooperation, separately from the province.
Besides, the city-region is fragmented in counties and other supra-local entities, as explained
in the next section.
Institutional fragmentation
The structure of local administration
The organisation of local government is a regional competence, shared with the central
government. Article 5 of the Statute of Autonomy of Catalonia states, "The Generalitat of
Catalonia shall divide its territorial organization into municipalities and counties
("Comarques"), although it may also set up larger administrative districts”.
In accordance with those provisions of the Statute, in 1987 the Parliament of Catalonia
approved the so-called "Territorial Organization Laws", than set up the local administrations
of Catalonia. According to this legal framework, Catalonia is territorially organized in
municipalities, counties and provinces. They are territorial entities; and each one is fully
autonomous in the management of its own interests.
The municipality is the basis of all the territorial organization, and the first level of the
citizen's participation in public affairs. The municipality is ruled and administered by the
council, formed by directly elected councillors and the mayor, elected by the councillors. To
date, there are 947 municipalities in Catalonia. The population of 28 of them is less than 100
12
Sant Andreu de la Barca and Molins de Rei.
13
Castellar del Vallès, Esparreguera, Martorell, El Masnou, Olesa de Montserrat, Pineda de Mar, Sant Pere de Ribes, Santa
Perpètua de Mogoda and Sitges.
14
Manlleu16 inhabitants; 492 have a population between 100 and 1,000 inhabitants; 254 between 1,001 and 5.000; 121 between 5.00 and 20,000; 31 between 20,000 and 50,000; and 21 with populations of over 50,000 inhabitants. In other words, 70% of the Catalan population lives in the 45 municipalities whose populations exceed 20,000 inhabitants. Their incomes come from direct and indirect taxes (related mainly to propriety values) and transfers principally from central government. The county is a second tier of local administration, specific of the Catalan local government organization. It is ruled by the council, whose members are appointed by the political parties, among the municipal councillors, according to the results of the municipal elections. The councillors elect a President amongst them. There are 41 counties, which were created in 1987. They give support to the municipalities, mostly the small ones, in order to provide its citizens with all the services granted by law. Their financial resources rely almost exclusively on transfers from the Catalan government. The province is another second tier of local administration and one of the constitutional levels of government in Spain. The provincial division was imposed by central government in 1833; during the Franco dictatorship, its chief, the governador civil, was the delegate of the central power in Catalonia. This radically changed during the democracy with the creation of the AC. In Barcelona, the province has been very active in promoting the cooperation of municipalities through local networks and programmes. However, for a part of the Catalan political elites, the provincial division is an old-fashioned administrative level that does not correspond to the territorial reality, which would be better adapted through 7 territorial districts or vegueries. Provinces are ruled by the council, formed by councillors or “diputats” that are elected in districts. Each district has a number of deputies weighted according to the population, and these are distributed proportionally to the election results obtained in municipal elections throughout the district. As mentioned previously there are 4 provinces in Catalonia and their task is to give legal and technical assistance to municipalities. Provinces are financed mainly by transfers coming from central government. However, the Catalan local structure is much more complex from the administrative point of view, with the existence of other local entities. It will be seen later that this applies also for the city-region. Besides the municipalities, counties and provinces, two other types of local administration can be distinguished: the supra-local level (formed by mancomunitats, consortiums and metropolitan authorities) and the infra-local level (the municipal decentralised entities).
17

The municipal decentralised entities are little villages, or parishes, inside the boundaries of a
municipality, mostly in rural and mountain areas. A Neighbourhood Council, with its
President, rules them. At the supra-local level, there are two types of voluntary agreements:
the mancomunitats and consortiums. The former is a voluntary agreement between two
municipalities; the latter is a voluntary agreement between different levels of administration
(municipalities, provinces, AC, etc.) and also with private actors. Finally, two metropolitan
authorities can be found, created by the Parliament of Catalonia in 1987, devoted to
transport 15 and environmental 16 issues in the metropolitan area of Barcelona. As will see in
the following section, these are sectorial agencies that replaced the then existing metropolitan
government.

Table 4 illustrates the diversity and number of local administrations in Catalonia.

Local administration units
Municipalities                                 947
Provinces                                        4
Supralocal entities                            409
 Mancomunitats                                  75
 Consortiums                                   291
 Counties                                       41
 Metropolitan authorities                        2
Infralocal entities                             59
Total                                        1,419
Table 4: Number of local government units in Catalonia (2010)
Source: Own elaboration with data deriving from the Generalitat (SIAL),
http://www.gencat.cat/municat/

Moreover, all local governments are autonomous to create public and public-private agencies
and societies for the management of services.

Regional-local relationships

Local governments are considered as the Cinderella of Spain’s recent political evolution. The
decentralisation over the last 30 years has been focused on the regional level (the Autonomous
Communities). In the case of Catalonia, this process has been even more important for its
cultural and identitarian needs. In other words, the issue of acquiring more legal and financial

15
     http://www.amb.cat/web/guest/Entitats_AMB/Entitat_Trans/Presentacio
16
     http://www.amb.cat/web/guest/Entitats_AMB/Entitat_Medi_Ambient/Presentacio_
18 autonomy has guided the Catalan governmental strategy at the expense of other issues. For example, Catalan governmental leaders periodically start negotiations with the central government to change the financial system of the AC. Over the last few years, one of the main debates – still open - has been the approval of the revision of the Statute of Autonomy. As a consequence, the attention paid to local issues has been minor, with punctual reforms, as in 1987 (creation of counties) and maybe in 2010 (via the creation of the Metropolitan Authority of Barcelona and the vegueries). As will be seen in the following section relating to key city regional governance themes, the relations between the Catalan government and the municipalities belonging to the city-region have been influenced both by the Spanish-Catalan debate and the differences in political majorities of regional and local governments. Among political divergences, the political struggle between the Generalitat and the City of Barcelona has been particularly relevant. The fragmentation of Catalan – and Spanish - local government is not exceptional but a general feature of the Franco type of local government, according to the classification of Hesse and Sharpe (1991). The Napoleonic model – which includes Spain, France, Italy, Portugal and Greece - is characterised by high local identity at the expense of high local autonomy. In other words, the essence of local government is political rather than functional. Local governments are considered to embody territorial communities and office holders are expected to represent the interests of this community, especially in relation to higher levels of government (being national and regional in the Spanish case) (Hesse and Sharpe, 1991). This “political localism” (Page, 1991) explains local fragmentation and the advocacy for keeping small units of government. Several proposals from the Catalan government (most recently in 2001) to merge municipalities have failed; on the contrary, the number of municipalities has been increasing, with the 947th being created in April 2010. By contrast, in North European countries and in the United Kingdom and Canada there have been huge territorial reforms imposed by central or regional governments to diminish the number of municipalities, so as to ensure better efficiency in the delivery of services. The high – and increasing - number of different instruments of cooperation between Catalan municipalities illustrates the limits of small governments. As will be seen in the next section, the capacity of local governments is also influenced by the insufficiency of economic resources. National level decentralisation policy and support for city-regional capacity building and autonomy
19

In formal legal terms, a “metropolitan area” in Spain is an organisational arrangement that an
AC can set up in its territory when it considers it is necessary to coordinate action among
several municipalities linked by economic or social ties. Then each regional government
decides whether these linkages exist and, when they do exist, it approves the
institutionalisation of formal arrangements among the municipalities involved. As a top-down
policy, the AC decides to set up (or not) the institution of a “metropolitan area” in order to
coordinate specific services and policies, mainly pertaining to transportation and services
related to the environment (waste, water supply and sewage, etc.). By creating a formal
structure of this type, the regional government acknowledges the existence of “integrated
networks of municipalities in big urban agglomerations which have economic and social
linkages” (Art. 43, 7/1985 Local Government Act) and makes the decision to establish a
formal network of local governments for the coordination of certain policies (Alba and
Navarro, 2005). However, few regional governments have made use of this prerogative and
when they have done it –as in Barcelona and Valencia– it has been with very limited purposes.

The fact that there are almost no metropolitan areas in the formal legal sense of the term does
not mean that the global (territorial-functional) trend of metropolisation has been alien to the
country. Today Spain has ‘an urban society in a preponderant rural territory’ (Rodríguez
Álvarez, 2002, p. 108). Some 40.5 % of the Spanish population lives in fifty-seven
municipalities with more than 100,000 inhabitants (representing 0.7 per cent of the total
number of municipalities). Densely populated urban areas on the Spanish coastal areas and in
Madrid contrast with a pattern of lower density development in the central zones of the
country. There are twelve cities with more than 300,000 inhabitants, whereas more than 85%
of the municipalities have less than 5,000 inhabitants (Rodríguez Álvarez, 2002). Although
the metropolisation of urban spaces is a reality in the country and the local government units
that comprise those spaces face the same kinds of governance challenges as everywhere else,
the Spanish political system has not provided a substantive answer on how metropolitan
spaces should be organised, and how policies should be designed and implemented. Several
circumstances contribute to draw a confusing picture on this issue.

In the first place, there is not a clear and unique definition of what a metropolitan area (MA)
is in physical terms or of how many municipalities should constitute each MA. The long
tradition of statistical identification of MA present in other western countries has no parallel
in Spain and it is only very recently that the census has provided consistent data on links
between municipalities based on mobility. However, this step has not been complemented by
20

an effort to establish the limits of each of the approximately 25 metropolitan areas above
200,000 inhabitants estimated to exist in the country. In a few cases, such as Barcelona, there
has been a political definition of the components of the MA (Alba and Navarro, 2005).

In the second place, for almost three decades of democratic rule in Spain, there have not been
incentives to promote and encourage the consolidation of metropolitan areas as organisational
arrangements to solve complex urban issues. Because of the specific features of the Spanish
political system –and specifically those features that refer to its territorial structure – the
consolidation of Autonomous Communities has been the priority. Indeed, the development of
other forms of local autonomy which could potentially challenge the power of the new (and in
phase of consolidation) political actors has been systematically postponed to a later stage.
Only recently, the system has carried out reforms at the local government level through the
reinforcement of its autonomy and powers, and once again, the metropolitan issue has not
been present in this wave of reforms. Although acknowledged in communities of experts as
one of the main challenges to global governance for the next decades, metropolitan
governance is not a prominent issue in the political agenda, neither at the national level, nor at
the individual level of each MA (Navarro and Tomàs, 2007).

The law approved in June 2003 by the Spanish Parliament (Proyecto de Ley de Medidas para
la Modernización del Gobierno Local) emphasises the questions of local efficiency and
democracy. In relation to efficiency, two main reforms have been implemented. Firstly,
several elements characteristic of the New Public Management (such as instruments of
benchmarking and evaluation) have been introduced. Secondly, the law reinforces the role of
the mayor and the executive committee by differentiating more clearly their functions and
those of the assembly. At the same time, the new regulation introduces some measures to
enhance the participation of citizens (such as popular initiatives and the use of new
technologies). The law requires the creation of Social Councils in cities of over 250,000
inhabitants to represent economic, professional and neighbourhood groups that will make
reports and be consulted on big urban projects (Rodríguez Álvarez, 2002).

Local governments have been seeking financial reform over the last few years, through the
Spanish Association of Municipalities and Provinces (Federación Española de Municipios y
Provincias, FEMP), but without success. In fact, they have been claiming a second
decentralisation of the State that would give local governments more financial autonomy. As
determined by the Law on Local Finances (Ley Reguladora de Haciendas Locales, 1988), the
provincial resources depend on State grants. Municipalities can set their own taxes and collect
21

other indirect taxes; but these are mainly linked to propriety issues. Moreover, the transfers
municipalities receive from other levels of government are conditional, which weaken their
level of autonomy (Suárez Pandiello, 2008).

Table 5 gives an indication of the share of local government expenditure in Spain. This
distribution was fixed in 1978 and has evolved mainly with an increase of expenditure at the
regional level at the expense of central level, while the local government share has remained
basically constant since then, resulting in clear inequalities.

Level of government                % of total              % of GPD
Central                              52.4                     20.3
Regional                             35.1                     13.6
Local                                12.5                      4.9
Total                                 100                     38.8
 Table 5: The share of local government expenditure in Spain (2004)
 Source: Bosch and Espasa, 2006, p.108

As a result of the economic crisis which began in 2008 and especially of the crisis in the
construction sector, the financial resources of municipalities have decreased even further,
while the demands for social services have increased. Central government has implemented
conjunctural measures (plans of direct local investments) that do not resolve the question of a
reform of local finances (Tomàs, 2009b).

Concluding remarks

At this point it is appropriate to make some concluding remarks on the national context for
city regional governance. Starting firstly with the extent to which local and/or regional
autonomy exists in Spain, it needs to be emphasised that Spanish and Catalan local
governments belong to the Franco type of local government, with more emphasis on the
political dimension rather than on functional issues. In terms of legal autonomy,
municipalities and provinces have constitutional recognition. Regional governments can
change the number of municipalities in their territories, but face strong opposition. That
explains the high level of fragmentation of Catalan local government. Municipalities are the
closest government for citizens; they provide the basic services for the day-to-day life of
citizens. Nevertheless, municipalities suffer from a lack of economic resources, a situation
that has been worsening since the beginning of the economic crises in 2008. The distribution
of financial resources between the central, regional and local levels of governments shows a
22

marginal share for local governments. Moreover, the trend since 1978 has been the increase of
regional expenditure at the expense of central level, while the proportion of local governments
has remained approximately the same (around 13%).

The process of decentralization in the last 30 years has reinforced the intermediate level of
government, the Autonomous Communities. In the case of Catalonia, the claim for regional
autonomy has dominated the political debates. In this context, the debate on responsibilities
and financial resources of local governments has been secondary and even postponed.
In terms of city regional institutions/governance arrangements fitting in with this, the case of
Barcelona shows different definitions of the metropolitan question. As pre-determined by the
ESPON CAEE project, the city-region corresponds to the NUTS3 level of government, i.e.
the spatial extent of the administrative limits of the Province of Barcelona. This is a second
tier of local government with tasks of legal and technical assistance for municipalities. The
province comprises 311 municipalities, which are very disparate in terms of surface area and
population. However there are other conceptions of the metropolitan reality conveyed by
geographers, urban planners and architects alike, but also by local and regional politicians. On
the one hand, the metropolitan region (RMB) or the functional area comprising 164
municipalities and conceived as the suitable level for planning. On the other hand, the
metropolitan area formed by the City of Barcelona and its 35 surrounding municipalities. This
constitutes the core of the metropolitan region and it is enhanced by local elites as the right
scale for a single metropolitan authority. Clearly other interpretations of the real functional
city-region exist as well.

The city-region of Barcelona is embedded in a system of multilevel governance. The city-
region is obviously affected by the general trends depicted above, like local fragmentation and
insufficiency of economic resources or the lack of incentives to promote and encourage the
consolidation of metropolitan areas. However, the characteristics specific to the city-region
and the political and economic importance of the City of Barcelona alter the general set of
conditions. The following section will focus on the particular pattern of governance for the
city-region of Barcelona.
23

Key City Regional Governance Themes

Institutional Capacity

City regional institutional capacity

The following tables summarise the main indicators of city-region institutional capacity,
including elements related to local democracy and local government, formal and informal
networks, competences, financial resources, etc.

The first table (Table 6) presents a general overview of the Catalan institutional architecture.

Level                    Competences                  Political             Main Resources (2003)
                                                      representation
Regional                    Education                 Direct election of    Tax and fees (52.2%)
                            Health                    135 deputies          Transfers (43.2%)
                            Social services
                            Environment
                            Culture, Sports
                            Urban planning
                            Roads, Public works
                            Agriculture
                            Tourism
                            Police, Emergencies
Municipalities              Transit                    Direct election of   Tax and fees (51 %)
                            Civil protection           councillors          Transfers (42.4 %)
                            Health and education
                            services
                            Urbanism
                            Roads, Public works
                            Culture, Sports
                            Public transport
                            Tourism
                            Municipal markets
                            Basic services
Counties                    Support to small           Indirect election:   Transfers (95 %)
                            municipalities to          delegates from
                            provide basic services     municipalities
Provinces                   Legal and technical        Indirect election:   Transfers (85 %)
                            assistance to              delegates from       Tax and fees (10%)
                            municipalities             municipalities
                            Enhancing local
                            cooperation
                            Roads
Table 6: Characteristics of levels of government in Catalonia
Source: Own elaboration with data coming from (Bosch and Espasa, 2006)

At the city-region level, there is a complex institutional organisation illustrated in the
following four tables. The first of these (Table 7) shows the different conceptions of the
24
metropolitan scale, their institutional fragmentation and political representation.
Territorial unit Population % of Political represen- Administrative
(2007) total pop. tation units
Barcelona 1,595,110 29.9 Direct election of 1 municipality
local councillors
Metropolitan area Indirect 36 municipalities
representation in 4 counties
3,150,380 59
metropolitan
authorities
Metropolitan region No political 164 municipalities
4,856,579 91
representation 7 counties
Province of Indirect 311 municipalities
Barcelona (city- 5,332,513 100.0 representation in 11 counties
region) provincial council 1 province
Table 7: Population, political representation and administrative units in the city-region
Source: Own elaboration with data coming from the Catalan Institute of Statistics (Idescat)
The next one (Table 8) shows the institutional fragmentation at the city-region scale,
including municipalities, supra-local entities –metropolitan authorities, counties, consortiums
and mancomunitats– and infra-local entities.
Municipalities 311
Supralocal entities 201
Mancomunitats 35
Consortiums 153
Counties 11
Metropolitan authorities 2
Infralocal entities 3
Total 515
Table 8: Number of local government units in the province of Barcelona (2010)
Source: Own elaboration with data deriving from the Generalitat (SIAL),
http://www.gencat.cat/municat/
The following table (Table 9) is focused on specific metropolitan institutions: the
Metropolitan Transport Authority, the Metropolitan Transport Entity, the Metropolitan
Environment Entity, the Mancomunitat of Municipalities and the Consortium of
Municipalities. For each institution, the population and number of municipalities is identified,
together with their powers, their financial resources and their political representation.25
Institution Population and Competences Financial resources Political representation
number of
municipalities (2007)
Metropolitan Transport 5,217,864* 1. Cooperation, coordination, planning and Transfers (55%) (Generalitat, State, City of Indirect
Authority (ATM) financing of public transit services and Barcelona and EMT) Members of regional and local
(Consortium created by the 202 municipalities infrastructures Fees from services (45%) levels. Also members of central
Generalitat, 1997) 2. Management fees government (with no vote) and
3. Future regulatory framework non-profit associations (as
4. Other functions related to mobility observers)
Metropolitan Transport 2,790,803 1. Planning and management of public
Transfers from ATM (56%) Indirect
Entity (EMT) transport systems
Fees from services (33%) Member municipalities: by
(created by the Catalan 18 municipalities 2. Provision of subway service in seven
Contribution of the Mancomunitat and other population, with fixed assigned
Parliament, 1987) municipalities
income (11%) number of representatives to
3. Management and control of the taxi
the City of Barcelona
system
4. Programming transit and road network
Metropolitan Environment 1. Hydraulic works and water supply
3,126,294 Fees and utility rates (55%)
Entity (EMA) 2. Drainage and sewerage
Transfers from the Generalitat (36%) Indirect
(created by the Catalan 3. Coordination of urban drainage and
33 municipalities Contribution of the Mancomunitat and other Member municipalities: by
Parliament, 1987) sewerage systems
income (9%) population, with fixed assigned
4. Treatment and utilization of municipal and
number of representatives to
industrial waste
the City of Barcelona
5. Coordination of municipal environmental
services
Mancomunitat of 3,026,380
Indirect
Municipalities of the
1. Improving metropolitan infrastructure, Member municipalities: by
Metropolitan Area of 31 municipalities
public space, housing and land Transfers from municipalities (72%) population, with fixed assigned
Barcelona
2. Cooperation and technical assistance to Fees and other income (28%) number of representatives to
(MMAMB)
municipalities the City of Barcelona
(created by local initiative,
1988)26
Consortium of the Develop the competences of other entities Indirect
Metropolitan Area of 3,150,380
(except for the ATM) and other: Funded by the consortium organizations: Member municipalities: by
Barcelona Urban planning and public roads, transport EMT, EMA and MMAMB population, with fixed assigned
(CAMB) 36 municipalities
and mobility, environment, parks and forests, number of representatives to
(created by local initiative, economic promotion, social services, culture, the City of Barcelona
2009) sports, immigration and housing
* Data of 2006
Table 9: Metropolitan institutions of the city-region
Source: Tomàs, 2009a, pp. 88-89.27
To all this complexity all sorts of public and public-private agencies have to be added, that op-
erate in the city-region for the management of metropolitan services such as water supply,
drainage and sewerage, treatment and utilization of waste, etc.
Finally, apart from formal networks, there are several informal networks between municipali-
ties, such as strategic plans, mobility plans and pacts to promote economic development. All
these informal arrangements have indirect political representation and are financed by their own
members. They deal mainly with issues regarding economic development. The principal ones
are referred to in Table 10.
Members Objective
Metropolitan Strategic Plan 36 municipalities of the metropolitan Identify and promote support
of Barcelona area of Barcelona strategies for the economic and
(since 2003) Metropolitan institutions (EMA, EMT, social development of the metro-
MMAMB) politan area of Barcelona, that is:
Other administrations (Generalitat, Anticipate future challenges;
Provincial Council of Barcelona, Provide the necessary changes to
county councils) meet such challenges;
Most important economic and social Promote the participation of all
bodies (Chamber of Commerce of Bar- the agents involved;
celona, employer’s organisations, trade Enable a consensus among
unions, University of Barcelona, Fair of differing interests;
Barcelona, Port and Airport, etc.) Prioritise decisions.
Industrial Agreement of the 44 municipalities of the metropolitan a) The economic and social de-
Metropolitan Region of region of Barcelona velopment and employment pro-
Barcelona Metropolitan institution (MMAMB) motion throughout
(1997) Other administrations (Generalitat, Metropolitan Region.
Provincial Council of Barcelona, b) Promote and disseminate
county councils) measures to achieve increased
Most important economic and social current weight of
bodies (business organisations, all uni- the industrial sector within the
versities of the province, trade unions, metropolitan area through the
Fair of Barcelona, Port and Airport, improvement of business com-
etc.) petitiveness and the diminution of
unemployment.
Strategic Plan of the Coast 27 municipalities of the metropolitan a) The preparation of the Strate-
of Metropolitan Region of region of Barcelona gic Plan for the coast of Barce-
Barcelona Metropolitan institution (MMAMB) lona Metropolitan Region and the
(2004) Other administrations (Generalitat, actions to stimulate and monitor
Provincial Council of Barcelona) their implementation.
Port of Barcelona b) Ensure that the Plan is a tool
that meets the needs of munici-
palities and moves towards an
integrated coastal management.
c) Develop studies and papers
about the general needs of the
territory within its performance,
paying particular attention to28
those issues related to coastal
issues.
d) Provide studies and proposals
that may be used for understand-
ing and preparing strategies for
the whole Catalan coast.
e) Establish a relationship of
close collaboration with the Met-
ropolitan Strategic Plan of Barce-
lona.
f) Promote and disseminate the
culture and methodology of stra-
tegic planning as a tool citizen
participation in their processes of
economic and social develop-
ment.
Barcelona Economic Trian- 3 municipalities of the metropolitan Promote areas of high economic
gle (BET) area (Barcelona, value in international markets and
(since 2009) Cerdanyola del Vallès and Viladecans) attract investors in three areas
Generalitat de Catalunya (Vallès, Besòs and Llobregat)
Table 10: Main informal networks in the city-region of Barcelona
Source: Own elaboration
To sum up, high levels of fragmentation can be observed at the city-region scale, with many
institutions (province, counties, metropolitan authorities, mancomunitats, consortiums, etc.) that
operate in different territories. Moreover, there are other less institutionalized mechanism of
cooperation between municipalities, other levels of administration and private actors. Among
these, the Metropolitan Strategic Plan needs to be highlighted and is discussed in due course.
Institutional capacity – qualitative understandings
In order to determine the extent to which the high level of fragmentation observed in the
previous section affects the institutional capacity of the city-region, it is necessary to examine
the recent institutional and political context of the city-region.
For the past 50 years, the city of Barcelona and the inner ring have shared the same institutional
organisation, regional plan and management of services. The most powerful body was the
Metropolitan Corporation of Barcelona (MCB) (1974-1987), comprising 27 municipalities and
bearing a number of responsibilities such as public transit, water supply, waste treatment and
urban planning (particularly, the implementation of the General Metropolitan Plan of 1976). The
political influence of a single institution’s gathering half of the Catalan population was feared
by the AC government. Similar to what happened in London with the Greater London Council
in 1986, the MCB was abolished in 1987 by the Catalonian Regional Government, in the29
framework of a general reform of the territorial structure.
In order to replace the MCB, two specialised metropolitan bodies were created by the
Parliament of Catalonia: a) covering 33 municipalities, the Metropolitan Environment Entity,
with responsibilities in water supply, sewage disposal and urban waste treatment, and b) the
Metropolitan Transport Entity, formed by 18 municipalities to organise, manage, plan and
coordinate public transport services (buses, metro, taxi) in its area. Moreover, the
responsibilities in planning were transferred to the AC government. The reform was not
supported by locally elected officials, not only because it fragmented the metropolitan interest
but also because of its political significance. Indeed, the majority of metropolitan municipalities
were ruled by left-wing political parties, while the AC government that passed the law was ran
by the Catalan nationalists (on the centre right). In order to diminish the impact of the reform,
23 municipalities decided, one year later, to get together on a voluntary basis. They formed the
Mancomunitat of Municipalities of the Metropolitan Area of Barcelona to carry out the MCB’s
remaining powers, such as road construction, public works and technical assistance to the
municipalities (since 1988, the members of the association have increased up to 31). In 1997 the
Generalitat created the Authority for Metropolitan Transport. The function of the ATM (which is
a public consortium) is to organise the public transportation system in an area larger than the
metropolitan region but smaller than the Province or city-region. The integration of the system
of transport fares has been its main achievement to date (Négrier and Tomàs, 2003).
The Association of Municipalities with Urban Transport of the second metropolitan ring, known
as the AMTU17, is a network of voluntarily associated municipalities which aims to enhance and
promote urban public transport in their cities, and support urban mobility in general within the
metropolitan region (RMB). The AMTU is a public interest association and forms part of the
ATM. A total of 65 cities of the city-region belong to the AMTU, only four of which lie beyond
the spatial limits of the metropolitan region (RMB) 18.
The question of diminishing institutional fragmentation has been on the agenda of metropolitan
municipalities since the dissolution of the MCB. These claims have risen since 2003, when the
Socialist Party took power of the the Generalitat (in coalition with two other left-wing parties).
The nomination of Pasqual Maragall, ex-mayor of Barcelona, as prime minister of the AC
17
http://www.amtu.cat/amtu/
18
Igualada, Manresa, La Pobla de Claramunt and Vic.You can also read