Can White Elephants Kill? Unintended Consequences of Infrastructure Development in Peru - LSE
←
→
Page content transcription
If your browser does not render page correctly, please read the page content below
Can White Elephants Kill? Unintended Consequences of
                        Infrastructure Development in Peru
                                            Antonella Bancalari *

                                               November 2019

                                           JOB MARKET PAPER

                                                    Abstract
            Public infrastructure development is prone to inefficiencies that can result in poor-quality
       implementation, but the consequences are unclear. This paper studies the effect on infant and
       under-five mortality of a nation-wide expansion of sewerage infrastructure, conducted by the
       Government of Peru between 2005 and 2015. I use novel administrative panel data at the dis-
       trict level and exploit random geography-driven variation in project allocation to instrument
       for sewerage diffusion. I document an increase in under-five mortality in districts that experi-
       enced greater sewerage diffusion. The result is linked to hazards from the construction works
       and was exacerbated by delays and mid-construction abandonment. The potential health ben-
       efits of sewerage fail to manifest even after completion of projects due to lack of household
       connectivity.

JEL codes: C36, H51, I15, J18, N36, O18
Keywords: infrastructure, public expenditure, sewerage, mortality, Peru

   * London   School of Economics and Institute for Fiscal Studies (email:a.bancalari@lse.ac.uk). This project has
benefited from data and discussions with individuals from numerous institutions in Peru, including the Ministry of
Housing, Construction and Sanitation, Ministry of Health, Ministry of Economics and Finance and the World Bank’s
Sanitation Programme. I am grateful to Orazio Attanasio, Britta Augsburg, Alex Armand, Oriana Bandiera, Robin
Burgess, Joan Costa-i-Font, Pramila Krishna, Berkay Ozcan and Simon Quinn for their useful comments. I also thank
participants at CSAE Oxford, Royal Economic Society Junior Symposium, European Society for Population Economics
and Population Association of America Conferences and at the LSE STICERD Economics and Social Policy, IFS-
UCL Economics, Oxford University Economics, EUDN Development Economics, NOVAFRICA-NOVA SBE, Sussex
Economics and the School of Economics at Kent. All work and opinions in this paper are my own and do not necessarily
represent the views of the Government of Peru or other institutions. My work as a PhD student was supported by the
London School of Economics Doctoral Scholarship.
1    Introduction
There is currently a global effort to achieve the Sustainable Development Goals (SDGs) by 2030.
Crucial advances are being made in areas ranging from improving health and life expectancy
and making human settlements safe and resilient to promoting inclusive and sustained economic
growth. The assumption behind much of this policy agenda is that investing in infrastructure is
crucial for attaining these development goals.
    However, to date, key actors like low- and middle-income country (LMIC) governments and
the World Bank have placed much more emphasis on the volume of infrastructure expenditure
(World Bank, 2017), rather than the quality of that expenditure (Besley and Ghatak, 2006). Eco-
nomic research has been very useful at identifying the effectiveness of infrastructure projects —
e.g. dams, roads and electricity networks— once they are completed and in use (Duflo and Pande,
2007; Dinkelman, 2011; Lipscomb et al., 2013; Rud, 2012). What is less clear is the consequence
of such projects while they are still underway.
    This paper seeks to fill this gap in the literature. Specifically, I look at the development of sew-
erage projects. Sewerage lends itself to such analysis for two reasons. First, due to high fixed costs
and economies of scale, the sewerage industry is a natural monopoly — i.e. one large provider,
which is usually a government. Absent competition, monopolies have weak efficiency incentives
that may result in overlooking implementation quality. Second, sewerage projects are highly dis-
ruptive because they entail extensive excavation, large building sites and traffic disruption. I look
specifically at the effect of the diffusion of sewerage systems in Peru on the mortality of children
under the age of five (under-five). Under-fives are the most vulnerable segment of the population
because of their weak immune system and poor awareness of health risks.
    The diffusion of sewerage in Peru is an excellent case to study because the scale of this pub-
lic intervention was national, allowing for considerable spatial variation in implementation. The
Government of Peru spent USD 3 billion to start more than 5,000 sewerage projects. I construct a
district-level panel of 1,400 districts for every year between 2005 and 2015 by combining several
sources of novel administrative data and grid-cell level spatial data. Specifically, I rely on detailed
data on expense plans and timing of expenditures to identify the number of projects in construction
and those completed in a given district.
    Peru’s natural geographic variation is ideal for the instrumental variable utilized in this study.
I construct an instrument capturing how sewerage diffusion would have evolved over time had
project placement been based solely on cost considerations. I rely on the fact that geographic
characteristics — i.e. land slope, elevation, area and river density— affect a district’s technical
suitability for low-cost sewerage projects. Subject to a time-variant nation-wide budget constraint,
I predict that the government of Peru would have allocated more projects to cheaper districts, and
would have done so earlier in the period of study. The identification assumption is that no other
factors affecting mortality rates (e.g. citizen’s preference for preventive healthcare and other in-
frastructure and policies) changed over time along the same spatial lines as the predicted allocation

                                                   2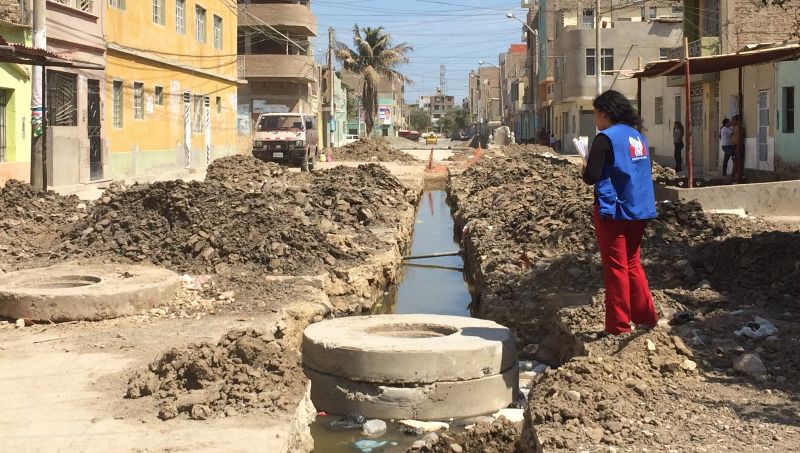
of projects. A number of tests bolster the validity of my identification. I find that my instrument
is not related to other types of infrastructure development, residential sorting, selective migration
or geography-specific mortality trends.
    I find that with every extra sewerage project that was launched, under-five mortality increased
by 6 percent over the baseline. The primary determinants of this mortality increase are waterborne
diseases and accidents. Notably, I find no effect of sewerage construction on the mortality caused
by other diseases and complications unrelated to infections or hazards.
    Furthermore, I find that delays and half-finished sewerage projects exacerbated the risks. Only
half of the projects started were ever completed, and half of those took more than five years to
be completed. With each extra year a district was exposed to sewerage works, the average annual
change in under-five mortality increased by 14 percentage points.
    One would expect the benefits of sewerage systems to manifest upon project completion. How-
ever, I find no effects on early-life mortality from an additional sewerage project being completed.
In line with this finding, I document that providing access to public sewers does not increase the
connectivity of households to sewerage systems. This find is evidence of the last mile problem —
the inability of governments to connect costly infrastructure to the final user (Ashraf et al., 2016).
    The paper makes three contributions. First, the paper broadens the literature on public goods
by moving beyond assessing inefficiencies to encompass social costs. Influential papers have iden-
tified the determinants of waste in government spending (Bandiera et al., 2009; Rasul and Rogger,
2018) and institutional arrangements that prevent these inefficiencies (Besley and Burgess, 2002).
However, there is a need to gain a better understanding of how inefficiencies in the provision
of public goods jeopardise economic development and wellbeing. For example, Burgess et al.
(2015) acknowledge this need in the context of a misallocation of public resources in Kenyan road
building, by stating that “linking [our] findings to aggregate economic outcomes represents a key
priority for future research”.
    Second, this paper contributes to the literature on infrastructure effectiveness by extending
the scope of analysis to the potential risks generated by projects that are still in progress. There is
growing evidence in this literature on the effectiveness of electrification and large dams in improv-
ing labour and productivity (Dinkelman, 2011; Rud, 2012), and decreasing poverty (Dinkelman,
2011; Lipscomb et al., 2013; Duflo and Pande, 2007). More closely related papers find that envi-
ronmental hazards from large infrastructure affect early-life mortality (Mettetal, 2019; Cesur et al.,
2015; Gupta and Spears, 2017).
    Finally, this study informs the literature on public health by exploring the effects of sewerage
at scale in a contemporary setting (Watson, 2006; Alsan and Goldin, 2018). Recent studies in
LMICs have mainly focused on the effectiveness of private sanitation infrastructure (Geruso and
Spears, 2018), and come from experimental studies with a limited time-horizon and geographical
setting (Duflo et al., 2015). My study, by contrast, focuses on a nation-wide setting and a longer
temporal focus.
    The rest of the paper proceeds as follows: section 2 provides background and section 3 ex-

                                                  3
plains the data and presents descriptive statistics. Section 4 provides details of the instrumental
variable strategy. Section 5 and section 6 present the results of the effect of construction and com-
pletion of sewerage, respectively. Each of these sections describes the mechanisms driving the
results. Section 7 concludes by discussing the significance of the study for a wider body of litera-
ture as well as potential extensions to other institutional contexts and other types of infrastructure.

2    Sewerage diffusion in Peru
Half of Peru’s households lacked sewerage connectivity in 2005. To remedy this, the National
Sanitation Plan for 2006-2015 set the target of increasing access to sewerage in urban areas, rep-
resenting the first national goal of sewerage diffusion in Peru. In this period, the Government of
Peru spent more than USD 3 billion to start 5,000 projects in more than 1,100 districts. The roll-
out of sewerage projects across districts was not random. Starting sewerage projects depended
on the demand of citizes and willigness of local municipalities; municipal resources; and will-
ingness of the Central government to expand access in certain districts. Between 2005 and 2015,
most projects were implemented by local municipalities: more than 56 were implemented by
district municipalities and almost 30 percent by province municipalities (Appendix Figure 12).
For projects implemented by district municipalities, unobservable characteristics of the district
population (e.g. citizen’s demand for public health) as well as the willingness and ability of the
municipality to develop social infrastructure are correlated with both sewerage diffusion and early-
life mortality. Furthermore, district municipalities can only implement sewerage projects if they
are incorporated into the National System of Public Investment (SNIP), which requires having:
(i) access to Internet; (ii) approval from the municipal council to receive technical assistance in
formulation and implementation of investment projects from the Central government; and (iii) an
annual budget above one million soles (approximately 200,000 sterling pounds). In line with these
criteria, richer municipalities with a revenue above the median and with access to Internet by 2005
started a greater amount of sewerage projects (Appendix Figures 8 and 9). For the portfolio of
projects formulated by the Ministry of Sanitation, the National Sanitation Plan 2006-2015 states
that previously unattended and poor areas should be prioritized when expanding access to sew-
erage. This was not the case since more sewerage projects were started in districts with a lower
percentage of the population with unmet basic needs and with a higher sewerage connectivity by
2005 (Appendix Figures 10 and 11). Interviews in the Ministry of Sanitation revealed that lobby-
ing shifts the prioritization of projects into districts with greater political value. These confounding
factors pose reverse causality and omitted variable bias concerns. Richer districts starting earlier
and more sewerage projects also had lower early-life mortality by 2005 and experienced different
trends in early-life mortality than poorer districts.
    In order to address endogeneity in sewerage diffusion, I exploit exogenous variation linked
to implementation costs and funds allocation. According to the SNIP guidelines, to implement
a project, it requires achieving technical and economic viability. Both depend crucially on the

                                                   4
design and direct project costs as cheaper projects are more likely to be implemented. The cheap-
est sewerage system is the conventional gravity system, connected to a treatment plant working
through anaerobic digestion (Panamerican Center of Sanitation Engineering and Environmental
Sciences, 2005). To be able to install this system, the area must have a steep gradient, be in a low
altitude with enough oxygen and close to a body of water to discharge the effluent. More advanced
and expensive technology is required in areas that do not have these characteristics. Projects in
suitable districts fow low-cost sewerage systems are more likely to achieve technical and eco-
nomic viability based solely on cost considerations. I exploit these geographical factors that affect
sewerage diffusion to construct an instrumental variable, as explained in Section 4.
      Sewerage diffusion also depends on funds allocation, as not all projects declared economic and
technically viable have funds to be started and not all projects started have guaranteed resources
to be completed. The largest source of funding was local: 40 percent of sewerage projects were
financed by district royalties and 22 percent by local tax revenue. 30 percent of projects were
funded by transfers from the national government (Appendix Figure 13). Confounding factors
such as voters preferences and clientelism can affect the allocation of funds, so I rely on the nation-
wide expenditure as a component of my instrument. I explain the construction of the instrument
in detail in Section 4.

3      Data and descriptive statistics
3.1     Data
I construct a district-level panel dataset of more than 1,400 districts in Peru from 2005 to 2015
by combining data from several novel sources. I construct infant and under five mortality using
vital statistics registries and population forecasts. For the core dataset measuring sewerage diffu-
sion, I compile and combine project-level data from viability studies and annual budget reports,
which allows identifying when a project is under construction and completed. To construct the
instrumental variable, I use grid-cell level spatial data, including elevation (from which I com-
pute gradient), river flow and district boundaries. In addition, I draw on population forecasts to
control for time-variant population density and district population size. The final dataset is an
unbalanced panel of 1,408 districts spanning 2005-2015: 10,032 district-year observations for the
infant-mortality sample and 10,494 district-year observations for the under-five mortality sample.
      The outcome variables are constructed using vital records provided by the Ministry of Health
and population forecasts built by the National Institute of Statistics and Informatics (INEI for its
Spanish acronym) for every calendar year between 2005 and 2015 at the district level. The vital
records provide the number of infants born alive and number of deaths of infants (under 1 year old)
and children under 5 years old. The mortality data is disaggregated by cause of death following
the International Classification of Diseases - ICD10. The population forecast provides data on the
number of children under 5 years old. I construct infant mortality (IMR) and under-5 mortality
(U5MR) rates for each district d and year t, using as the denominator the population at risk, as

                                                  5
described by Preston et al. (2001):
Deaths infants aged 0-11 monthsdt
IM Rdt = x1000
Live birthsdt
Deaths children aged 0-59 monthsdt
U 5M Rdt = x1000
Population aged 0-5 monthsdt
Infant-mortality rates in Peru have a right skewed distribution due to incomplete birth regis-
tration: the coverage was 93 percent by 2005 (UNICEF, 2005). To deal with outliers, I apply a
winsorizing procedure to observations above the 90th percentile of the distribution of the infant
mortality rate. To alleviate concerns linked to the quality of the vital registers in Peru, I com-
pare the nation-wide trends of the computed infant mortality and under-five mortality rate with
the trends of mortality rates drawn from several nationally representative surveys. Comparing the
mortality rates computed from vital statistics with the rates from different surveys, I find that the
former are slightly lower in level, but the trends do not differ greatly (See Appendix Figures 14
and 15).
To measure sewerage diffusion, I use raw data from viability studies registered in the Na-
tional System of Public Investment (SNIP for its Spanish acronym) and budget reports from the
Integrated System of Financial Administration (SIAF for its Spanish acronym) of the Ministry of
Economy and Finance. These sources provide information on the number of sewerage projects
declared viable between 2005 and 2015 in a given district and detailed project-level data on the
budgeted investment and accrued investment by years. Using this information, I set as the starting
year the one in which a given project receives the first disbursement. Because the Ministry of
Sanitation does not keep a record of project completion, I follow their advice to set the year of
completion as the one in which the budgeted investment is accrued by at least 90 percent. I set the
years in which projects are under construction as the ones between start and completion. Projects
without completion year but with start year are defined as in construction until the final year of the
dataset.
I construct three alternative indicators of sewerage diffusion at the district level to identify
effects not only once the infrastructure is completed, but also during its construction phase: (i)
cumulative number of sewerage projects started; (ii) number of sewerage projects in construction;
and (iii) cumulative number of sewerage projects completed. Indicators (i) and (iii) are constructed
as cumulative given that sewerage infrastructure is a long-lasting investment whose access persists
across years, entailing complementarities across systems. An important limitation is that sanitation
projects are formulated in a sub-area of districts (the smallest jurisdictional level in Peru), but this
is not easily identifiable (i.e. no address nor geo-codes) and there is no early-life mortality data
at the same level. For projects formulated at a higher governmental level that lack of data on
the number of projects per district, I assign one project to each district within the corresponding
province or region. This approach is not capturing the intensity of sewerage diffusion within each
of the districts, but it is done in only 3.7 percent of the districts ever intervened.
6I use spatial data provided by the Ministry of Environment to compute geographic characteris-
tics influencing the cost of sewerage development. I rely on this data to construct an instrumental
variable. The spatial data includes information on surface elevation for multiple cells (1x1 km)
which I match to district boundaries in 2015. I construct indicators for four main geographical
characteristics: elevation, gradient, area and river density. First, I use the information on surface
elevation at each cell to compute the fraction of district area in four different elevation categories
considering quintiles of the elevation distribution: [0-250] meters above the level of the sea (hence-
forth mamls), {250-500] mamls, {500-1,000] mamls, and above 1,000 mamls. Second, I compute
gradient using surface elevation at each cell and neighboring cells. I construct indicators capturing
the fraction of district area falling into four gradient categories: (i) [0-0.8] percent, (ii) {0.8, 4.19]
percent, (iii) {4.19-13] percent, and (v) above 13 percent. The first category captures flat areas
below or equal 0.8 percent in which sewerage construction is costliest as determined by technical
guidelines (Panamerican Center of Sanitation Engineering and Environmental Sciences, 2005).
The remaining categories are created considering quintiles of the gradient distribution. I use quin-
tiles because this ensures enough variation across categories, while allowing capturing differences
in elevation and gradient within districts (compared to, say, using the mean per district). Appendix
Figure 16 and Figure 17 shows districts in Peru vary largely in their ruggedness and altitude. Third,
I compute the total area within the boundaries of each district. Finally, I compute river density as
the fraction of the district area that falls in inland waters. Appendix Figure 18 shows that river
density varies greatly across districts of Peru.
I draw on data from the National Register of Municipalities (RENAMU for its Spanish acronym)
to measure municipal characteristics. As explained in Section 2 only districts that had access to
Internet, high resources and approval to receive technical assistance were able to formulate and
implement sewerage projects. I control for these characteristics as a robustness check. From RE-
NAMU, I also get reports of whether water and faecal sludge is treated in the district. I use these
variables to explore whether sewerage diffusion had any impact on the removal of bacteria and
contaminants from the sources of drinking water and wastewater. Data on the treatment of water
is available only between 2008 and 2014 and data on the treatment of sludge is available between
2006 and 2014.
Furthermore, to compute measures of sewerage connectivity, I compile household-level data
from three Census rounds: 2005, 2010 and 2017. I use this data to evaluate if sewerage diffusion
increased the percentage of households connected to the public sewers. I also use this data to
compute the percentage of households with a head having attained above secondary school and
connected to the electricity network in each district. These variables are alternative outcomes
used to evaluate if sewerage diffusion affected early-life mortality rates through changes in the
population composition (i.e. selective migration).
Finally, I compute measures of other infrastructure development that could have affected early-
life mortality rates beyond sewerage diffusion. I use the SIAF budget reports from the Ministry
of Economy and Finance to identify the level of expenditure on transportation, energy and health.
7This data is available at the district level between 2007 and 2014 (2015 only available for transport
expenditure).
3.2 Descriptive statistics
Figure 1 shows that sewerage diffusion happened at both the extensive and intensive margin. Be-
tween 2005 and 2015, more than 5,000 projects were started in almost 1,200 disricts: 80 percent
of all districts were ever intervened. The majority of projects consisted in the installation of new
systems (almost 80 percent), as opposed to the improvement of old pipe networks. On average,
districts started two sewerage projects during the period of study and some districts started as
many as 95 projects.
Table 1 provides descriptive statistics for the beginning and end period of analysis. The first
and third columns provide the sum for the variables of interest and the mean for the geographical
and control variables for 2005 and 2015, respectively. The second and fourth columns provide
the standard deviation for the geographical and control variables for 2005 and 2015, respectively.
The last column shows the data source used to compute the variables. Between 2005 and 2015,
Peru started 6,090 sewerage projects, out of which 4,783 were construction and expansion of new
systems and 1,307 were improvement of existing lines. In this decade, the national infant mortality
rate decreased by almost a third from 20 to 7 per 1,000 births and the under-five mortality rate
decreased from 3 to 2 per 1000 children.
According to the 2005 Peruvian Census, Peru had 1,830 districts belonging to 196 provinces
and 25 regions. An average district had a population density of 642 people per km2 in 2005:
23 thousand people living in an average territorial area of 636 km2 . Between 2005 and 2015
the population growth rate was 1.3 percent. The table also shows descriptive statistics of the
key geographic factors influencing the cost of sewerage installation, revealing that there is great
variation within and across districts in Peru along these lines. On average, the largest share of area
of districts falls in the highest elevation category (74 percent), followed by the lowest category
(15 percent) and all categories have a relatively high standard deviation (20 percent). Districts in
the sample tend to have rugged terrains. On average, the lowest share of area falls in the flattest
gradient category (only 10 percent) and the largest share in the steepest category (37 percent).
River density is on average 53 kms per km2 and there is great variation across districts (124
standard deviation).
In the decade of study, the average revenue of a district municipality quadrupled from 4 million
to 15 million Nuevos Soles (approximately USD 4.5 million) and many municipalities gained
access to Internet; the share of municipalities with access to Internet increased from 37 percent to
92 percent. In 2005, 66 percent of municipalities were registered as requiring technical assistance
for the formulation of investment projects and 22 percent managed a health centre. The former
decreased by 9 percentage points and the latter increased by 10 percentage points by 2015. In
2005, 11 percent of the district mayors were affiliated to the government’s political party; this
share remained similar by 2015.
8Districts improved greatly their access to public services in the period of analysis. On average,
the share of households with heads having completed secondary education in a district increased
by 12 percentage points between 2005 and 2015. In 2005, on average, 56 percent of households
were connected to electricity and 25 percent to sewerage systems and 23 percent of municipalities
reported that sewage is treated in their district. The average sewerage and electricity connectiv-
ity increased by more than 20 percentage points and the percentage of municipalities reporting
that sewage effluent is treated increased by 7 percentage points. Furthermore, public expenditure
increased over the period of analysis in the transportation, energy and health sectors.
4 Empirical strategy
In order to understand the consequences of sewerage diffusion on early-life mortality, I rely on an
instrumental variable approach. In Section 4.1 I explain how I construct the instrument, followed
by Section 4.2 where I describe the estimation strategy.
4.1 Instrument: project allocation by technical suitability
The instrument I use is a prediction of how sewerage diffusion would have evolved over the decade
of study had investments been based only on exogenous cost considerations. Exploting geographic
characteristics, I rank all districts in Peru based on their technical suitability for low-cost sewerage
projects and allocate projects following this ranking, subject to a nation-wide budget constraint
and arbitrary maximum allocation threhold. The key identification assumption is that no other
factors affecting mortality rates independently moved over time along the same spatial lines as
the predicted allocation of projects. In other words, I assume that behavioural changes and the
implementation of other health policies or social infrastructure that affects early-life mortality
did not move from the most suitable districts for low-cost sewerage in early years to slightly
less suitable districts in later years. My identification strategy ultimately relies on discontinuities
created by a budget constraint and arbitrary threshold of maximum project allocation per district.
This threshold leaves extra generation capacity that is subsequently reallocated to other districts
further down the ranking. The intensity of the predicted sewerage diffusion varies across years
and districts and this forms the basis of my instrumental variable strategy. Lipscomb, Mobarak
and Barham (2013) demonstrate that isolating the variation in infrastructure linked to exogenous
geographic cost and budget considerations is useful for studying the effects of large infrastructure
projects.
Notably, relying on the technical suitability of a district makes the instrument comply with
the monotonicity assumption. While the instrument may have no effect on sewerage diffusion in
some districts, say very suitable district with low political will (never-takers) or unsuitable districts
with high political will (always-takers), all districts affected by the instrument (compliers) are
affected in the same way. In other words, all suitable districts predicted to receive more and earlier
sewerage projects are more likely to implement more sewerage projects earlier. It is sensible to
9assume that no district decreased its likelihood of experiencing sewerage diffusion by being more
technically suitable (defiers).
I follow three main steps to construct the instrument.
First: “Potential” nation-wide projects per year
For every year, I identify the number of sewerage projects that the government would have been
able to start and complete. To do so, I divide the national expenditure on sewerage projects by
the average cost of a project. The national expenditure on projects to construct new, expand and
improve sewerage systems is identified based on the total disbursement made to all sewerage
projects in a given year. The average cost of a sewerage project is calculated from the cost of
all sewerage projects. The nation-wide budget for sewerage projects increased year to year and
this generated variation over-time on the expenditure on sewerage projects. To get an idea of
the over-time variation in projects “potentially” implemented, the budget spent in 2005 allows
implementing 20 sewerage projects, in 2010 allows an additional 800 projects and in 2015 an
additional 950 projects (see Figure 2).
Second: Ranking of districts based on technical suitability index
For each district, I compute an index that captures its technical suitability for implementing low-
cost sewerage systems. Although sewerage diffusion is likely to respond mainly to demand-side
factors, such as socio-economic characteristics and political will, it also responds to exogenous
geographical factors.
The gradient of the terrain plays a major role in determining a district’s suitability for low-cost
projects. The cheapest sewerage system is the conventional gravity system, in which steepness
allows faecal sludge to flow rapidly through pipes from houses to disposal areas (Romero Rojas,
2000). Fewer pipes and lower depths are required to install pipe networks in steeper districts,
reducing even further the costs (Hammer, 1986). In very flat areas, it is necessary to install costly
electric bombs to pump water and effluent (Panamerican Center of Sanitation Engineering and
Environmental Sciences, 2005). Furthermore, elevation above the level of the sea is another to-
pographic factor that affects districts’ suitability for low-cost sewerage projects. The cheapest
wastewater treatment plant works in low altitude areas because it requires oxygen to work through
aerobic digestion (i.e. the biological decomposition of organic sludge (Romero Rojas, 2000).
Sludge requires additional costly treatment (i.e. the injection of oxygen and chemicals) in areas
with high altitude . The cost of sewerage projects also depends on the availability of water to
discharge effluent. Factors linked to geographical dispersion also affect the district’s technical
suitability for sewerage and related costs. Considering that the span of settlements is greater in
larger districts, developing sewerage systems in districts with large territorial areas requires in-
stalling longer networks of pipes. This increases both the complexity and cost of projects.
A regression of the total number of projects developed in a given district between 2005 and
2015 on the above-described geographic factors confirms the hypotheses raised by the engineering
literature. I estimate the following ordinary least square (OLS) regression:
104
X 4
X
(1) Sd = β1k Grdk + β2k Edk + β3 Ad + β4 Rd + d
k=2 k=2
where Sd is total number of sewerage projects started in district d between 2005 and 2015,
Grd is the fraction of area of district d falling in each of the three steep categories k (flat gradient
is the reference category), Ed is the fraction of area of district d falling in each of the three elevated
categories k (low altitude is the reference category), Ad is the total territorial area within district
boundaries and Rd is the district’s river density (river length in km per area in km2 ).
Table 2 column (1) presents the OLS coefficients and standard errors in brackets and column
(2) presents the standardized beta coefficients. Table 2 shows that, as predicted by the engineering
literature, steep gradient categories and river density favour sewerage diffusion, while elevation
and district area affects is negatively associated with project placement. The omitted gradient
category is the fraction of district area in the flat category (below 0.8 percent) and the omitted
elevation category is the fraction of district area in the low altitude category (below 250 mamsl).
We can see that steep gradient and elevation predicts the allocation of sewerage projects non-
monotonically: the largest coefficient is the lower-middle ({0.8, 4.19] percent) gradient category
and the highest elevation category (above 1,000 mamls).
I compute a technical suitability index for all districts in Peru using principal component anal-
ysis, including all the above-described geographic factors. The computed index is the first com-
ponent with an eigenvalue larger than 1. I rely on the index to rank all districts in Peru. The
highest-ranking districts are forecasted to receive sewerage projects earlier and more across years.
Third: Allocation of projects based on ranking and budget constraint
The final phase consists on constructing a time-variant instrument. To do so, I allocate “poten-
tial” projects across districts and years following the technical suitability rank. I start by placing
one project per district in the highest-ranking districts until the number of “potential” projects is
exhausted. For instance, for 2005, I place one project for each of the 20 highest ranking districts
because the budget spent that year amounts to the average cost of 20 projects. I follow the same
procedure for the following years until a district receives a maximum of 5 projects, which is the
median of the distribution of projects allocated in intervened districts between 2005 and 2015.
Projects that would have been allocated to higher-ranked districts that already hit the maximum
are placed in lower-ranked districts. Therefore, by 2015, the highest-ranked districts would have
received up to 5 sewerage projects, while the lowest-ranked districts would have received none.
This creates a predicted allocation roll-out that provides variation across districts and years.
Description of the instrumental variable
Figure 3 depicts actual district-wise sewerage diffusion (measured as started projects) between
2005 and 2015. There is great variation across districts and greater intensity in the affluent and
populous north coast as well as in the poorer north-centre region of the Andes. The regions that ex-
perienced relatively lower sewerage diffusion are the northeast region of the Amazon and the south
11of Peru. Figure 4 plots the number of sewerage projects predicted in each district between 2005
and 2015. In 2005, the allocation of projects starts in the northeast Amazon region of Peru. Sew-
erage then diffuses into the northwest coast and from 2009 into the southwest coast and Andean
region. By 2015, all 25 regions of Peru would have had at least one district intervened. Ignor-
ing the demand-side drivers of sewerage diffusion forces the prediction to over-allocate sewerage
projects to unattended places like the northeast Amazon area and the south coast. This weakens
the relevance of the instrument, but allows extracting the exogenous variation linked to geographi-
cal characteristics. The spatial correlation between actual and predicted sewerage diffusion seems
to be low when comparing Figure 3 and Figure 4. In fact, the correlation coefficient is 0.34. The
strength of this correlation in a model with district fixed effects determines the predictive power
of the instrumental variable estimator. I test formally the relevance of the instrument in the first-
stage estimation explained in the next section. The identification assumption is that other factors
affecting early-life mortality rates did not independently move over time along the same spatial
lines as the predicted allocation of projects.
4.2 Estimation strategy
I estimate the effect of sewerage diffusion on infant mortality and under-five mortality rates be-
tween 2005 and 2015 relying on variation in the intensity of sewerage projects started and in
construction across districts and years and using predicted sewerage diffusion as an instrument.
The instrumental variable strategy corrects for the bias introduced by the endogenous placement
of sewerage systems. To formally evaluate the relationship between actual and predicted sewerage
diffusion, I estimate the following first-stage regression:
(2) Sdt = αZdt + γd + δt + τ Pdt + νdt
where Sdt denotes the cumulative number of sewerage projects started (or number of projects
in construction or completed) and Zdt is the number of projects predicted to be started and com-
pleted in district d and year t. This first stage estimation attempts to isolate the portion of the
variation in sewerage diffusion that is attributable to exogenous cost considerations.
I estimate the effect of sewerage diffusion on infant mortality and under-five mortality rates
using the following two-stage least square (2SLS) model:
(3) M Rdt = α2 Ŝdt + γ2 d + δ2 t + τ2 Pdt + ν2 dt
where M Rdt denotes infant (1qo ) or under-5 mortality (5qo ) rates and Sˆdt is the instrumented
cumulative number of sewerage projects started (or number of projects in construction or com-
pleted) in district d and year t. Because my endogenous variable captures treatment intensity,
12there is more than one causal effect for a given district: the effect of going from 0 to 1 project,
from 1 to 2 projects, and so on. The following underlying functional relation generates the coun-
terfactuals:
(4) M Rdt = fdt (S)
Equation 4 indicates what the mortality rate of district d in year t would be for any number of
sewerage projects S, and not just for the realized value Sdt . Because Sdt takes on values in the
set 0, 1, 2, 3, Smax , there are Smax causal effects. In this case, the 2SLS estimates are a weighted
average of the unit causal response along the length of the potential nonlinear causal relation
described by fdt (S). The unit causal response is the average difference in potential mortality
rates for compliers at point S, that is, districts driven by the instrument to implement a number of
sewerage projects less than S to at least S.
The estimation strategy includes both district γd and year δt fixed effects. The former con-
trols for time-invariant characteristics in districts and the latter for annual shocks common to all
districts. In addition, all models control for time-varying population density and total district pop-
ulation (Pdt ). In some specifications, I add as covariates municipal characteristics that were cor-
related with actual sewerage diffusion (as discussed in Section 2), including indicators of whether
the district municipality has access to Internet and needs technical assistance to formulate invest-
ment projects and municipal revenue to control for public investment capabilities. I also add an
indicator of whether the municipality manages at least one health centre to control for political
will on health policy. If the instrumental variable strategy is as good as random when allocating
sewerage projects, I expect controlling for these factors to affect only slightly the point estimates.
Standard errors are clustered at the district level to deal with serial correlation due to the panel
characteristic of the data.
Table 3 that the predicted sewerage diffusion is a relevant instrument for actual sewerage dif-
fusion. This table presents the first-stage and reduced-form estimates for the cumulative number
of started sewerage projects (Panel A) and number of sewerage projects in construction (Panel B).
Column (1) in Panel A examines the cross-sectional relationship between the technical suitability
index and the total number of projects started by 2015. Column (2) and column (3) examines the
over-time relationship between predicted and actual sewerage diffusion and restrict the analysis to
the IMR and U5MR sample, respectively. The dependent variable in columns (1) to (3) is sewerage
diffusion. The dependent variable in column (4) is IMR and column (5) is U5MR. The constructed
instrument is a good predictor for actual sewerage diffusion. Using cross-sectional variation, a per-
centage point increase in the suitability index increases by 10 the total number of started projects
and this is statistically significant at the 1 percent level (Panel A). Using variation across years and
controlling for district and year fixed-effects lowers the magnitude of the first-stage coefficients,
but they remain highly significant. On average, an extra project predicted to be allocated in a
13district increases by 0.45 the cumulative number of started projects (Panel A) and 0.3 the number
of projects in construction (Panel B). The Sanderson-Windmeijer F test of excluded instruments
are high and above the rule of thumb (10) for all specifications, which confirms the relevance of
the instrument. Columns 4 and 5 show a positive effect of predicted sewerage diffusion on both
infant and under-five mortality rates, although only the latter is precisely estimated. Importantly,
when restricting the analysis to years before the start of the first project in construction in a given
district, I find that the instrument has no effect on early-life mortality.
5 Effect of sewerage construction on early-life mortality
The main result of this paper is that mortality increased in districts that were exposed to more sew-
erage projects under construction. Table 4 presents the estimated effect of the cumulative number
of started sewerage projects and the number of sewerage projects in construction on a district’s in-
fant mortality rate (henceforth IMR) and under-five mortality rate (henceforth U5MR). Columns
(1) to (4) show OLS estimates and column (5) to (8) show 2SLS estimates. All specifications
include district and year fixed-effects. While the OLS estimates suggest that sewerage diffusion is
associated with a reduction in IMR (evidence of project placement bias), the 2SLS estimates are
positive (though less precisely estimated). Both the OLS and 2SLS estimates show that sewerage
diffusion increased U5MR. The 2SLS results remain robust when including municipal characteris-
tics (columns 6 and 8). On average, an extra sewerage project started increased the IMR by 1 death
per 1,000 births and the U5MR by 0.2 deaths by 1,000 children. These results are translated into
a 1.7 percent and 4.1 percent increase, respectively, from initial average mortality rates. Only the
effect on U5MR is precisely estimate (at a 1 percent significance level) likely because the quality
of the data is better for this outcome. These unintended mortality consequences are linked to the
construction works required to install sewerage lines. The magnitude of the effect of construction
is significantly larger than the effect of start. On average, the IMR increased by 1.4 deaths per
1,000 births and the U5MR by 0.3 deaths per 1,000 children with each additional sewerage project
in construction. These results are translated into a 2.4 percent and 6.2 percent increase from initial
average mortality rates.
The effect of sewerage diffusion on under-five mortality is larger than on infant mortality be-
cause of the different population at risk in each mortality rate. While infants are mostly inside
dwellings, children often roam freely outside and hence are more exposed to outdoor pollutants
and hazards from construction works. Moreover, infants are more likely to be exclusively breast-
fed, and thus, not exposed to contaminants in drinking water.
Comparing across the OLS (columns 1-4) and 2SLS specifications (columns 5-8) we see that
the 2SLS estimates are larger. There are three possible reasons for this downward bias in OLS
estimates. First, the compliers in the IV strategy (based on district’s technical suitability for sew-
erage systems) may be different from the average district whose placement of sewerage systems
could have been affected by socio-economic and political considerations or other demand-side
14factors. Areas that experienced sewerage diffusion because of endogenous factors instead of low
cost considerations may be more able to mitigate hazards linked to the installation of sewerage
lines. Richer districts, better politically connected and with greater willingness to improve liv-
ing standards may be able to mitigate better the side-effects of sewerage construction. Second,
OLS estimates reveal the expected project placement bias since richer municipalities with lower
mortality experienced greater diffusion. Finally, the sewerage diffusion variable constructed by
combining administrative records likely suffers from classical measurement error, while the geo-
graphical variables used to predict the placement of sewerage projects are measured quite precisely
(based on 1x1 km satellite maps). The 2SLS estimates may be correcting the measurement error
in the independent variable and addressing the associated attenuation bias.
Ignoring heterogeneity driven by treatment intensity, I also find a positive effect of a district
ever being intervened on early-life mortality rates (see Appendix section 8.1). A variety of sen-
sitivy checks bolster the robustness of the main results. I estimate the 2SLS model with district
and year fixed-effects (without municipal controls) with a series of modifications. First, I restrict
the sample of analysis to districts that started at least one sewerage project to make the sample
of study more comparable. Furthermore, I exclude the capital and main province of Peru, Lima,
and add an indicator of whether the district is located in the Amazon region given that peculiar
factors of these areas could be driving the results. Finally, I replace the independent variable with
a version top-coded at the 90th percentile of the distribution of sewerage projects to ensure that
the results are not driven by outliers. The magnitude and precision of the estimated effect of an
extra started sewerage project as well as an extra sewerage project in construction on under-five
mortality rates remain robust and highly significant (see Appendix section 8.2).
5.1 Validity of the instrument
To interpret the results as the causal effect of sewerage diffusion on early-life mortality, the ex-
clusion restriction must hold. In other words, the predicted sewerage diffusion across districts
and years must affect IMR and U5MR only through actual sewerage diffusion. In this section, I
provide evidence that supports the internal validity of the results.
The main threat to my identification strategy is the delivery of other infrastructure that could
affect early-life mortality. On the one hand, infrastructure is frequently developed as a bundle. The
estimated results could be driven by other types of infrastructure that are developed following the
same spatial and temporal pattern as my instrument if these also pose health hazards, such as pol-
lution from roads and energy plants (Marcus, 2017; Gupta and Spears, 2017). On the other hand,
the allocation of funds to develop sewerage may move away funds from infrastructure beneficial
for mortality. My results could be explained by other types of infrastructure that are beneficial
for early-life health, but developed following the opposite pattern to my instrument. To alleviate
these concerns, I control for district expenditure on transportation, energy and health. Table 5
presents the estimates on the impact of sewerage diffusion on U5MR when progressively includ-
ing the above-mentioned controls to check if the sewerage diffusion channel holds. This exercise
15confirms the main results: on average, an extra sewerage project started increased the U5MR. The
magnitude of the estimate remains similar, even greater than the original estimate when controlling
for transport and health expenditure. Controlling for energy expenditure decreases the precision
of the estimated effect of sewerage diffusion on U5MR, but this could be attributable to a decrease
in sample size.
I further explore if the alternative infrastructure investments could explain the direct effect of
the instrument on early-life mortality. In other words, I test whether my instrument is a strong
predictor of variation in other infrastructure expenditure, and if so, if the predicted variation can
explain the increase in mortality rates. Table 6 presents 2SLS estimates of transport, energy and
health expenditure on early-life mortality rates using the predicted sewerage diffusion as an in-
strument. Columns (1) to (3) show the estimated effect on IMR and (4) to (5) on U5MR. None
of the three alternative infrastructure developments explains the estimated effects in mortality. No
estimate is statistically significant and in all cases the first-stage is weak.
Another concern would be if the instrument is capturing variation driven by a specific region
with greater suitability for low-cost sewerage projects. In Table 7, I test the robustness of the es-
timated effect of sewerage diffusion on U5MR when controlling for geography-specific trends. I
include as controls the following components interacted with year: in column (1) the flat gradient
category, column (2) the low elevation category, column (3) the district area in km2 , column (4)
a categorical variable capturing the three main geographical regions of Peru (coast, highlands and
jungle), and column (5) an indicator for the Amazon region. The estimated effect of sewerage dif-
fusion on U5MR remains robust: controlling for geographic-specific trends has little effect on the
first-stage power, the 2SLS point estimates and the statistical significance. When controlling for
elevation-specific trends, the magnitude remains similar, but the precision and F-test of excluded
instrument are lower. This finding reveals that elevation is an important driver of the variation
used in the instrument.
Another threat to my identification strategy is if my instrument is correlated with the distri-
bution of rural population across districts. Because the instrument is computed using geographic
factors such as gradient and elevation that are likely to affect residential sorting, the results could
be driven by channels other than sewerage diffusion. Flat and steep districts with greater river
density may be beneficial for agriculture and attract households with farming as their main occu-
pation. This sorting could explain the main results since rurality has long being associated with
higher mortality rates (Hathi et al., 2017). Figure 5 shows that the computed instrument does
not correlate with rural population: districts with a percentage of rural population above the me-
dian by 2005 where have an identical distribution of predicted sewerage projects as those with a
percentage of rural population below the median.
5.2 Mechanisms
There are several explanations for the observed rise in infant and under-five mortality and I perform
tests to shed lights on possible mechanisms.
16I first investigate whether sewerage diffusion affected early-life mortality rates through migra-
tion. The observed increase in mortality rates could be a result of a decrease in the denominator,
namely the number of live births (IMR denominator) and the number of children under 5 years
old (U5MR denominator). This decrease in births and population could be due to families mov-
ing away from disruptive infrastructure works. Columns 1 and 2 in Table 8 show that this is not
the case: the estimated effects on live births and under-5 population go in the opposite direction,
meaning that coefficients of the effect of sewerage diffusion on early-life mortality are underesti-
mated. The main results could also reflect selective emigration of the most well-off households and
immigration of poorer households. Disruptive sewerage works may create incentives for well-off
household to move away, reducing houseing prices and rent and hence attracting poorer house-
holds. Columns 3 and 4 show that there is no evidence of sorting across districts. The effect
of sewerage diffusion on the number of people with completed secondary education is not sta-
tistically significant. Although there is a negative and statistically significant effect on electricity
connectivity, the results are restricted to a small sub-sample because the data is only available for
50 percent of the districts of analysis and for 2 years.
5.2.1 Effects by cause of death
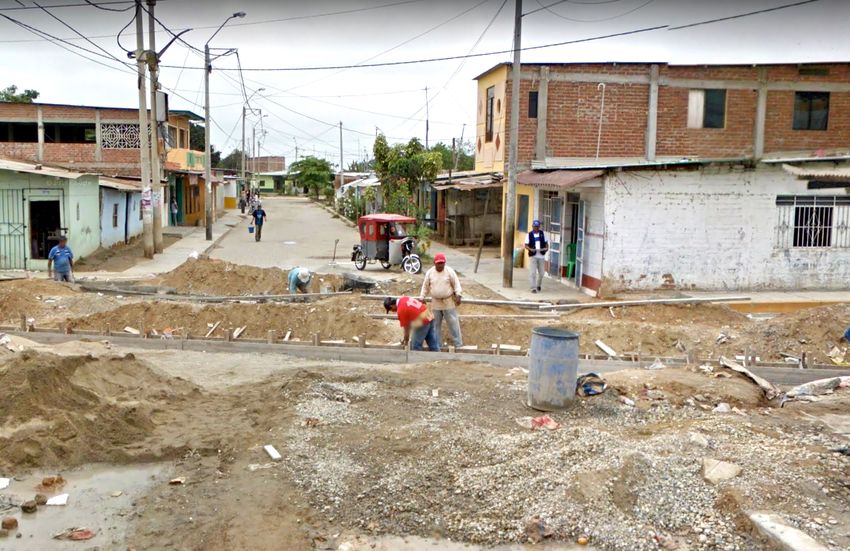
Under-five mortality may increase due to poor-quality implementation of sewerage infrastruture
works. Open ditches from the excavation works required to install sewerage pipes pose a number
of hazards to children. Environmental dangers documented in Peru are linked to dust particles,
stagnated ground water that created sources of vector-borne diseases and the use of ditches as
landfill sites (El Comercio, 2018). Shockingly, there is evidence of children falling and drowning
in ditches from sewerage works that were as deep as two meters, got filled with water from nearby
sources and had no security fence (Correo, 2018). Another important risk linked to open ditches
is traffic diversion into previously quite residential areas. An interview with an engineer expert
on the implementation of sewerage projects disclosed that contractors frequently divert traffic
in an unorganized matter —not putting in place effective signalling systems and this results in
greater traffic accidents. An additional example of precarious technical implementation is how
contractors handle old pipe networks when expanding sewerage networks from systems already
in place. Safely handling wastewater from old pipes is costly and thus contractors lack incentives
to prevent faecal sludge from running into residential areas. An interview with the Leader of
the World Banks Water and Sanitation Programme in Peru revealed that in areas where drinking
piped-water supply is intermittent and in the presence of cracks in water pipes, sewage leaks can
be absorbed by water pipes once water provision is resumed. Ingesting faecal matter through
drinking water has fatal consequences for young children.
Table 9 investigates the effect of sewerage in construction on different measures of mortality
depending on the diseases and related-health problems that caused the death. The mortality data
is disaggregated for general pathology groups following the WHO International Classification of
Diseases (ICD 10). The outcome in column (1) is all deaths caused by water-borne diseases,
17including: infectious diseases (ICD-10 category I), peri-natal complications (ICD-10 category
XVI), diseases of the digestive system (ICD-10 category XI) and malnutrition and other nutritional
deficiencies (ICD-10 category IV). The outcome in column (2) is the mortality rate linked to
external causes (ICD-10 category XX), which mostly include deaths caused by falls, drowning and
traffic-related accidents. The following columns estimates the effect of sewerage works on deaths
unrelated to sanitation and construction works. The outcome in column (3) is the mortality rate
resulting from diseases of the respiratory system (category X) and in column (4) is the mortality
rate due to congenital malformations mortality rate (ICD-10 category XVII). The outcome in
column (5) is the mortality rate linked to all unrelated factors, including diseases of the nervous
system (ICD-10 category VI), circulatory system (ICD-10 category IX) and neoplasms (ICD-10
category II).
If sewerage diffusion affects mortality through failures during the construction period and my
estimates are well identified, we would only observe an increase in the U5MR of deaths caused
by infections and accidents. I line with this prediction, I find that an extra sewerage project in
construction increased the U5MR caused by water-borne diseases by 0.2 deaths per 1,000 children
(9.4 percent increase from the initial rate) and the U5MR caused by accidents by 0.12 deaths per
1,000 children (9.6 percent increase from the initial rate). Notably, I find no effect of sewerage
diffusion on unrelated causes.
5.2.2 Delays and project non-completion
Delays and mid-construction abandonment of sewerage projects may exacerbate the hazards that
the implementation phase pose to infants and children. Strikingly, between 2005 and 2014, only
half of the projects that ever received funds were completed (see Figure 6). This reveals that a
large share of started sewerage projects was left unfinished. Interviews with local engineers indi-
cate that an average sewerage project takes one year to be completed, but delays are frequent. For
projects started and completed between 2005 and 2015, the mode and median completion time is
two years. From the pool of projects started after 2005, only 50 percent of the projects took less
than 5 years to be completed (Figure 7). All together, this is evidence of frequent delays and high
mid-construction abandonment of sewerage projects in Peru. To shed lights on the determinants
of project non-completion and duration, I formally estimate a discrete-time hazard model of the
probability of completing sewerage projects and the years that take to complete a project. Ap-
pendix 8.4 shows that political dynamics as well as project and municipal characteristics affect
project completion and duration.
I formally evaluate the effect of the time exposed to the construction of sewerage systems on
early-life mortality. To do so, I compute the total years that each district is exposed to construction
works between 2005 and 2015. I use the maximum number of sewerage projects predicted to be
developed in a given district as an instrument for years exposed to construction. The first-stage
reveals that the technical suitability for low-cost projects also predicts districts being exposed to
construction works for longer, even conditional on the number of started projects. This positive as-
18You can also read