CENTR AL SLOPES - PROJECTIONS - CLUSTER REPO RT - FOR AUSTRALIA S NRM REGIONS - Climate change in Australia
←
→
Page content transcription
If your browser does not render page correctly, please read the page content below

CENTR A L SLO PES
      CLU STER REPO RT

     PR O J E C T I ON S
FOR AUSTRALIA´S NRM REGIONS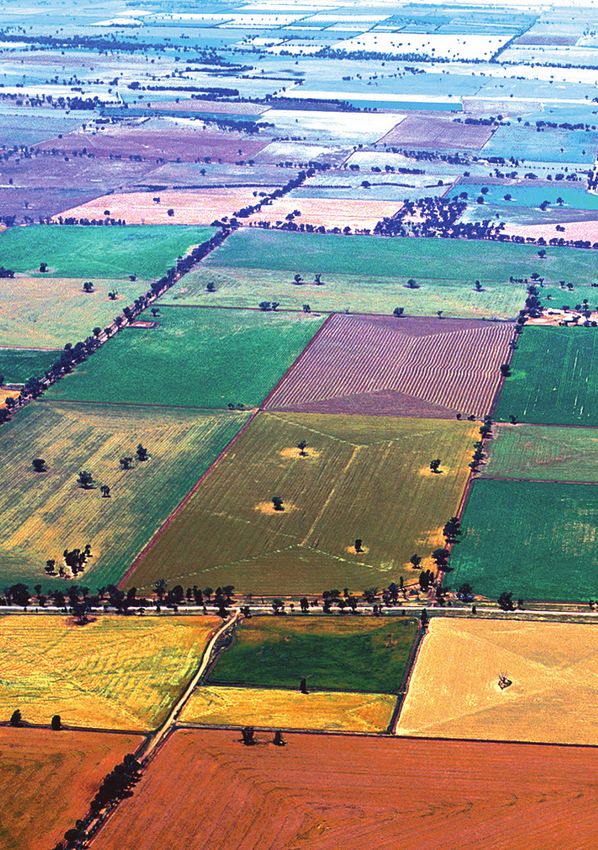
CENTR A L SLO PES
      CLU STER REPO RT

     P R OJ E C T I ON S
FOR AUSTRALIA´S NRM REGIONS
© CSIRO 2015

CLIMATE CHANGE IN AUSTRALIA PROJECTIONS
CLUSTER REPORT – CENTRAL SLOPES

ISBN
Print: 978-1-4863-0418-9
Online: 978-1-4863-0419-6

CITATION
Ekström, M. et al. 2015, Central Slopes Cluster Report, Climate
Change in Australia Projections for Australia’s Natural
Resource Management Regions: Cluster Reports, eds.
Ekström, M. et al., CSIRO and Bureau of Meteorology,
Australia.

CONTACTS
E: enquiries@csiro.au
T: 1300 363 400

ACKNOWLEDGEMENTS                                                  COPYRIGHT AND DISCLAIMER
Lead Author – Marie Ekström.                                      © 2015 CSIRO and the Bureau of Meteorology. To the extent
                                                                  permitted by law, all rights are reserved and no part of this
Contributing Authors – Debbie Abbs, Jonas Bhend,                  publication covered by copyright may be reproduced or
Francis Chiew, Dewi Kirono, Chris Lucas, Kathleen McInnes,        copied in any form or by any means except with the written
Aurel Moise, Freddie Mpelasoka, Leanne Webb and                   permission of CSIRO and the Bureau of Meteorology.
Penny Whetton.
Editors – Marie Ekström, Penny Whetton, Chris Gerbing,            IMPORTANT DISCLAIMER
Michael Grose, Leanne Webb and James Risbey.                      CSIRO and the Bureau of Meteorology advise that the
Additional acknowledgements – Janice Bathols, Tim Bedin,          information contained in this publication comprises general
John Clarke, Tim Erwin, Craig Heady, Peter Hoffman,               statements based on scientific research. The reader is
Jack Katzfey, Tony Rafter, Surendra Rauniyar,                     advised and needs to be aware that such information may
Bertrand Timbal, Yang Wang and Louise Wilson.                     be incomplete or unable to be used in any specific situation.
                                                                  No reliance or actions must therefore be made on that
Project coordinators – Kevin Hennessy, Paul Holper and            information without seeking prior expert professional,
Mandy Hopkins.                                                    scientific and technical advice. To the extent permitted
Design and editorial support – Alicia Annable,                    by law, CSIRO and the Bureau of Meteorology (including
Siobhan Duffy, Liz Butler, and Peter Van Der Merwe.               their employees and consultants) exclude all liability to any
                                                                  person for any consequences, including but not limited
We gratefully acknowledge the project funding provided            to all losses, damages, costs, expenses and any other
by the Department of the Environment through the                  compensation, arising directly or indirectly from using this
Regional Natural Resource Management Planning for                 publication (in part or in whole) and any information or
Climate Change Fund and thank all the participants in this        material contained in it.
project. We also thank Andrew Tait, Michael Hutchinson,
David Karoly and reviewers from CSIRO, Bureau of
Meteorology and the Department of the Environment for
                                                                  This report has been printed on ecoStar, a recycled paper
their invaluable contributions.
                                                                  made from 100% post-consumer waste.
We acknowledge the World Climate Research Programme’s
Working Group on Coupled Modelling, which is responsible
for CMIP, and we thank the climate modelling groups
for producing and making available their model output.
For CMIP the U.S. Department of Energy’s Program for
Climate Model Diagnosis and Intercomparison provides
coordinating support and led development of software
infrastructure in partnership with the Global Organization
for Earth System Science Portals.
c luste r r e po rt: C E NTR A L SLO PES                                             1

TABLE OF CONTENTS

PREFACE .  .  .  .  .  .  .  .  .  .  .  .  .  .  .  .  .  .  .  .  .  .  .  .  .  .  .  .  .  .  .  .  .  .  .  .  .  .  .  .  .  .  .  .  .  .  .  .  .  .  .  .  .  .  .  .  .  .  .  .  .  .  .  .  .  .  .  .  .  .  .  .  .  .  . 2

EXECUTIVE SUMMARY .  .  .  .  .  .  .  .  .  .  .  .  .  .  .  .  .  .  .  .  .  .  .  .  .  .  .  .  .  .  .  .  .  .  .  .  .  .  .  .  .  .  .  .  .  .  .  .  .  .  .  .  .  .  .  .  .  .  .  .  .  .  . 4

1            THE CENTRAL SLOPES CLUSTER .  .  .  .  .  .  .  .  .  .  .  .  .  .  .  .  .  .  .  .  .  .  .  .  .  .  .  .  .  .  .  .  .  .  .  .  .  .  .  .  .  .  .  .  .  .  .  .  .  . 7

2            CLIMATE OF CENTRAL SLOPES. .  .  .  .  .  .  .  .  .  .  .  .  .  .  .  .  .  .  .  .  .  .  .  .  .  .  .  .  .  .  .  .  .  .  .  .  .  .  .  .  .  .  .  .  .  .  .  .  .  .  . 8

3            SIMULATING REGIONAL CLIMATE .  .  .  .  .  .  .  .  .  .  .  .  .  .  .  .  .  .  .  .  .  .  .  .  .  .  .  .  .  .  .  .  .  .  .  .  .  .  .  .  .  .  .  .  .  .  .  .  . 10

4            THE CHANGING CLIMATE OF THE CENTRAL SLOPES .  .  .  .  .  .  .  .  .  .  .  .  .  .  .  .  .  .  .  .  .  .  .  .  .  .  .  .  .  .  .  .  . 13
             4.1          Ranges of projected climate change and confidence in projections.  .  .  .  .  .  .  .  .  .  .  .  .  .  .  .  .  .  .  .  .  .  .  .  .  .  . 14
             4.2          Temperature.  .  .  .  .  .  .  .  .  .  .  .  .  .  .  .  .  .  .  .  .  .  .  .  .  .  .  .  .  .  .  .  .  .  .  .  .  .  .  .  .  .  .  .  .  .  .  .  .  .  .  .  .  .  .  .  .  .  .  .  .  .  .  .  .  .  .  .  .  .  .  . 15
                          4.2.1          Extremes .  .  .  .  .  .  .  .  .  .  .  .  .  .  .  .  .  .  .  .  .  .  .  .  .  .  .  .  .  .  .  .  .  .  .  .  .  .  .  .  .  .  .  .  .  .  .  .  .  .  .  .  .  .  .  .  .  .  .  .  .  .  .  .  .  .  .  .  . 19
             4.3          Rainfall .  .  .  .  .  .  .  .  .  .  .  .  .  .  .  .  .  .  .  .  .  .  .  .  .  .  .  .  .  .  .  .  .  .  .  .  .  .  .  .  .  .  .  .  .  .  .  .  .  .  .  .  .  .  .  .  .  .  .  .  .  .  .  .  .  .  .  .  .  .  .  .  .  .  .  . 21
                          4.3.1          Heavy rainfall events .  .  .  .  .  .  .  .  .  .  .  .  .  .  .  .  .  .  .  .  .  .  .  .  .  .  .  .  .  .  .  .  .  .  .  .  .  .  .  .  .  .  .  .  .  .  .  .  .  .  .  .  .  .  .  .  .  .  . 23
                          4.3.2 Drought.  .  .  .  .  .  .  .  .  .  .  .  .  .  .  .  .  .  .  .  .  .  .  .  .  .  .  .  .  .  .  .  .  .  .  .  .  .  .  .  .  .  .  .  .  .  .  .  .  .  .  .  .  .  .  .  .  .  .  .  .  .  .  .  .  .  .  .  .  . 24
             4.4          Winds, storms and weather systems .  .  .  .  .  .  .  .  .  .  .  .  .  .  .  .  .  .  .  .  .  .  .  .  .  .  .  .  .  .  .  .  .  .  .  .  .  .  .  .  .  .  .  .  .  .  .  .  .  .  .  . 25
                          4.4.1 Mean winds.  .  .  .  .  .  .  .  .  .  .  .  .  .  .  .  .  .  .  .  .  .  .  .  .  .  .  .  .  .  .  .  .  .  .  .  .  .  .  .  .  .  .  .  .  .  .  .  .  .  .  .  .  .  .  .  .  .  .  .  .  .  .  .  .  .  . 25
                          4.4.2 Extreme winds .  .  .  .  .  .  .  .  .  .  .  .  .  .  .  .  .  .  .  .  .  .  .  .  .  .  .  .  .  .  .  .  .  .  .  .  .  .  .  .  .  .  .  .  .  .  .  .  .  .  .  .  .  .  .  .  .  .  .  .  .  .  .  . 26
                          4.4.3 Tropical and extra-tropical cyclones.  .  .  .  .  .  .  .  .  .  .  .  .  .  .  .  .  .  .  .  .  .  .  .  .  .  .  .  .  .  .  .  .  .  .  .  .  .  .  .  .  .  .  .  .  .  . 26
             4.5          Solar radiation.  .  .  .  .  .  .  .  .  .  .  .  .  .  .  .  .  .  .  .  .  .  .  .  .  .  .  .  .  .  .  .  .  .  .  .  .  .  .  .  .  .  .  .  .  .  .  .  .  .  .  .  .  .  .  .  .  .  .  .  .  .  .  .  .  .  .  .  .  . 27
             4.6          Relative humidity. .  .  .  .  .  .  .  .  .  .  .  .  .  .  .  .  .  .  .  .  .  .  .  .  .  .  .  .  .  .  .  .  .  .  .  .  .  .  .  .  .  .  .  .  .  .  .  .  .  .  .  .  .  .  .  .  .  .  .  .  .  .  .  .  .  .  . 27
             4.7          Potential evapotranspiration .  .  .  .  .  .  .  .  .  .  .  .  .  .  .  .  .  .  .  .  .  .  .  .  .  .  .  .  .  .  .  .  .  .  .  .  .  .  .  .  .  .  .  .  .  .  .  .  .  .  .  .  .  .  .  .  .  . 27
             4.8          Soil moisture and runoff . . . . . . . . . . . . . . . . . . . . . . . . . . . . . . . . . . . . . . . . . . . . . . . . . . . . . . . . . . . . . 28
             4.9          Fire weather .  .  .  .  .  .  .  .  .  .  .  .  .  .  .  .  .  .  .  .  .  .  .  .  .  .  .  .  .  .  .  .  .  .  .  .  .  .  .  .  .  .  .  .  .  .  .  .  .  .  .  .  .  .  .  .  .  .  .  .  .  .  .  .  .  .  .  .  .  .  . 29
             4.10         Other projection material for the cluster .  .  .  .  .  .  .  .  .  .  .  .  .  .  .  .  .  .  .  .  .  .  .  .  .  .  .  .  .  .  .  .  .  .  .  .  .  .  .  .  .  .  .  .  .  .  .  . 30

5            APPLYING THE REGIONAL PROJECTIONS IN ADAPTATION PLANNING.  .  .  .  .  .  .  .  .  .  .  .  .  .  .  .  .  .  . 31
             5.1          Identifying future climate scenarios .  .  .  .  .  .  .  .  .  .  .  .  .  .  .  .  .  .  .  .  .  .  .  .  .  .  .  .  .  .  .  .  .  .  .  .  .  .  .  .  .  .  .  .  .  .  .  .  .  .  .  . 31
             5.2          Developing climate scenarios using the Climate Futures tool.  .  .  .  .  .  .  .  .  .  .  .  .  .  .  .  .  .  .  .  .  .  .  .  .  .  .  .  .  .  .  . 32

REFERENCES.  .  .  .  .  .  .  .  .  .  .  .  .  .  .  .  .  .  .  .  .  .  .  .  .  .  .  .  .  .  .  .  .  .  .  .  .  .  .  .  .  .  .  .  .  .  .  .  .  .  .  .  .  .  .  .  .  .  .  .  .  .  .  .  .  .  .  .  .  .  .  . 35

APPENDIX. .  .  .  .  .  .  .  .  .  .  .  .  .  .  .  .  .  .  .  .  .  .  .  .  .  .  .  .  .  .  .  .  .  .  .  .  .  .  .  .  .  .  .  .  .  .  .  .  .  .  .  .  .  .  .  .  .  .  .  .  .  .  .  .  .  .  .  .  .  .  .  .  . 38

ABBREVIATIONS .  .  .  .  .  .  .  .  .  .  .  .  .  .  .  .  .  .  .  .  .  .  .  .  .  .  .  .  .  .  .  .  .  .  .  .  .  .  .  .  .  .  .  .  .  .  .  .  .  .  .  .  .  .  .  .  .  .  .  .  .  .  .  .  .  .  .  . 41

NRM GLOSSARY OF TERMS .  .  .  .  .  .  .  .  .  .  .  .  .  .  .  .  .  .  .  .  .  .  .  .  .  .  .  .  .  .  .  .  .  .  .  .  .  .  .  .  .  .  .  .  .  .  .  .  .  .  .  .  .  .  .  .  .  . 42
2       C L I M AT E C H A N G E I N A U S T R A L I A

PREFACE

Australia’s changing climate represents a significant              In recognition of the impact of climate change on the
challenge to individuals, communities, governments,                management of Australia’s natural resources, the Australian
businesses and the environment. Australia has already              Government developed the Regional Natural Resource
experienced increasing temperatures, shifting rainfall             Management Planning for Climate Change Fund. This fund
patterns and rising oceans.                                        has enabled significant research into the impact of the
                                                                   future climate on Australia’s natural resources, as well as
The Intergovernmental Panel on Climate Change (IPCC)
                                                                   adaptation opportunities for protecting and managing our
Fifth Assessment Report (IPCC 2013) rigorously assessed the
                                                                   land, soil, water, plants and animals.
current state and future of the global climate system. The
report concluded that:                                             Australia has 54 natural resource management (NRM)
                                                                   regions, which are defined by catchments and bioregions.
•       greenhouse gas emissions have markedly increased as a
                                                                   Many activities of organisations and ecosystem services
        result of human activities
                                                                   within the NRM regions are vulnerable to impacts of
•       human influence has been detected in warming of the        climate change.
        atmosphere and the ocean, in changes in the global
                                                                   For this report, these NRM regions are grouped into
        water cycle, in reductions in snow and ice, in global
                                                                   ‘clusters’, which largely correspond to the broad-scale
        mean sea level rise, and in changes in some climate
                                                                   climate and biophysical regions of Australia (Figure A). The
        extremes
                                                                   clusters are diverse in their history, population, resource
•       it is extremely likely that human influence has been the   base, geography and climate. Therefore, each cluster has a
        dominant cause of the observed warming since the mid-      unique set of priorities for responding to climate change.
        20th century
                                                                   CSIRO and the Australian Bureau of Meteorology have
•       continued emissions of greenhouse gases will cause         prepared tailored climate change projection reports for each
        further warming and changes in all components of the       NRM cluster. These projections provide guidance on the
        climate system.                                            changes in climate that need to be considered in planning.

FIGURE A: THE EIGHT NATURAL RESOURCE MANAGEMENT (NRM) CLUSTERS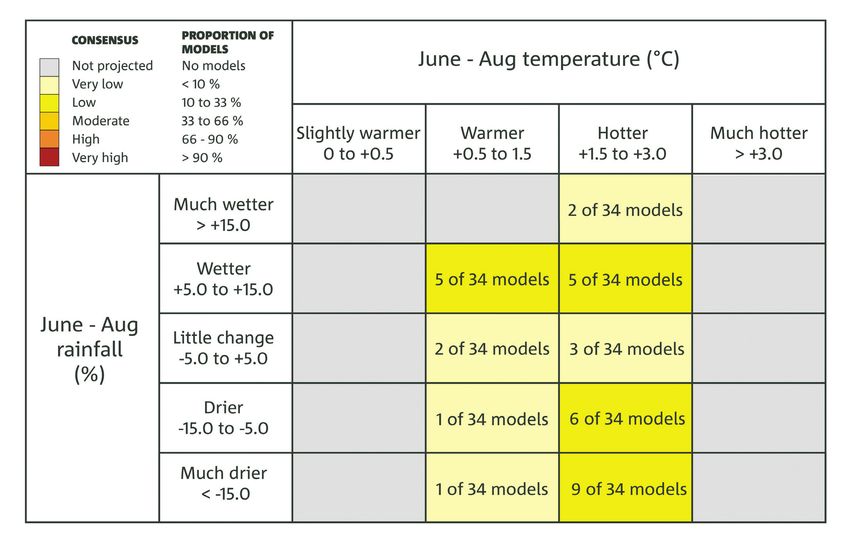
c luste r r e po rt: C E NTR A L SLO PES   3

This is the regional projections report for the Central           The projections in this report are based on the outputs
Slopes cluster. This document provides projections in a           of sophisticated global climate models (GCMs). GCMs are
straightforward and concise format with information about         based on the laws of physics, and have been developed
the cluster as a whole, as well as additional information at      over many years in numerous centres around the world.
finer scales where appropriate.                                   These models are rigorously tested for their ability to
                                                                  reproduce past climate. The projections in this report
This cluster report is part of a suite of products. These
                                                                  primarily use output from the ensemble of model
include a brochure for each cluster that provides the key
                                                                  simulations brought together for the Coupled Model Inter-
projection statements in a brief format. There is also the
                                                                  comparison Project phase 5 (CMIP5) (Taylor et al., 2012),
Australian climate change projections Technical Report,
                                                                  where phase 5 is the most recent comparison of model
which describes the underlying scientific basis for the climate
                                                                  simulations addressing, amongst other things, projections
change projections. Box 1 describes all supporting products.
                                                                  of future climates. In this report, outputs from GCMs in
This report provides the most up to date, comprehensive           the CMIP5 archive are complemented by regional climate
and robust information available for this part of Australia,      modelling and statistical downscaling.
and draws on both international and national data
resources and published peer-reviewed literature.

  BOX 1: CLIMATE CHANGE IN AUSTRALIA – PRODUCTS
  This report is part of a suite of Climate Change in             in other products. It contains an extensive set of figures
  Australia (CCIA) products prepared with support from            and descriptions on recent Australian climate trends,
  the Australian Government’s Regional Natural Resource           global climate change science, climate model evaluation
  Management Planning for Climate Change Fund.                    processes, modelling methodologies and downscaling
  These products provide information on climate change            approaches. The report includes a chapter describing
  projections and their application.                              how to use climate change data in risk assessment and
                                                                  adaptation planning.
  CLUSTER BROCHURES
  Purpose: key regional messages for everyone
                                                                  WEB PORTAL
                                                                  URL: www.climatechangeinaustralia.gov.au
  A set of brochures that summarise key climate change
                                                                  Purpose: one stop shop for products, data and learning
  projections for each of the eight clusters. The brochures
  are a useful tool for community engagement.                     The CCIA website is for Australians to find comprehensive
                                                                  information about the future climate. This includes
  CLUSTER REPORTS                                                 some information on the impacts of climate change that
                                                                  communities, including the natural resource management
  Purpose: regional detail for planners and decision-makers
                                                                  sector, can use as a basis for future adaptation planning.
  The cluster reports are to assist regional decision-makers      Users can interactively explore a range of variables and
  in understanding the important messages deduced from            their changes to the end of the 21st century. A ‘Climate
  climate change projection modelling. The cluster reports        Campus’ educational section is also available. This
  present a range of emissions scenarios across multiple          explains the science of climate change and how climate
  variables and years. They also include relevant sub-cluster     change projections are created.
  level information in cases where distinct messages are
                                                                  Information about climate observations can be found
  evident in the projections.
                                                                  on the Bureau of Meteorology website (www.bom.gov.
                                                                  au/climate). Observations of past climate are used as a
  TECHNICAL REPORT                                                baseline for climate projections, and also in evaluating
  Purpose: technical information for researchers and              model performance.
  decision-makers
  A comprehensive report outlining the key climate change
  projection messages for Australia across a range of
  variables. The report underpins all information found
4      C L I M AT E C H A N G E I N A U S T R A L I A

EXECUTIVE SUMMARY

INTRODUCTION                                                     HIGHER TEMPERATURES
This report presents projections of future climate for the       Temperatures in the cluster increased by
Central Slopes. These projections are based on our current       0.8 °C between 1910 and 2013 (especially
understanding of the climate system, historical trends and       since 1960) using a linear trend. For the same
model simulations of the climate response to changing            period, daytime maximum temperatures have
greenhouse gas and aerosol emissions. The simulated              increased by 0.4 °C while overnight minimum temperatures
climate response is that of the CMIP5 model archive, which       have increased by 1.2 °C using a linear trend.
also underpins the science of the Fifth Assessment Report of
                                                                 Continued substantial warming for the Central Slopes
the Intergovernmental Panel on Climate Change (IPCC, 2013).
                                                                 cluster for daily mean, maximum and minimum
The global climate model (GCM) simulations presented here        temperature is projected with very high confidence, taking
represent the full range of emission scenarios, as defined       into consideration the robust understanding of the driving
by the Representative Concentration Pathways (RCPs) used         mechanisms of warming, as well as the strong agreement
by the IPCC, with a particular focus on RCP4.5 and RCP8.5.       on direction and magnitude of change amongst GCMs and
The former represents a pathway consistent with low-level        downscaling results.
emissions, which stabilise the carbon dioxide concentration
                                                                 For the near future (2030), the mean warming is around 0.6 to
at about 540 ppm by the end of the 21st century. The latter
                                                                 1.5 °C relative to the climate of 1986–2005, with only a minor
is representative of a high-emission scenario, for which the
                                                                 difference between RCPs. For late in the 21st century (2090) it
carbon dioxide concentration reaches about 940 ppm by
                                                                 is 1.4 to 2.7 °C under RCP4.5, and 3 to 5.4 °C under RCP8.5.
the end of the 21st century.
Projections are generally given for two 20-year time
periods: the near future 2020–2039 (herein referred to as
                                                                 HOTTER AND MORE FREQUENT
2030) and late in the century 2080–2099 (herein referred to      HOT DAYS. LESS FROST
as 2090). The spread of model results are presented as the       A substantial increase in the temperature
range between the 10th and 90th percentile in the CMIP5          reached on the hottest days, the frequency of
ensemble output. For each time period, the model spread          hot days, and the duration of warm spells, is
can be attributed to three sources of uncertainty: the range     projected by 2090. Very high model agreement and strong
of future emissions, the climate response of the models,         physical understanding lead to very high confidence in these
and natural variability. Climate projections do not make a       projected changes. For example, relative to a 30 year period
forecast of the exact sequence of natural variability, so they   centred on 1995 the number of days above 35 °C in the town
are not ‘predictions’. They do however show a plausible          of Dubbo by 2090 doubles under RCP4.5, and the number
range of climate system responses to a given emission            of days over 40 °C triples. For the same town, but under
scenario and also show the range of natural variability          RCP8.5, the number of days over 35 °C nearly triples and
for a given climate. Greenhouse gas concentrations are           days over 40 °C increases nearly six times. Correspondingly,
similar amongst different RCPs for the near future, and for      a substantial decrease in the frequency of frost days is
some variables, such as rainfall, the largest range in that      projected by 2090 with high confidence. The numbers
period stems from natural variability. Later in the century,     reported for Dubbo relate to the median projection.
the differences between RCPs are more pronounced, and
climate responses may be larger than natural variability.
For each variable, the projected change is accompanied by
a confidence rating. This rating follows the method used
by the IPCC in the Fifth Assessment Report, whereby the
confidence in a projected change is assessed based on the
type, amount, quality and consistency of evidence (which
can be process understanding, theory, model output, or
expert judgment); as well as the degree of agreement
amongst the different lines of evidence (IPCC, 2013). The
confidence ratings used here are set as low, medium, high or
very high.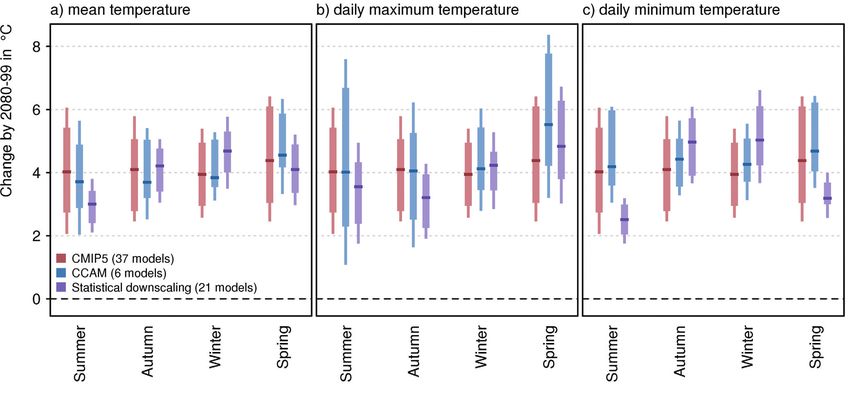
c luste r r e po rt: C E NTR A L SLO PES   5

LESS RAINFALL IN WINTER AND                                       SOME DECREASE IN WINTER WIND
SPRING, BUT CHANGES IN OTHER                                      SPEED, FEWER BUT POSSIBLY MORE
SEASONS ARE UNCLEAR                                               INTENSE EAST COAST LOWS
The cluster experienced prolonged periods of                      Overall small changes are projected with high
extensive drying in the early 20th century, but annual rainfall   confidence for mean surface wind speed under all RCPs,
shows no long-term trend throughout the 20th century.             particularly by 2030 (high confidence). Decreases in winter
                                                                  wind speeds are projected for later in the century with
There is high confidence that natural climate variability will
                                                                  medium confidence based on model results and physical
remain the major driver of rainfall changes in the next few
                                                                  understanding (relating to the southward movement of the
decades (20-year mean changes of +/- 10 % annually, and
                                                                  storm track).
+/-25 % seasonally), as it has been in the recent past.
                                                                  Decreases are also suggested for extreme wind speeds,
Decreases in winter rainfall are projected to become
                                                                  particularly for the rarer extremes under both RCP4.5 and
evident by 2090, with high confidence. There is strong
                                                                  8.5. However, low model agreement and limitations to the
model agreement and good understanding of the
                                                                  method suggest only low confidence in this projection.
contributing underlying physical mechanisms driving this
change (relating to the southward shift of winter storm           Based on global and regional studies, tropical cyclones
systems). The magnitude of possible differences from the          are projected to become more intense, but less frequent
winter climate of 1986–2005 indicated by GCM results range        (medium confidence). Changes in their movement or
from around -25 to +10 % under RCP4.5 and -40 to +15 %            frequency that may be relevant to the Central Slopes cluster
under RCP8.5. Decreases are also projected for spring, but        cannot be reliably projected. Literature suggests a decline
with medium confidence only.                                      in the number, but an increase in the intensity, of east coast
                                                                  lows which cause damaging winds.
For 2090, changes to rainfall in other seasons, and annually,
are possible. The direction of change cannot be reilably
projected, due to the complexity of rain producing systems        INCREASED SOLAR RADIATION IN
in this cluster, the large spread of model results, and           WINTER AND REDUCED HUMIDITY
inconsistent results from downscaled models. Overall, the
magnitude of possible seasonal changes, as indicated by
                                                                  THROUGHOUT THE YEAR
GCM results, range from around -30 to +25 % under RCP4.5          With high confidence, little change is projected
and -40 to +30 % under RCP8.5. Such contrasting model             for solar radiation for 2030. For 2090 under RCP4.5 and
simulations highlight the potential need to consider the risk     RCP8.5, there is medium confidence in increased winter
of both a drier and wetter climate in impact assessment in        radiation, which is related to decreases in cloudiness
this cluster.                                                     associated with reduced rainfall.
                                                                  There is high confidence in little change in relative humidity
INCREASED INTENSITY OF HEAVY                                      for 2030. For 2090 based on model results and physical
RAINFALL EVENTS, CHANGES TO                                       understanding, there is medium confidence in decreases in
                                                                  relative humidity in summer and autumn, and there is high
DROUGHT LESS CLEAR                                                confidence in decreases in relative humidity in winter and
Understanding of physical processes and high                      spring (around -6 to 0 % under RCP4.5 and -10 to 0 % under
model agreement leads to high confidence that the intensity       RCP8.5).
of heavy rainfall events will increase. The magnitude of
change, and the time when any change may be evident
against natural variability, cannot be reliably projected.
On the other hand, there is low confidence in projecting
how the frequency and duration of extreme meteorological
drought may change, although there is medium confidence
that the time spent in drought will increase over the course
of the century under RCP8.5.
6      C L I M AT E C H A N G E I N A U S T R A L I A

INCREASED EVAPORATION                                           MAKING USE OF THESE
RATES AND REDUCED SOIL                                          PROJECTIONS FOR CLIMATE
MOISTURE, CHANGES TO                                            ADAPTATION PLANNING
RUNOFF ARE LESS CLEAR                                           These regional projections provide the
With high confidence, projections for potential                 best available science to support impact assessment and
evapotranspiration indicate increases in all seasons with the   adaptation planning in the Central Slopes cluster. This
largest changes in summer by 2090. However, despite high        report provides some guidance on how to use these
model agreement, there is only medium confidence in the         projections, including the Australian Climate Futures
magnitude of the projections due to shortcomings in the         web tool, available from the Climate Change in Australia
simulation of observed historical changes.                      website. The tool allows users to investigate the range of
                                                                climate model outcomes for their region across timescales
With medium confidence, soil moisture projections suggest       and RCPs of interest, and to select and use data from
decreases predominately in winter and spring, with overall      models that represent a change of particular interest
annual decreases for later in the century. These changes        (e.g. warmer and drier conditions).
in soil moisture are strongly influenced by changes in
rainfall, but tend to be more negative due to the increase in
potential evapotranspiration. For similar reasons, runoff is
projected to decrease, but only with low confidence. More
detailed hydrological modelling is needed to assess changes
to runoff confidently.

A HARSHER FIRE-WEATHER
CLIMATE IN THE FUTURE
There is high confidence that climate change
will result in a harsher fire-weather climate in
the future. However, there is low confidence in
the magnitude of the change, as this is strongly dependent
on the rainfall projection.
c luste r r e po rt: C E NTR A L SLO PES 7
1 THE CENTRAL SLOPES CLUSTER
This report describes climate change projections for the Central Slopes cluster. The cluster is located
on the western side of the Great Dividing Range and is dominated by landforms such as tablelands,
slopes and plains. The cluster includes NRM regions in Queensland (Border Rivers, Maranoa-Balonne
and Condamine) and New South Wales (former Catchment Management Authorities of Border Rivers-
Gwydir, the Namoi and the Central West) (Figure 1.1). In January 2014, the Catchment Management
Authorities (CMA) regions of NSW were re-organised to form the new Local Land Services (LLS) regions.
The North-West, Northern Tablelands, Central-West and Central Tablelands LLS regions all have areas
included within the Central Slopes cluster.
The cluster encompasses the cropping land to the west
of the Great Dividing Range from the Darling Downs
in Queensland to the central-west of NSW. The largest
population centres within the cluster are Toowoomba in
Queensland and Dubbo in New South Wales. There are also
several important regional centres found within the cluster.
The Central Slopes cluster includes a number of important
headwater catchments for the Murray-Darling basin, and
its many slopes and plains are extensively developed for
dryland and irrigated agriculture (cereals, cotton, pulses
and oil seeds), livestock grazing and forestry. The cluster
further supports horticulture and viticulture industries.
Major natural assets in the cluster include parts of the
World Heritage Gondwana Rainforests of Australia, and
other important bioregions with extensive representation
of native flora and fauna. There are also extensive natural
deposits of coal and coal seam gas that are the focus of
extraction activities in the cluster.
A range of climate change impacts and adaptation
challenges have been identified by NRM organisations
across this cluster. These include the management of
invasive species; water security; opportunities for improved
carbon sequestration; understanding likely changes to
agricultural production including changes to the growing
conditions and yields for key crops; managing soil erosion
and land degradation; and improving the resilience of
riparian, aquatic and terrestrial ecosystems.
FIGURE 1.1: THE CENTRAL SLOPES CLUSTER AND MAIN
LOCALITIES RELATIVE TO THE AUSTRALIAN CONTINENT.8 C L I M AT E C H A N G E I N A U S T R A L I A
2 CLIMATE OF CENTRAL SLOPES
The Central Slopes cluster straddles the Queensland and NSW border immediately west of the Great
Dividing Range. This cluster encompasses a range of climates from subtropical in the north, to
temperate in the south, to grasslands towards its western border. This range of climates is caused
largely by cooler temperatures towards the south and drier conditions to the west1. In the sections
below, the current climate of Central Slopes is presented for the period 1986–2005. Box 3.1 presents the
observational data sets used in this report.
In summer (December to February), the cluster exhibits The highest temperatures are experienced in January, with
the greatest spatial variability in temperature with a clear an average daily maximum temperature of 30 to 36 °C for
north-west to south-east decline from the inner rangelands large parts of the Central Slopes cluster (Figure 2.1c). Lowest
(27 to 30 °C) towards the Great Dividing Range (18 to 24 °C) temperatures occur most commonly in July with average
(Figure 2.1a). In winter (June to August), there is a stronger minimum temperatures of 0 to 3 °C in the elevated areas
north-south gradient with 12 to 15 °C in the north and 9 to in the south-east and 3 to 6 °C for much of the remaining
12 °C in the south with somewhat lower temperatures in the cluster (Figure 2.1d). The cluster exhibits a clear seasonal
elevated areas of the Great Dividing Range (Figure 2.1b). The pattern in temperature with daily mean temperatures
annual average temperature for the entire cluster is 18.5 °C ranging from about 26 °C in summer (January) to about 10
(Figure 2.2). °C in winter (July), with maximum for the cluster about 34 °C
in January and a minimum of about 4 °C in July (Figure 2.2).
FIGURE 2.1: MAPS OF (A) AVERAGE SUMMER DAILY MEAN TEMPERATURE, (B) AVERAGE WINTER DAILY MEAN TEMPERATURE, (C) AVERAGE
JANUARY MAXIMUM DAILY TEMPERATURE AND (D) AVERAGE JULY DAILY MINIMUM TEMPERATURE FOR THE PERIOD 1986–2005.
1 http://www.bom.gov.au/iwk/climate_zones/map_1.shtmlc luste r r e po rt: C E NTR A L SLO PES 9
The seasonal rainfall characteristics in the Central Slopes
cluster are determined by complex interactions of several
rain-bearing weather systems. For example, summer
rainfall is strongly influenced by the easterly trough, an
elongated zone of low pressure formed as a result of strong
surface heating west of the Great Dividing Range. As the
trough intensifies during the course of the day, convective
storms build in the unstable air causing local showers and
thunderstorms. In the winter half of the year, fronts and
low-pressure systems, entering either from the south-west
(cut-off lows) or from the east (east coast lows), can bring
wet conditions to the cluster, particularly its southern areas.
Throughout the year, rainfall also occurs as a result of
cloud bands linked with the formation of troughs at upper
levels in the atmosphere. Regions in the sub-tropical north
also experience enhanced rainfall as a result of summer
exposure to the trade winds that bring moist, warm air
masses onto the northern part of the continent.
FIGURE 2.2: MONTHLY RAINFALL (BLUE BARS) AND
TEMPERATURE CHARACTERISTICS FOR THE CENTRAL The heaviest rainfall events usually occur in summer, with
SLOPES CLUSTER (1986–2005). TMEAN IS MONTHLY MEAN monthly 90th percentile values around 100 to 200 mm
TEMPERATURE (GREEN LINE), TMAX IS MONTHLY MEAN for the period 1900–2005. Summer thunderstorms can be
MAXIMUM TEMPERATURE (ORANGE LINE), TMIN IS MONTHLY hazardous due to accompanying winds, hail, flash floods
MEAN MINIMUM TEMPERATURE (BLUE LINE) AND ANN TMEAN
and potentially damaging lightning strikes. The north-
IS THE ANNUAL AVERAGE OF MEAN TEMPERATURE (GREY LINE)
(18.5 °C). TEMPERATURE AND RAINFALL DATA ARE FROM AWAP.
east and southern regions of the Central Slopes cluster
experience more than 25 thunder days per year, which is
higher than much of western and southern Australia, but
Rainfall in the Central Slopes cluster varies considerably much lower than values for northern Australia (Kuleshov
across space and across seasons with a typical drier winter et al., 2002).
and a wetter summer (Figure 2.2). The eastern parts see
more rainfall with a larger number of rain days. There are Year to year rainfall variability in the Central Slopes
less than 40 rain days in the west, compared with more cluster is related to changes in sea surface temperatures
than 50 rain days in the east. (SSTs) of adjacent ocean basins. For example, SSTs vary
as a consequence of the oscillation between El Niño
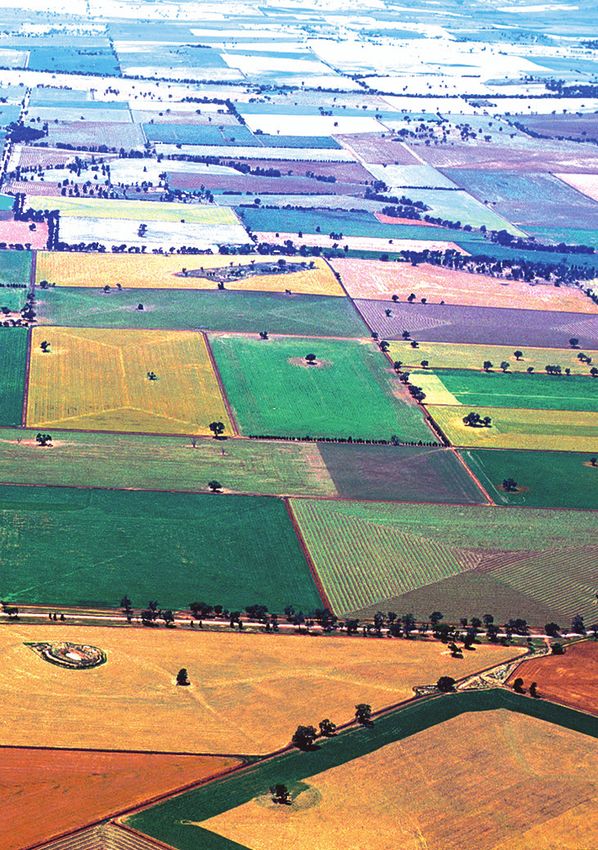
In summer (December to February), rainfall totals range from and La Niña type conditions or the variability of SSTs in
approximately 100 to 200 mm in the west, to approximately the Indian Ocean. Rainfall variations are also linked to a
200 to 300 mm in the east (Figure 2.3a). In the drier winter mode of variability known as the Southern Annular Mode
(June to August), rainfall totals are about 50 to 100 mm in the (SAM), which affects the strength of the summer easterly
north and west, with somewhat larger totals of about 100 to circulation in the region (Hendon et al., 2007). Rainfall
200 mm in the south-eastern parts (Figure 2.3b). variations are also linked to blocking high pressures
Rainfall in the current climate has experienced low to systems in the Tasman Sea, which affect variations in
moderate year to year variability relative to other parts of autumn and spring rainfall (Risbey et al., 2009). For further
Australia, most notably in the central and eastern regions. details on El Niño Southern Oscillation (ENSO), the Indian
The largest variability occurs in winter, particularly in the Ocean dipole (IOD), or SAM, refer to Chapter 4 in the
north-east regions. Technical Report.
FIGURE 2.3: FOR THE 1986–2005 PERIOD,
AVERAGE RAINFALL FOR (A) SUMMER
(DECEMBER TO FEBRUARY) AND (B) WINTER
(JUNE TO AUGUST).10 C L I M AT E C H A N G E I N A U S T R A L I A
3 SIMULATING REGIONAL CLIMATE
Researchers use climate models to examine future global and regional climate change. These
models have a foundation in well-established physical principles and are closely related to the
models used successfully in weather forecasting. Climate modelling groups from around the world
produce their own simulations of the future climate, which may be analysed and compared to
assess climate change in any region. For this report, projections are based on historical and future
climate simulations from the CMIP5 model archive. This archive holds the most recent simulations, as
submitted by approximately 20 modelling groups (Taylor et al., 2012). The number of models used in
these projections varies by RCP and variable depending on availability, e.g. for monthly temperature
and rainfall, data are available for 39 models for RCP8.5 but only 28 models for RCP2.6 (see Chapter 3
in the Technical Report).
The skill of a climate model is assessed by comparing model
simulations of the current climate with observational BOX 3.1: COMPARING MODELS AND
data sets (see Box 3.1 for details on the observed data OBSERVATIONS: EVALUATION PERIOD,
used for model evaluation for the Central Slopes cluster).
Accurate simulation of key aspects of the regional climate
OBSERVED DATA SETS, AND SPATIAL
provides a basis for placing some confidence in the RESOLUTION
model’s projections. However, models are not perfect Model skill is assessed by running simulations over
representations of the real world. Some differences in historical time periods and comparing simulations
model output relative to the observations are to be with observed climate data. Projections presented here
expected. The measure of model skill can also vary are assessed using the 1986–2005 baseline period,
depending on the scoring measure used and regions being which conforms to the IPCC Fifth Assessment Report.
assessed. (IPCC AR5, 2013). The period is also the baseline for
For the Central Slopes cluster, models performed well projected changes, as presented in bar plots and tabled
in simulating the timing and magnitude of the seasonal values in the Appendix. An exception is the time series
cycle for temperature (Figure 3.1a). The majority of models projection plots, which use a baseline of 1950-2005, as
simulate the timing of the seasonal rainfall patterns explained in Section 6.2.2 of the Technical Report.
well, although the majority of models overestimate the Several data sets are used to evaluate model
amount of rainfall in summer. There is about a 20 mm simulations of the current climate. For assessment
per month discrepancy between the model median and of rainfall and temperature, the observed data are
the observed regional mean (Figure 3.1b). In terms of derived from the Australian Water Availability Project
capturing the observed trend in temperature, models (AWAP) (Jones et al., 2009) and from the Australian
perform reasonably well. Over the 1910–2005 period, the Climate Observations Reference Network – Surface Air
multi-model mean overestimates the observed trend in Temperature (ACORN-SAT), a data set developed for the
the late spring and summer, and underestimates the trend study of long-term changes in monthly and seasonal
in winter. In the more recent period of 1960–2005, the climate (Fawcett et al., 2012).
models underestimate the observed trend through much
of the year (Figure 3.2). To see how the models performed The spatial resolution of climate model data (around
across different parts of Australia, refer to Chapter 5 in the 200 km between the edges of grid cells) is much
Technical Report. coarser than observations. For the Central Slopes
cluster, approximately half of the CMIP5 models
provide coverage by partial grid cells only (i.e. partially
included within the cluster boundaries). This means
that simulation of past and future climates should be
interpreted as representative of a region which could
include areas of adjacent clusters.c luste r r e po rt: C E NTR A L SLO PES 11 FIGURE 3.1: THE ANNUAL CYCLE OF TEMPERATURE (LEFT PANEL) AND RAINFALL (RIGHT PANEL) IN THE CENTRAL SLOPES CLUSTER SIMULATED BY CMIP5 MODELS (GREY LINES) WITH MODEL ENSEMBLE MEAN (BLACK LINE) AND OBSERVATIONS BASED ON AWAP (BROWN LINE) FOR THE BASELINE PERIOD 1986–2005. FIGURE 3.2: SIMULATED (GREY) AND OBSERVED (BROWN) SEASONAL TRENDS IN TEMPERATURE FROM (A) 1910–2005 AND (B)1960–2005. THE SOLID BLACK LINE DENOTES THE MULTI-MODEL ENSEMBLE MEAN TREND. THE OBSERVED TREND IS CALCULATED FROM ACORN-SAT DATA. The ability of CMIP5 models to simulate key modes of Sea. However, all models have at least some significant climatic variability affecting the region has been assessed. shortcomings across a range of other tests (more details Significantly, the connection between ENSO variations in Chapter 5 of the Technical Report). Some of these and rainfall is reasonably well simulated and has improved shortcomings are noted in the context of interpreting since the previous generation of climate models. Many specific projection results in the chapter that follows. models also had a reasonably accurate simulation of There was no single or small number of models that the relationship between regional rainfall and blocking clearly performed much better than others in the Central (the presence of a high pressure centre) over the Tasman Slopes cluster.
12    C L I M AT E C H A N G E I N A U S T R A L I A

In addition to the CMIP5 model results, downscaling can
be used to derive finer spatial information in the regional
projections, thus potentially capturing processes occurring
on a finer scale. While downscaling can provide added
value on finer scale processes, it increases the uncertainty
in the projections since there is no single best downscaling
method, but a range of methods that are more or less
appropriate depending on the application. It is advisable to
consider more than one technique, as different downscaling
techniques have different strengths and weaknesses.
For the regional projections we consider downscaled
projections from two techniques: outputs from a dynamical
downscaling model, the Conformal Cubic Atmospheric
Model (CCAM) (McGregor and Dix, 2008) using six CMIP5
GCMs as input; and the Bureau of Meteorology analogue-
based statistical downscaling model with 22 CMIP5
GCMs as input for rainfall and 21 CMIP5 GCMs as input
for temperature (Timbal and McAvaney, 2001). Where
relevant, projections from these methods are compared
to those from GCMs (the primary source of climate change
projections in this report). The downscaled results are
only emphasised if there are strong reasons for giving the
downscaled data more credibility than the GCM data (see
Section 6.3 in the Technical Report for further details on
downscaling).
c luste r r e po rt: C E NTR A L SLO PES   13

4      THE CHANGING CLIMATE OF THE CENTRAL SLOPES

This section presents projections of climate change to the end of the 21st century for a range of climate
variables, including average and extreme conditions, of relevance to the Central Slopes cluster. Where
there are relevant observational data available, the report shows historical trends.

As outlined in the Fifth Assessment Report (IPCC, 2013),          1.1 to 2.6 °C and 1.4 to 3.1 °C warmer for RCP4.5 and RCP6.0
greenhouse gases, such as carbon dioxide, have a warming          respectively (representing intermediate emissions); and 2.6 to
effect on global climate. Greenhouse gases absorb heat            4.8 °C warmer for RCP8.5 (representing high emissions).
that would otherwise be lost to space, and re-radiate it
                                                                  The projections for the climate of Central Slopes cluster
back into the atmosphere and to the Earth’s surface. The
                                                                  consider model ranges of change, as simulated by the CMIP5
IPCC concluded that it was extremely likely that more than
                                                                  ensemble. However, the projections should be viewed in the
half of the observed increase in global average surface
                                                                  context of the confidence ratings that are provided, which
air temperature from 1951–2010 has been caused by the
                                                                  consider a broader range of evidence than just the model
anthropogenic increase in greenhouse gas emissions
                                                                  outputs. The projected change is assessed for two 20-year
and other anthropogenic forcings. Further increases in
                                                                  periods: a near future 2020–2039 (herein referred to as 2030)
greenhouse gas concentrations, resulting primarily from
                                                                  and a period late in the 21st century, 2080–2099 (herein
burning fossil fuel, will lead to further warming, as well as
                                                                  referred to as 2090) following RCPs 2.6, 4.5 and 8.5 (Box 4.1).
other physical and chemical changes in the atmosphere,
ocean and land surface.                                           The spread of model results is presented in graphical form
                                                                  (Box 4.2) and provided as tabulated percentiles in Table 1 (10th,
The CMIP5 simulations give the climate response to a set
                                                                  50th and 90th) in the Appendix. CMIP5 results for additional
of greenhouse gas, aerosol and land-use scenarios that
                                                                  time periods between 2030 and 2090 are provided through
are consistent with socio-economic assumptions of how
                                                                  the Climate Change in Australia website (Box 1).
the future may evolve. These scenarios are known as the
Representative Concentration Pathways (RCPs) (Moss et             Unless otherwise stated, users of these projections should
al., 2010; van Vuuren et al., 2011). Box 4.1 presents a brief     consider the ranges of projected change, as indicated by the
introduction to the RCPs.                                         different plots and tabulated values, as applicable to each
                                                                  location within the cluster.
In its Fifth Assessment Report (IPCC, 2013), the IPCC concluded
that global mean surface air temperatures for 2081–2100
relative to 1986–2005 are likely to be in the following ranges:
0.3 to 1.7 °C warmer for RCP2.6 (representing low emissions);
14 C L I M AT E C H A N G E I N A U S T R A L I A
BOX 4.1: REPRESENTATIVE CONCENTRATION PATHWAYS (RCP s)
The climate projections presented in this report are the early part of the century, with emissions peaking
based on climate model simulations following a set of earlier then declining, and stabilisation of the carbon
greenhouse gas, aerosol and land-use scenarios that dioxide concentration at about 540 ppm by 2100. RCP2.6
are consistent with socio-economic assumptions of how describes emissions that peak around 2020 and then
the future may evolve. The well mixed concentrations of rapidly decline, with the carbon dioxide concentration at
greenhouse gases and aerosols in the atmosphere are about 420 ppm by 2100. It is likely that later in the century
affected by emissions as well as absorption through land active removal of carbon dioxide from the atmosphere
and ocean sinks. would be required for this scenario to be achieved. For
further details on all RCPs refer to Section 3.2 and Figure
There are four Representative Concentration Pathways
3.2.2 in the Technical Report.
(RCPs) underpinned by different emissions. They
represent a plausible range of radiative forcing (in W/m2) The previous generation of climate model experiments
during the 21st century relative to pre-industrial levels. that underpins the science of the IPCC’s Fourth Assessment
Radiative forcing is a measure of the energy absorbed Report used a different set of scenarios. These are
and retained in the lower atmosphere. The RCPs are: described in the IPCC’s Special Report on Emissions
Scenarios (SRES) (Nakićenović and Swart, 2000). The
• RCP8.5: high radiative forcing (high emissions)
RCPs and SRES scenarios do not correspond directly to
• RCP4.5 and 6.0: intermediate radiative forcing each other, though carbon dioxide concentrations under
(intermediate emissions) RCP4.5 and RCP8.5 are similar to those of SRES scenarios
B1 and A1FI respectively.
• RCP2.6: low radiative forcing (low emissions).
In the Technical and Cluster Reports, RCP6.0 is not
RCP8.5, represents a future with little curbing of
included due to a smaller sample of model simulations
emissions, with carbon dioxide concentrations
available compared to the other RCPs. Remaining RCPs
reaching 940 ppm by 2100. The higher of the two
are included in most graphical and tabulated material of
intermediate concentration pathways (RCP6.0) assumes
the Cluster Reports, with the text focusing foremost on
implementation of some mitigation strategies, with
results following RCP4.5 and RCP8.5.
carbon dioxide reaching 670 ppm by 2100. RCP4.5
describes somewhat higher emissions than RCP6.0 in
4.1 RANGES OF PROJECTED CLIMATE results is not a systematic or quantitative assessment
of the full range of possibilities, and models have some
CHANGE AND CONFIDENCE IN
known regional biases that affect confidence.
PROJECTIONS
• Natural variability (or natural ‘internal variability’
Quantitative projections of future climate change in within the climate system) can dominate over the
the Central Slopes are presented as ranges. This allows ‘forced’ climate change in some instances, particularly
for differences in how future climate may evolve due to over shorter time frames and smaller geographic
three factors – greenhouse gas and aerosol emissions, areas. The precise evolution of climate due to natural
the climate response and natural variability – that are not variability (e.g. the sequence of wet years and dry
known precisely: years) cannot be predicted (IPCC, 2013, see Chapter 11).
However, the projections presented here allow for a
• Future emissions cannot be known precisely and are
range of outcomes due to natural variability, based on
dealt with here by examining several different RCPs
the different evolutions of natural climatic variability
described in Box 4.1. There is no ‘correct’ scenario, so
contained within each of the climate model simulations.
the choice of how many and which scenarios to examine
is dependent on the decision-making context. The relative importance of each of these factors differs
• The response of the climate system to emissions is well for each variable, different timeframes and spatial scale.
known in some respects, but less well known in others. For some variables with large natural variability, such as
The thermodynamic response (direct warming) of the rainfall, the predominant reason for differing projections
atmosphere to greenhouse gases is well understood, in the early period is likely to be natural variability rather
although the global climate sensitivity varies. However, than differences in emission scenarios (the influence of
changes to atmospheric circulation in a warmer climate which becomes relatively more important as greenhouse
are one of the biggest uncertainties regarding the gas concentrations increase). In addition, unpredictable
climate response. The range between different climate events, such as large volcanic eruptions, and processes
models (and downscaled models) gives some indication not included in models, could influence climate over the
of the possible responses. However, the range of model century. See IPCC’s Fifth Assessment Report (IPCC, 2013)
Chapter 11 for further discussion of these issues.c luste r r e po rt: C E NTR A L SLO PES 15
The projections presented are accompanied by a confidence
rating that follows the system used by the IPCC in the Fifth
Assessment Report (Mastrandrea et al., 2010), whereby the
confidence in a projected change is assessed based on the
type, amount, quality and consistency of evidence (which
can be process understanding, theory, model output, or
expert judgment) and the extent of agreement amongst the
different lines of evidence. Hence, this confidence rating
does not equate precisely to probabilistic confidence. The
levels of confidence used here are set as low, medium, high or
very high. Note that although confidence may be high in the
direction of change, in some cases confidence in magnitude
of change may be medium or low (e.g. due to some known
model deficiency). When confidence is low, only qualitative FIGURE 4.2.2: MAPS OF TREND IN MEAN TEMPERATURE
assessments are given. More information on the method (°C/10YEARS) FOR (A) 1910–2013 AND (B) 1960–2013 (ACORN-SAT).
used to assess confidence in the projections is provided in
Section 6.4 of the Technical Report.
4.2 TEMPERATURE
Since national records began in 1910, surface air
temperatures in the cluster have been increasing, especially
since 1960 (Figure 4.2.1, 4.2.2). By 2013, mean temperature
has risen by 0.8 °C since 1910 using a linear trend. For the
same period, daytime maximum temperatures have risen
by 0.4 °C while overnight minimum temperatures have
increased by 1.2 °C using a linear trend (Figure 4.2.3).
Daily minimum and maximum temperatures have increased
since the mid 20th century, but they have different trends
in the early part of the record (Figure 4.2.3). The higher
anomalies in daily maximum temperature in the early
part of the 20th century are most likely explained by the
drier than average conditions in Central Slopes during this FIGURE 4.2.3: OBSERVED ANNUAL MEAN OF DAILY MAXIMUM
period (Figure 4.3.1). The reason for this is that when the (ORANGE LINE) AND MINIMUM (BLUE LINE) TEMPERATURE
surface is dry, less energy is consumed by evaporation. Thus (°C, 11-YEAR RUNNING MEAN), PRESENTED AS ANOMALIES
proportionally, more energy is felt as heat. This effect will RELATIVE TO THEIR RESPECTIVE 1910-2013 MEAN VALUE
(ACORN-SAT).
be strongest during the day.
FIGURE 4.2.1: OBSERVED ANNUAL MEAN TEMPERATURE
ANOMALIES (°C) FOR 1910–2013 COMPARED TO THE BASELINE
1986–2005 FOR CENTRAL SLOPES. CLUSTER AVERAGE DATA ARE
FROM ACORN-SAT AND GLOBAL DATA ARE FROM HADCRUT3V
(BROHAN ET AL., 2006).16 C L I M AT E C H A N G E I N A U S T R A L I A
BOX 4.2: UNDERSTANDING PROJECTION PLOTS
Projections based on climate model results are illustrated percentile) of individual years taking into account
using time series (a) and bar plots (b). The model data year to year variability in addition to the long-term
are expressed as anomalies from a reference climate. response (20-year moving average).
For the time series (a), anomalies are calculated as
In the time series (a), where available, an observed time
relative to 1950–2005, and for the bar plots (b) anomalies
series (4) is overlaid to enable comparison between
are calculated as the change between 1986–2005 and
observed variability and simulated model spread. A time
2080–2099 (referred to elsewhere as ‘2090’). The graphs
series of the future climate from one model is shown
can be summarised as follows:
to illustrate what a possible future may look like (5).
1. The middle (bold) line in both (a) and (b) is the median ACCESS1-0 was used for RCP4.5 and 8.5, and BCC-CSM-1
value of the model simulations (20-year moving was used for RCP2.6, as ACCESS1-0 was not available.
average); half the model results fall above and half
In both (a) and (b), different RCPs are shown in different
below this line.
colours (6). Throughout this document, green is used for
2. The bars in (b) and dark shaded areas in (a) show the RCP2.6, blue for RCP4.5 and purple for RCP8.5, with grey
range (10th to 90th percentile) of model simulations bars used in bar plots (b) to illustrate the expected range of
of 20-year average climate. change due to natural internal climate variability alone (7).
3. Line segments in (b) and light shaded areas in
(a) represent the projected range (10th to 90thc luste r r e po rt: C E NTR A L SLO PES 17
Temperatures in the Central Slopes cluster are projected
to continue to warm throughout the 21st century,
at a rate that strongly follows the increase in global
greenhouse gas concentrations (Figure 4.2.4). Tabulated
warming for various time slices and RCPs are given in
Table 1 in the Appendix.
For 2030, the warming is 0.6 to 1.5 °C (10th to 90th
percentile) relative to 1995, with only minor differences
between the scenarios. The projected temperature
range 2090 shows larger differences with 1.4 to 2.7 °C for
RCP4.5, and 3 to 5.4 °C following RCP8.5. Other details
that can be deduced from these graphs are:
• Projected warmings are large compared to natural year
to year variability in the cluster. For example, cold years
become warmer than warm years in the current climate
around 2050 under RCP8.5 and warmer than most
current warm years under RCP4.5. This is illustrated in
Figure 4.2.4 by overlaying the simulated year to year
variability in one simulation and comparing this to the
historical variability.
• Individual model runs produce temporal variability
similar to that of observed temperature, as well as
a warming trend (compare example model run with
observed time series).
• The model range widens with time (most notable
for the 20-year averages, dark shading). This is not
due to increase in interannual variability in models.
The models warm at different rates, hence the total
range widens. As an example, the overlaid model in
RCP8.5, simulates warming larger than the ensemble
median. Other models simulate warming less than the
ensemble median.
Overall the warming rate of the Central Slopes cluster
is very much in line with the majority of Australia; with
somewhat higher rates being projected for western Australia
and somewhat lower overall rates for the south-east and
FIGURE 4.2.4: TIME SERIES FOR CENTRAL SLOPES ANNUAL Tasmania (see Figure 7.1.4 in the Technical Report).
AVERAGE SURFACE AIR TEMPERATURE (°C) FOR 1910–2090,
Changes to the spatial pattern of temperature in the
AS SIMULATED IN CMIP5 RELATIVE TO THE 1950–2005 MEAN.
THE CENTRAL LINE IS THE MEDIAN VALUE, AND THE SHADING cluster can be illustrated by applying the projected change
IS THE 10TH AND 90TH PERCENTILE RANGE OF 20-YEAR in annual mean temperature onto the mapped observed
MEANS (INNER) AND SINGLE YEAR VALUES (OUTER). THE climatology. Figure 4.2.5 gives an example of this for the
GREY SHADING INDICATES THE PERIOD OF THE HISTORICAL 2090 period following the high emission scenario RCP8.5
SIMULATION, WHILE THREE FUTURE SCENARIOS ARE SHOWN and the median warming from the CMIP5 models. This case,
WITH COLOUR-CODED SHADING: RCP8.5 (PURPLE), RCP4.5
which corresponds to a global warming of 3.7 °C, shows
(BLUE) AND RCP2.6 (GREEN). ACORN-SAT OBSERVATIONS
AND PROJECTED VALUES FROM A T YPICAL MODEL ARE ALSO regional temperatures increasing from within the range of
SHOWN. TIME SERIES PLOTS ARE EXPLAINED IN BOX 4.2. about 12 to 22 °C for the current climate up to a range of
about 16 to 26 °C for the future climate.
Projected warming is similar across the four seasons in the
Central Slopes, and is also broadly similar if daily maximum
or minimum temperatures are considered rather than
daily mean temperatures (Figure 4.2.6 and Appendix Table
1). However, some models simulate somewhat stronger
warming in the daily maximum temperature compared to
daily mean temperature in spring, which is likely due to the
projected decrease in rainfall in this season.18 C L I M AT E C H A N G E I N A U S T R A L I A
FIGURE 4.2.5: ANNUAL MEAN SURFACE AIR TEMPERATURE (°C),
FOR THE PRESENT CLIMATE (A), AND FOR MEDIAN WARMING
IN 2090 UNDER RCP8.5 (B). THE PRESENT IS USING AWAP FOR
1986–2005, ON A 0.25 DEGREE GRID. FOR CLARIT Y, THE 16
AND 22 °C CONTOURS ARE SHOWN WITH SOLID BLACK LINES.
IN (B) THE SAME CONTOURS FROM THE ORIGINAL CLIMATE
ARE PLOT TED AS DOT TED LINES.
FIGURE 4.2.6: PROJECTED SEASONAL SURFACE AIR TEMPERATURE CHANGES FOR 2090. GRAPHS SHOW CHANGES TO THE (A) MEAN,
(B) DAILY MAXIMUM AND (C) DAILY MINIMUM TEMPERATURE. TEMPERATURE ANOMALIES ARE GIVEN IN °C WITH RESPECT TO
1986– 2005 UNDER RCP2.6 (GREEN), RCP4.5 (BLUE) AND RCP8.5 (PURPLE). NATURAL CLIMATE VARIABILIT Y IS REPRESENTED BY THE
GREY BAR. BAR PLOTS ARE EXPLAINED IN BOX 4.2.
For the Central Slopes cluster, projections based on Taking into consideration the strong agreement on the
downscaled data generally do not lead to projected direction and magnitude of change among GCMs and
warming ranges that differ much from those simulated downscaling results, and the robust understanding of the
by the CMIP5 GCM ensemble. An exception is the reduced driving mechanisms of warming and its seasonal variation,
warming in spring and summer when using the statistical there is very high confidence in substantial warming for
downscaling method (SDM). The close resemblance the Central Slopes cluster for the annual and seasonal
between the ranges of downscaled and GCM output are projections for daily mean, maximum and minimum surface
illustrated in Figure 4.2.7. air temperature.c luste r r e po rt: C E NTR A L SLO PES 19
FIGURE 4.2.7: PROJECTED CHANGE IN CENTRAL SLOPES SEASONAL SURFACE AIR TEMPERATURE FOR 2090 USING CMIP5 GCMS AND
TWO DOWNSCALING METHODS (CCAM AND SDM). UNDER RCP8.5 FOR THE (A) MEAN, (B) DAILY MAXIMUM AND (C) DAILY MINIMUM.
TEMPERATURE ANOMALIES ARE GIVEN IN °C WITH RESPECT TO THE 1986– 2005 MEAN. BAR PLOTS ARE EXPLAINED IN BOX 4.2.
4.2.1 EXTREMES (2090) for Dubbo nearly doubles under the RCP4.5 and
median model warming, and the corresponding number of
Changes to temperature extremes often lead to greater
days over 40 °C triples. Under RCP8.5, days over 35 °C triple
impacts than changes to the mean climate. To assess these,
and days over 40 °C show a sixfold increase. Changes for St
researchers examine GCM projected changes to measures
George are somewhat lower, particularly under RCP8.5.
such as the warmest day in the year, warm spell duration
and frost risk days (see definitions below).
Heat related extremes are projected to increase at the same
rate as projected mean temperature with a substantial
increase in the number of warm spell days. Figure 4.2.8
(2090 case only) gives the CMIP5 model simulated warming
on the hottest day of the year averaged across the cluster,
and the corresponding warming for the hottest day in
20 years (20-year return value, equal to a 5 % chance of
occurrence within any one year). The rate of warming for
these hot days is similar to that for all days (i.e. the mean
warming in the previous section). The GCM projections also
indicate a marked increase in a warm spell index, which is
defined as the annual count of days for events with at least
six consecutive days where the daily temperature maximum
averaged for the cluster is above the 90th percentile. As
an example, the 90th percentile for daily temperature
maximum in Dubbo is 34 °C based on historical records for
January 1921 to June 2014. FIGURE 4.2.8: PROJECTED CHANGES IN SURFACE AIR
TEMPERATURE EXTREMES BY 2090 IN (A) MEAN DAILY
Given the similarity in projected warming for the daily mean MAXIMUM TEMPERATURE, HOT TEST DAY OF THE YEAR AND
and the daily maximum temperature, an indication of the THE 20-YEAR RETURN VALUE OF THE HOT TEST DAY OF THE
change in frequency of hot days locally can be obtained by YEAR (°C); AND (B) CHANGE IN THE NUMBER OF DAYS IN WARM
applying the projected changes for maxima for selected SPELLS FOR CENTRAL SLOPES (SEE TEXT FOR DEFINITION OF
VARIABLES). RESULTS ARE SHOWN FOR EMISSION SCENARIOS
time slices and RCPs to the historical daily record at selected RCP4.5 (BLUE) AND RCP8.5 (PURPLE) RELATIVE TO THE 1986–2005
sites. This is illustrated in Box 4.3 for Dubbo and St George, MEAN. NATURAL CLIMATE VARIABILIT Y IS REPRESENTED BY
where the number of days above 35 °C by late in the century THE GREY BAR. BAR PLOTS ARE EXPLAINED IN BOX 4.2.You can also read