CHARTING AN AMBITIOUS U.S. NDC OF 51% REDUCTIONS BY 2030 - Center for Global ...
←
→
Page content transcription
If your browser does not render page correctly, please read the page content below
Working Paper
CHARTING AN AMBITIOUS U.S. NDC OF 51%
REDUCTIONS BY 2030
Authors: Nathan Hultman,1 Leon Clarke,1 Haewon McJeon,1 Ryna Cui,1 Pete Hansel,2 Emily McGlynn,3 Kowan O’Keefe,1
John O’Neill, Celeste Wanner,2 Alicia Zhao 1

Key Messages
   New analysis shows that a comprehensive federal effort across all sectors and gases could deliver U.S. GHG
   emissions reductions of 51% below 2005 levels by 2030. This would put the U.S. on a trajectory to net-zero
   emissions in 2050, consistent with limiting global warming to 1.5ºC.
   The electricity and transportation sectors are the biggest contributors to overall reductions by 2030—
   representing three-quarters of all reductions—but actions must be taken across all sectors to meet this
   target and to set the stage for subsequent reductions.
   Achieving these emissions reductions would require a broad federal approach that includes
   Congressional and Executive branch actions across all sectors and gases. While there are multiple policy
   pathways to achieve significant reductions, this scenario focuses specifically on substantial new
   investment via economic recovery packages and strong federal performance standards.
   This new analysis was conducted by the Center for Global Sustainability at the University of Maryland. The
   analysis was carried out using a version of the GCAM-USA modeling platform.
   These results do not incorporate potential additional actions by cities, states, and businesses. Such actions
   could increase overall ambition or serve as a backstop should this suite of federal actions not fully
   materialize. Additional opportunities for and impacts of such actions will be detailed in future analysis.

2021 is a critical year for climate ambition and action globally and in the United States. After four years without federal
engagement, the Biden-Harris Administration has made climate a centerpiece of its policy agenda. President Biden
campaigned on a commitment to achieve economy-wide decarbonization by 2050 and 100% clean electricity by 2035.
Having recently formally re-joined the Paris Agreement, the administration has announced its intent to deliver a new
national climate target to the international community, known as a nationally-determined contribution, or NDC, by April
22.

This new U.S. NDC will be critically important. The U.S. remains the world’s second-largest greenhouse gas emitter and
must lead the way in decarbonizing in order to achieve the goals of the Paris Agreement. The NDC will set the bar for
domestic action, influencing federal and subnational policymaking. The NDC also has the potential to spur significant
additional global action by sending a clear signal about the U.S. commitment to climate action and increasing pressure
on other countries to put forward equally ambitious NDCs. A successful NDC will need to balance ambition with what is
possible in the next nine years. Too ambitious an agenda risks eroding credibility; too little ambition risks undermining
global efforts to marshal a strong global response to climate.

There is alignment between the Biden Administration and Congressional leadership that the U.S. must implement
ambitious policies to confront climate change. While there are several different legislative and executive approaches
that could achieve deep reductions by 2030, this analysis focuses on a mix of sector-specific measures that includes
decade-long investments in clean technologies and ambitious new regulatory measures using existing authorities.
Economy-wide climate legislation such as a limit or price on carbon and/or more ambitious state-level action could
further accelerate progress and ensure that climate goals are met.

                                                                                                              March 2021 | 1
The analysis, conducted by the Center for Global Sustainability at the University of Maryland, constructs a set of policy
options across all major emitting sectors and tests their implications using a version of GCAM-USA, a leading open-
source modeling platform. Our analysis layers in a comprehensive package of sectoral policies in all 50 states and the
District of Columbia, represented in GCAM-USA, to estimate high-ambition emission reduction potential for 2030. This
working paper presents an overview of our approach and results; further details on the assumptions, modeling tools,
and methodology are presented in the Technical Appendix, available at go.umd.edu/ChartingNDC-TechnicalAppendix.

We estimate that the combination of new clean energy investment policies and federal standards
described here would reduce U.S. net greenhouse gas emissions by 51% by 2030, relative to 2005 levels.

Reaching this level of 51% reductions will require a multi-sector approach to mitigation. Only through a combination of
actions across all sectors of the economy will it be possible to achieve highly ambitious reductions approaching 50% or
more. At the same time, electricity generation and transportation stand out as particularly important in this time period
of 2020-2030:
    Electricity sector reductions alone account for over half of the net economy-wide reductions relative to 2005 (28% of
    51% overall reductions). U.S. climate ambition by 2030 hinges fundamentally on the ability to rapidly shift to zero-
    emissions electricity generation. This includes largely eliminating coal-fired electricity generation without carbon
    dioxide capture and storage (CCS) by 2030 and making major progress in reducing gas-fired electricity.
    The transportation sector is now the largest emitting sector in the U.S. In this analysis, transportation reductions
    account for about one-fifth of the total reductions to 2030 (11% of 51% overall reductions) but are also important to
    pave the way for deeper reductions beyond 2030. A combination of enhanced GHG performance standards on
    light- and heavy-duty vehicles, tax credits for electric vehicle (EV) purchases, and cash-for-clunker incentives could
    ensure the transition to electric vehicles and deliver major reductions in transportation emissions by 2030.

Other energy-sector actions to electrify buildings and scale electrification and CCS in industry will lead to reductions by
2030 and will be important to set the stage for deeper reductions beyond 2030. Important reductions can also be
obtained from prioritizing non-CO2 gases, such as strong standards on oil and gas methane, actions to reduce nitrous
oxide from agricultural production, and progress to phase out production and consumption of hydrofluorocarbons
(HFC)s. Finally, substantial new investment in protecting and building the U.S. land-sector sink is critical. In this analysis,
this investment not only avoids projected decline in the land-sector but also grows the sink to absorb 1 gigaton of
carbon dioxide by 2030.

The results presented here are based on assumptions about key driving forces such as technological change, oil and
gas prices, economic growth and the recovery from COVID-19, and the physical character of the U.S. land-use sink.
None of these can be predicted with certainty a decade out. The results are also derived from only a single modeling
platform. The precise results here should therefore be interpreted as indicative rather than predictive. Faster
technological advances would potentially deepen reductions; slower technological advances would lower reductions.
More robust economic growth than assumed here would put upward pressure on energy demands and emissions.
Increasing evidence that the land use sink is degrading would lead to less ambitious reductions. Alternate assumptions
applied in a different modeling platform could lead to a different final result, although we view it as unlikely that the
result would diverge significantly from the results presented here.

                                                                                                                 March 2021 | 2
The results presented here are consistent with results from other studies. America’s Pledge analyses found 49%
reductions based on an all-in approach that combined ambitious federal action with increased efforts by cities, states,
4, 5
and businesses. A study from Climate Analytics and the Asia Policy Institute estimated that the implementation of
President Biden’s Clean Energy Plan, combined with strong subnational action, would lead to reductions between 38%
to 54%. A study by Columbia University and Rhodium Group estimated a 45% reduction in CO2 emissions through a
6
national carbon tax and other energy system changes.7 A study by Resources for the Future found that a carbon tax
8
could reduce energy system emissions 50% by 2030. Three additional analyses included in the Stanford Energy
Modeling Forum 32 found carbon pricing similar to the RFF study could achieve carbon emissions reductions between
50% and 60% by 2030.9
This study assumes only federal measures to reduce emissions. In reality, the federal government is not the only driver
of U.S. climate ambition. Cities, states, businesses, and other subnational actors have carried the mantle of climate
10, 11
leadership over the last four years. Subnational actions can both backstop and bolster federal efforts. In addition to
subnational engagement, recent technological trends that were largely unanticipated a decade ago are driving changes
in the U.S. energy sector. For the past few years, wind and solar have comprised the majority of new electric capacity
installations, competing with natural gas to drive out coal generation. And automakers increasingly see electric vehicles
as the way of the future. Both rapidly evolving technological progress and steady progress from subnational actors
create additional momentum for climate action.
This study has demonstrated how a strong program of climate actions can put the U.S. on track to 50% reductions by
2030 and net-zero emissions by mid-century. Such a program would demonstrate a renewed U.S. commitment to the
rest of the world and accelerate the ongoing process of ratcheting up ambition globally. The policy platform presented
here represents one of many potential policy combinations that might put the U.S. on a path toward reductions in this
range. Regardless, all approaches depend fundamentally on the ability to implement ambitious actions and a durable
commitment to maintain and enhance them over the coming decade.
The Technical Appendix is available at go.umd.edu/ChartingNDC-TechnicalAppendix.
Recommended Citation. Hultman, N., L. Clarke, H. McJeon, R. Cui, P. Hansel, E. McGlynn, K. O’Keefe, J. O’Neill, C.
Wanner, A. Zhao (2021). Charting an Ambitious US NDC of 51% Reductions by 2030. Center for Global Sustainability
Working Paper. College Park, MD: University of Maryland Center for Global Sustainability. 5 pp. Available at:
go.umd.edu/ChartingNDC2030
March 2021 | 3Table 1. Policy Assumptions
Sector Modeled Policy Approach
Renewable Energy Investment tax credit extends through 2030 at 30% of development costs.
Incentives Production tax credit extends through 2030 at 2.5 cents/KWh.
Standards on existing Federal regulations impose an equivalent of a carbon price starting at
coal $5/ton in 2023, rising to $25/ton by 2035.
Standards on existing Federal regulations impose an equivalent of a carbon price starting at
Power gas $10/ton in 2030, rising to $25/ton by 2035.
Standards on new All new gas plants are built with 90% CCS starting in 2025.
gas
Incentives for Carbon 45Q tax credit for CCS projects is increased to $100/ton through 2030,
Capture and achieving 154 MTCO2 sequestration.
Sequestration
Nuclear Retention Incentives retain existing nuclear generation at 680 TWh in 2030.
Incentives
Combustion Engine ICE GHG performance reaches 118gCO2 /mi for new passenger cars and
Performance 160g/mi for new light trucks and SUVs by 2030.
LDV ZEV incentives For MY2021 through MY2025, EV credit is fixed at $7,000/new sales. Post-
Transport 2025, EV sales increase such that by 2030 new EV sales reach 40%, and by
2035 new sales reach 90%. Additional cash for clunkers incentive is set at
$5000/vehicle older than 15 years of age.
M/HDV ZEV 2030 ZEV sales reach 15% for Class 2b-3 trucks, 20% for Class 4-8 straight
incentives trucks, and 15% for Class 7-8 tractors.
Electrification Combination of appliance incentives and standards leads to 58% of
appliances stock being electrified. New sales of electrified appliances are
consistent with the National Renewable Energy Laboratory’s Electrification
Buildings Futures Study “High Electrification” scenario.
Energy efficiency High efficiency appliance standards and investments achieve reduced
energy demand consistent with the Appliance Standards Awareness
Project’s A Powerful Priority report.
Energy efficiency Efficiency increase to reduce overall energy demand by 1.7 EJ by 2030.
Industry
Carbon Capture and 45Q tax credit for CCS projects is increased to $100/ton through 2030,
Sequestration achieving 79 MTCO2 sequestration.
Methane (CH4 ) Standards on oil and gas methane to address fugitive methane emissions.
Incentives and standards for agricultural CH4 emissions abatement
consistent with economic potential from the EPA MAC report.
Non-CO2
emissions Nitrous Oxide (N2O) Incentives for N2O emissions abatement achieve 9.7% below 2015 levels by
2030, achieving economic abatement potential from the EPA MAC report.
Hydroflourocarbons Incentives and standards on HFC emissions leads to reduction of 77%
(HFCs) below 2015 levels, achieving economic abatement potential from the EPA
MAC report.
LULUCF Substantial new investment to pay for reforestation and improved land
LULUCF management practices grow the land sector sink to achieve -1000
TCO e/year in LULUCF emissions (applying up to $35-40/ton price as proxy).
2
Notes: ICE: Internal Combustion Engine vehicles. LDV: Light Duty Vehicle. M/HDV: Medium and Heavy Duty Vehicle. ZEV: Zero
Emission Vehicle. LULUCF: Land Use, Land-Use Change and Forestry. EPA MAC report: Global Non-CO2Greenhouse Gas Emission
Projections & Mitigation 2015-2050. (United States Environmental Protection Agency, Washington, DC 20005, 2019).
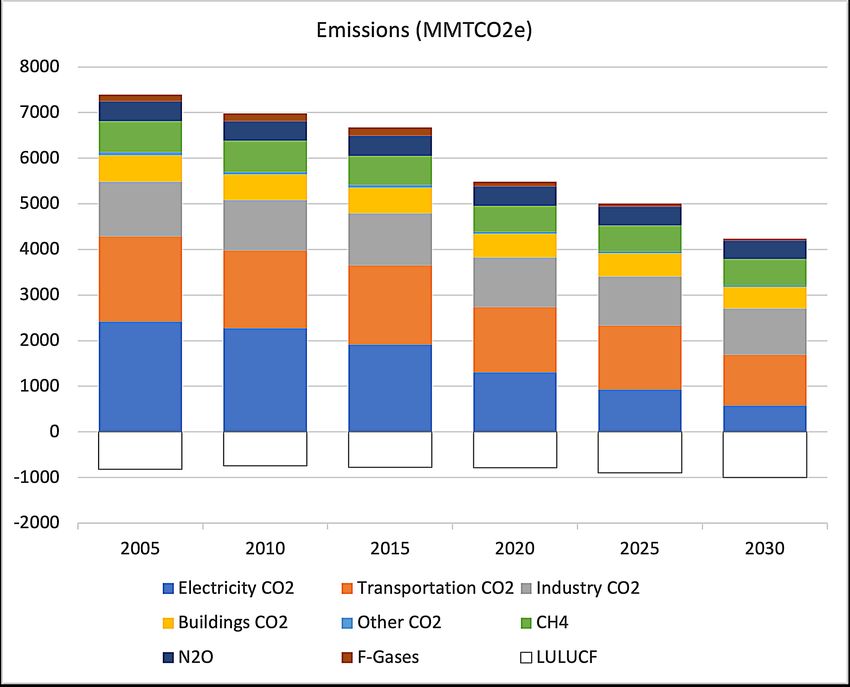
March 2021 | 4Figure 1. Projected U.S. greenhouse gas emissions by sector and source to 2030
March 2021 | 5Table 2. Projected U.S. Greenhouse gas emissions by sector and source, 2005-2030 (MMTCO 2 e)
Sector/GHG Emissions Emissions Emissions Reduction Reduction Contribution
2005 2019 2030 from 2005 to relative to to economy-
(MMTCO2 e) (MMTCO2 e) (MMTCO2 e) 2030 2005 (%) wide 51%
(MMTCO2 e) reduction
relative to
2005 (%)
Electricity
CO2 2416 1630 577 -1839 -76% 28%
Transport
1866 1852 1115 -751 -40% 11%
CO2
Industry CO2 1199 1140 1010 -189 -16% 3%
Buildings
585 577 478 -107 -18% 2%
CO2
Other CO2 65 72 34 -31 -48% 0%
CH4 680 660 572 -108 -16% 2%
N20 432 458 404 -28 -7% 0%
F-Gases 148 185 42 -106 -72% 2%
LULUCF -815 -789 -1000 -185 23%* 3%
Net GHG
Total 6577 5787 3232 -3344 -51% -51%
Notes: LULUCF: Land Use, Land-Use Change, and Forestry. LULUCF changes from the 2005 level are positive because 2005
emissions and 2030 emissions are both negative. This change represents further reductions in net emissions.
March 2021 | 6References
1 Center for Global Sustainability, University of Maryland
2 Independent
3 Department of Agriculture and Resource Economics, University of California, Davis
4 Hultman, N., C. Frisch, L. Clarke, K. Kennedy, P. Bodnar, P. Hansel, T. Cyrs, M. Manion, M. Edwards, J. Lund, C. Bowman,
J. Jaeger, R. Cui, A. Clapper, A. Sen, D. Saha, M. Westphal, W. Jaglom, J.C. Altamirano, H. Hashimoto, M. Dennis, K.
Hammoud, C. Henderson, G. Zwicker, M, Ryan, J. O’Neill, E. Goldfield (2019). Accelerating America’s Pledge: Going All-In
to Build a Prosperous, Low-Carbon Economy for the United States. New York: The America’s Pledge Initiative on Climate
Change and Bloomberg Philanthropies, with the University of Maryland Center for Global Sustainability, Rocky Mountain
Institute, and World Resources Institute. 156 pp. consisting of 94 pp. Report, 62 pp. Technical Appendix. Available at:
www.americaspledge.com/reports
5 Hultman, N., L. Clarke, C. Frisch, K. Kennedy, H. McJeon, T. Cyrs, P. Hansel, P. Bodnar, M. Manion, M.R. Edwards, R. Cui,
C. Bowman, J. Lund, M. Westphal, A. Clapper, J. Jaeger, A. Sen, J. Lou, D. Saha, W. Jaglom, K. Calhoun, K. Igusky, J.
deWeese, K. Hammoud, J.C. Altimirano, M. Dennis, C. Henderson, G. Zwicker, J. O’Neill (2020). “Fusing national and sub-
national climate action is central to rapid near-term decarbonization: The case of the United States.” Nature
Communications 11, 5255. https://doi.org/10.1038/s41467-020-18903-w
6 Deng, Y., Ursula Fuentes, Bill Hare, Lara Welder, & Matthew Gidden. (2020). U.S. and China Climate Goals: Scenarios
for 2030 and Mid-Century (U.S. and China Climate Goals: Scenarios for 2030 and Mid-Century). Asia Society Policy
Institute & Climate Analytics. 47 pp. Available at https://climateanalytics.org/media/aspi-ca-us_chinaclimategoals-
2020.pdf.
7 Note, this analysis was conducted pre-COVID and therefore does not take into consideration impact of the pandemic
on current and future GHG emissions. Larsen, J., Noah Kaufman, Peter Marsters, Whitney Herndon, Hannah Kolus, &
Ben King. (2020). Expanding the Reach of a Carbon Tax: Emissions Impacts of Pricing Combined with Additional Climate
Actions. Center on Global Energy Policy at Columbia University and Rhodium Group. 46 pp. Available at
https://www.energypolicy.columbia.edu/sites/default/files/file-uploads/CarbonComplement_CGEP-Report_101920.pdf
8 RFF’s carbon pricing toll can be found at: https://www.rff.org/publications/data-tools/carbon-pricing-calculator/.
9 James R. McFarland et al., “Overview of the EMF 32 Study on U.S. Carbon Tax Scenarios,” Climate Change Economics
09, no. 01 (February 2018): 1840002, https://doi.org/10.1142/S201000781840002X.
10 N. Hultman (2020). “Building an ambitious and robust U.S. climate target: A comprehensive process to catalyze
national and subnational climate action for the next NDC.” Brookings & Center for Global Sustainability. Brookings
Global Economy & Development Working Paper 146, 30 pp. Available at: https://www.brookings.edu/research/building-
an-ambitious-and-robust-us-climate-target/
11 N. Hultman, K. Kennedy, T. Cyrs, W. Jaglom, C. Frisch, L. Clarke, A. Light (2021). An All-In National Climate Strategy to
Deliver Ambitious, Robust, and Credible U.S. Action. America Is All In working paper, 4 pp.
https://www.americaisallin.com/wp-content/uploads/2021/02/all-in-national-climate-strategy.pdf
March 2021 | 7You can also read