Children's Consumption Patterns and Their Parent's Perception of a Healthy Diet - MDPI
←
→
Page content transcription
If your browser does not render page correctly, please read the page content below
nutrients
Article
Children’s Consumption Patterns and Their Parent’s
Perception of a Healthy Diet
Jessica Eliason, Francesco Acciai * , Robin S. DeWeese, Sonia Vega-López            and
Punam Ohri-Vachaspati
 College of Health Solutions, Arizona State University, Phoenix, AZ 85004, USA; jjeliaso@asu.edu (J.E.);
 rsdewees@asu.edu (R.S.D.); Sonia.Vega.Lopez@asu.edu (S.V.-L.); Punam.Ohri-Vachaspati@asu.edu (P.O.-V.)
 * Correspondence: facciai@asu.edu

 Received: 1 July 2020; Accepted: 29 July 2020; Published: 3 August 2020

 Abstract: This study aims to examine children’s fruit, vegetable, and added sugar consumption relative
 to the Dietary Guidelines for Americans and the American Heart Association’s recommendations,
 as well as to compare children’s reported consumption with parental perception of the child’s overall
 diet quality. Data were drawn from 2 independent, cross sectional panels (2009–10 and 2014–15)
 of the New Jersey Child Health Study. The analytical sample included 2229 households located
 in five New Jersey cities. Daily consumption of fruit (cups), vegetables (cups), and added sugars
 (teaspoons) for all children (3–18 years old) were based on parent reports. Multivariate linear
 regression analyses estimated children’s adjusted fruit, vegetable, and added sugar consumption
 across parents’ perception categories (Disagree; Somewhat Agree; and Strongly Agree that their child
 eats healthy). Although only a small proportion of children meet recommendations, the majority
 of parents strongly agreed that their child ate healthy. Nonetheless, significant differences, in the
 expected direction, were observed in vegetable and fruit consumption (but not sugar) across parental
 perceptional categories for most age/sex groups. Dietary interventions tailored to parents should
 include specific quantity and serving-size information for fruit and vegetable recommendations,
 based on their child’s age/sex, and highlight sources of added sugar and their sugar content.

 Keywords: fruit consumption; vegetable consumption; added sugar intake; children and adolescents;
 dietary guidelines; parental perception of the healthfulness of their child’s diet

1. Introduction
      Every five years the United States Department of Agriculture (USDA) and the United States
Department of Health and Human Services (DHHS) update the Dietary Guidelines for Americans
(DGA) based on current scientific evidence [1]. The USDA’s MyPlate is a platform for communicating
information and recommendations in the DGA to the public to promote healthy eating [2]. Over the
years these guidelines have consistently advocated for nutrient-dense diets that promote consumption
of fruits and vegetables and limit foods and beverages with added sugars. Recommendations for
fruits and vegetables vary based on children’s age and sex. For example, based on the 2015 guidelines,
children ages 2–8 should consume 1–1.5 cups of fruit and 1–1.5 cups of vegetables, while children 9 and
older should consume 1.5–2 cups of fruit and 2–3 cups of vegetables. The guidelines also recommend
that all children, regardless of age and sex, limit their consumption of added sugars to less than 10% of
daily calories. The American Heart Association (AHA) recommends that all children between 2 and
18 years of age limit their added sugar intake to less than 25 g (or 6 teaspoons) per day, regardless of
the calories consumed [3].
      Despite these recommendations, the vast majority of children continue to consume energy-dense,
nutrient-poor diets. Vegetable consumption among children is particularly dismal, with only about

Nutrients 2020, 12, 2322; doi:10.3390/nu12082322                              www.mdpi.com/journal/nutrients
Nutrients 2020, 12, 2322 2 of 12
2–16 percent of children across all age groups meeting recommendations [4]. While young children
(ages 2–5 years) usually consume adequate amounts of fruit [5], more than 75% of older children and
adolescents fall short of the recommendations [4]. Although added sugar consumption has decreased
for children across all age groups in recent years, the average intake still exceeds 10% of daily calories
per day [4]. Sugar-sweetened beverages, including fruit drinks (e.g., juice) and soft drinks (e.g., soda)
are the main sources of added sugars among children ages 2–18 [6]. Unsurprisingly, 12–18 year-olds
have a higher intake of sugar-sweetened beverages than younger children [7,8]).
Increasing children’s fruit and vegetable intake and limiting added sugar consumption
requires interventions in home and school settings [9]. Parents’ dietary consumption [10], modeling
behaviors [11], and feeding styles [12] can influence children’s diets. Arguably, improving children’s
consumption is also closely linked to how parents perceive the healthfulness of their child’s diet
because a parent must first recognize when their child’s diet is poor or needs change in order to take
actions [13,14]).
Briefel et al. (2015) used parent 24-h recalls to assess young (Nutrients 2020, 12, 2322 3 of 12
2.2. Analytical Variables
The analytical sample (n = 2229) included households from panel 1 and panel 2 surveys with
complete data. Similar to other studies [14–16], parents were asked to evaluate the diet quality of
their children. Parents were asked to respond to the following statement: “In general, (Index Child)
eats healthy” using the following response options: “Strongly agree,” “Somewhat agree,” “Somewhat
disagree,” “Strongly disagree,” or “Don’t know and refused.” This analysis combined “Somewhat”
and “Strongly” disagree into one category due to the small percentage (4%) of parents who strongly
disagreed that their child ate a healthy diet. Children whose parents responded “don’t know” or
refused to answer were excluded from this analysis (Nutrients 2020, 12, 2322 4 of 12
for specific age/sex groups were obtained from MyPlate guidelines. Because children’s daily caloric
intake, required for estimating MyPlate-based added sugars recommendations, was not measured in
our household surveys, we chose to use the American Heart Association’s (AHA) recommendation
for children, which suggests consuming ≤25 g (or ≤6 teaspoons) of added sugar [3], regardless of age
or sex.
All analyses were run in Stata [25]. Multivariate linear regression analyses were performed to
estimate children’s fruit, vegetable and added sugar consumption by parents’ perception categories
(Disagree; Somewhat Agree; and Strongly Agree that child eats healthy), while adjusting for
socio-demographic covariates. All models included survey weights and adjusted for clustering
of the data at the city level. Separate models were run for the three food categories. Using the
post-estimation margins command, we obtained the average quantities consumed by children in
each MyPlate age/sex group, for the three parent perception categories, after controlling for child’s
race/ethnicity, mother’s education, household’s poverty level, and household’s participation in WIC
and SNAP.
3. Results
Parent, child, and household characteristics are summarized in Table 1. Most children were
non-Hispanic black (47%) or Hispanic (40%), while white/other made up the remaining 13% of the
sample. The majority (68%) of children were from households with incomes below 200% of the Federal
Poverty Level (FPL), and 58% had a mother with a high school degree or less. Overall, 54% of parents in
our sample strongly agreed their child was eating a healthy diet, compared to 32% somewhat agreeing,
and about 14% disagreeing. The majority (59–65%) of parents of younger children (2–3 and 4–8 years
old) strongly agreed that their child ate healthy, compared to only 44–50% of parents of older children
(9–13 and 14–18 years old) who strongly agreed their child ate healthy (data not shown).
Table 1. Demographic characteristics of children in the analytical sample from the New Jersey Child
Health Study.
Demographic Variables n = 2229 %
Sex
Female 1086 48.7
Age
2–3 years 78 3.5
4–8 years 762 34.2
9–13 years 776 34.8
14–18 years 613 27.5
Race/Ethnicity
Non-Hispanic White/Other 286 12.8
Non-Hispanic Black 1043 46.8
Hispanic 900 40.4
Mother’s education
Less than High School 421 18.9
High School or Equivalent 876 39.3
Some College 564 25.3
College Degree or More 368 16.5
Poverty levelNutrients 2020, 12, 2322 5 of 12
Table 1. Cont.
Demographic Variables n = 2229 %
Parental perception of child’s diet quality as healthy
Disagree 311 14.0
Somewhat Agree 711 31.9
Strongly Agree 1207 54.1
Food categories consumed Mean Std. Deviation
Fruit (cups) 1.7 1.0
Vegetable (cups) 1.1 0.4
Added Sugars (teaspoons) 15.4 6.2
1 FPL: Federal Poverty Level. 2 WIC: Special Supplemental Nutrition Program for Women, Infants, and Children.
3 SNAP: Supplemental Nutrition Assistance Program.
Percentages of children by age/sex categories meeting MyPlate vegetable and fruit, and AHA
added sugar recommendations are presented in Table 2. For both vegetables and fruit, fewer older
children compared to younger children met the recommendations. For instance, 19% of younger
children (2–3 years old) met vegetable recommendations compared to less than 1% of 14–18-year-old
males and females. Most 2–3-year-old children met fruit recommendations (94%), compared to
only 26–28% of 14–18-year-old males and females. All children in our sample consumed more than
6 teaspoons of added sugars.
Table 2. Percentage of children meeting MyPlate fruit and vegetable recommendations and the
American Heart Association’s (AHA) added sugar limitations.
MyPlate Age/Sex Groups % Meeting Recommendations
Category N Vegetables Fruit Added Sugars
2–3 years (all) 78 19.1 94.7 0.0
4–8 years (all) 762 5.8 50.0 0.0
9–13-year-old females 387 2.2 36.2 0.0
9–13-year-old males 389 9.5 57.2 0.0
14–18-year-old females 287 0.3 28.2 0.0
14–18-year-old males 326 0.5 26.3 0.0
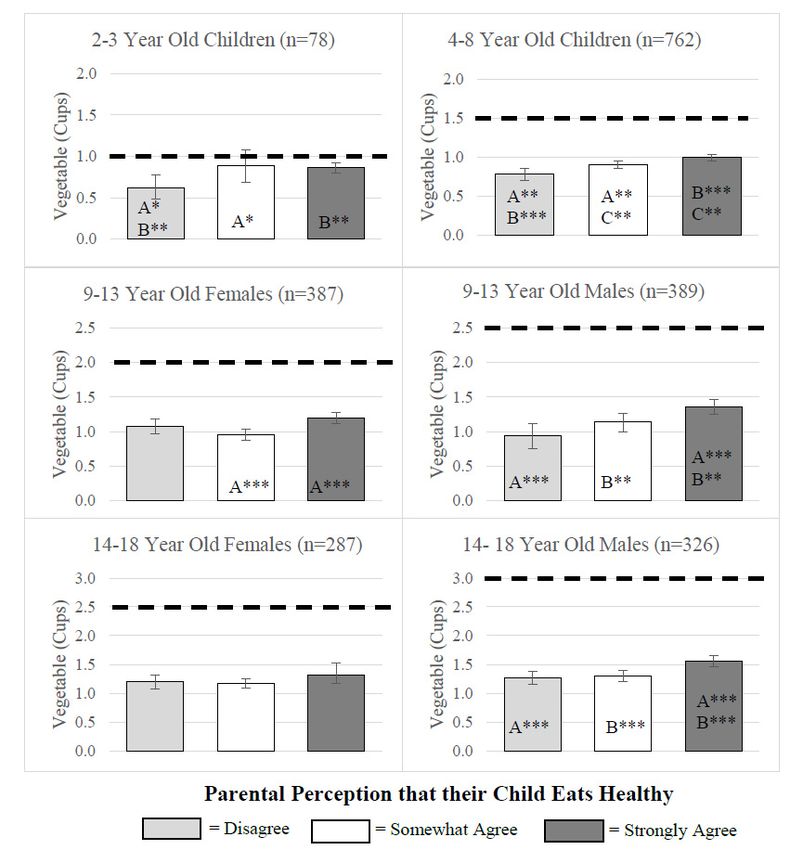
Results from multivariate regression analyses examining mean consumption by MyPlate age/sex
categories across the three levels of parental perception are presented in Figures 1–3. Figures 1 and 2
include the MyPlate recommendation for vegetables and fruit, whereas Figure 3 includes the AHA
recommendation for added sugars. Average vegetable consumption fell short of recommendations for
all age/sex categories (Figure 1). However, in most age/sex categories, significant differences across
parental perception categories were observed in amounts of vegetables consumed. For example,
all 2-3 year-old children, 4–8-year-old children, 9–13-year-old males and females, and 14–18- year-old
males whose parents strongly agreed they ate healthy consumed significantly higher amounts of
vegetables compared to those in the same demographic groups with parents who only somewhat
agreed or disagreed they ate healthy For older female adolescents (14–18 years), there was no difference
in vegetable consumption across parental perception categories.Nutrients 2020, 12, 2322 6 of 12
Nutrients 2020, 12, x FOR PEER REVIEW 6 of 12
1. Children’s
Figure 1.
Figure Children’svegetable
vegetableconsumption
consumption across parental
across perception
parental categories.
perception Notes.
categories. Results
Notes. from
Results
multivariate regression analysis showing adjusted average cups of vegetable consumed
from multivariate regression analysis showing adjusted average cups of vegetable consumed by by parental
perception of children’s
parental perception diet categories.
of children’s Models included
diet categories. parental parental
Models included perception, sex, age, sex,
perception, parental
age,
education, federal poverty level, race/ethnicity, SNAP participation, and WIC participation.
parental education, federal poverty level, race/ethnicity, SNAP participation, and WIC participation. Bars with
the same
Bars withletter (A, B,letter
the same or C)(A,
represent
B, or C)significant differences differences
represent significant in consumption across thoseacross
in consumption perception
those
categories (* p ≤ 0.05; ** p ≤ 0.01; *** p ≤ 0.001). MyPlate recommendations for each age and sex
perception categories (* p ≤ 0.05; ** p ≤ 0.01; *** p ≤ 0.001). MyPlate recommendations for each age andcategory
are represented
sex category areby black dashed
represented lines. dashed lines.
by black
Among allall4–8-year-old
Among children,
4–8-year-old 9–13-year-old
children, males, and
9–13-year-old 14–18-year-old
males, males, fruit consumption
and 14–18-year-old males, fruit
varied
consumption varied by parent perception of their child’s diet (Figure 2). In these three children
by parent perception of their child’s diet (Figure 2). In these three age/sex categories, age/sex
whose parents
categories, strongly
children agreed
whose that strongly
parents their child ate healthy
agreed consumed
that their significantly
child ate more fruit
healthy consumed compared
significantly
to children
more whose parents
fruit compared somewhat
to children whoseagreed
parentsorsomewhat
disagreedagreed
that their child atethat
or disagreed healthy. Notably,
their child ate
no differences in fruit consumption were observed among 9–13 and 14–18-year-old
healthy. Notably, no differences in fruit consumption were observed among 9–13 and 14–18-year-old females across
parent’s perception
females across categories.
parent’s With
perception the exception
categories. With of
theolder adolescents
exception (14–18-year-old
of older males and
adolescents (14–18-year-
females), mean fruit consumption was close to or above the recommended levels.
old males and females), mean fruit consumption was close to or above the recommended levels.Nutrients 2020, 12, 2322 7 of 12
Nutrients 2020, 12, x FOR PEER REVIEW 7 of 12
2. Children’s fruit consumption
Figure 2. consumption across
across parental
parental perception
perception categories.
categories. Notes. Results from
multivariate regression analysis showing adjusted average cups of fruit consumed by parental
perception of of children’s
children’s dietdiet categories.
categories. Models included parental perception, sex, age, parental
parental
education,
education, federal poverty level, race/ethnicity,
race/ethnicity,SNAP
SNAP participation,
participation,and
and WIC
WIC participation.
participation. Bars with
the same letter (A, B, or or C)C) represent
represent significant
significant differences
differences in
in consumption
consumption across
across those
those perception
perception
categories (* pp ≤
categories (* ≤ 0.05; ** pp ≤≤0.01;
0.05; ** ***pp≤≤0.001).
0.01;*** 0.001).MyPlate
MyPlaterecommendations
recommendationsfor foreach
each age
age and
and sex category
are represented
represented by by black
black dashed
dashed lines.
lines.
Lastly,
Lastly,Figure
Figure3 shows
3 showsamounts
amounts(teaspoons)
(teaspoons)of added sugarsugar
of added consumed by children
consumed in various
by children age/sex
in various
categories by parent perception categories. We found few differences in added
age/sex categories by parent perception categories. We found few differences in added sugar sugar consumption
by parent perception
consumption by parentwhen examining
perception specific
when age/sex
examining categories.
specific age/sexOnly 4–8-year-old
categories. Only children and
4–8-year-old
9–13-year-old male children of parents who strongly agreed that their child ate healthy
children and 9–13-year-old male children of parents who strongly agreed that their child ate healthy consumed
significantly less added less
consumed significantly sugar compared
added sugar to the sametoage
compared theand
samesexage
children
and sexofchildren
parents who disagreed
of parents who
with the statement. No differences were observed in the amount of sugar consumed
disagreed with the statement. No differences were observed in the amount of sugar consumed by by parental
perception for any other
parental perception age/sex
for any group.
other However,
age/sex group. all children,
However, allregardless
children, of parental of
regardless perception,
parental
exceeded their recommended intake by consuming more than 6 teaspoons of added
perception, exceeded their recommended intake by consuming more than 6 teaspoons of added sugars.
sugars.Nutrients 2020, 12, 2322 8 of 12
Nutrients 2020, 12, x FOR PEER REVIEW 8 of 12
Figure 3. Children’s added sugar consumption across parental perception perception categories.
categories. Notes. Results
from multivariate
multivariateregression
regressionanalysis showing
analysis adjusted
showing average
adjusted teaspoons
average of addedof
teaspoons sugars consumed
added sugars
by parentalby
consumed perception of children’s
parental perception diet categories.
of children’s Models included
diet categories. parental perception,
Models included sex, age,
parental perception,
parental
sex, age,education, federal poverty
parental education, federallevel, race/ethnicity,
poverty SNAP participation,
level, race/ethnicity, and WIC participation.
SNAP participation, and WIC
Bars with the same letter (A, B, or C) represent significant differences in consumption across those
participation. Bars with the same letter (A, B, or C) represent significant differences in consumption
perception
across thosecategories
perception p ≤ 0.05). American
(* categories (* p ≤ 0.05).Heart Association
American recommendations
Heart Association for each age for
recommendations andeach
sex
category
age arecategory
and sex represented by black dashed
are represented lines.dashed lines.
by black
4. Discussion
4. Discussion
Across a wide age spectrum (3–18 years), this study is the first to compare parental perception of
Across a wide age spectrum (3–18 years), this study is the first to compare parental perception
child’s diet with the child’s consumption of fruits, vegetables, and added sugars, relative to MyPlate
of child’s diet with the child’s consumption of fruits, vegetables, and added sugars, relative to
and AHA recommendations. While most children, especially in the younger age groups, meet the
MyPlate and AHA recommendations. While most children, especially in the younger age groups,
recommendation for daily amount of fruit, the majority of children in all age/sex categories fell short of
meet the recommendation for daily amount of fruit, the majority of children in all age/sex categories
the recommendations for vegetables and added sugars, with older children faring worse than younger
fell short of the recommendations for vegetables and added sugars, with older children faring worse
children. Our results show that, in spite of this sub-optimal consumption, 44–65% of parents strongly
than younger children. Our results show that, in spite of this sub-optimal consumption, 44–65% of
agreed their child ate healthy, indicating a mismatch between the healthfulness of their child’s diet and
parents strongly agreed their child ate healthy, indicating a mismatch between the healthfulness of
their child’s diet and the perceived healthfulness. This observed mismatch occurs despite the fact that
children’s dietary behaviors are reported by the parent themselves. Even though parents tend toNutrients 2020, 12, 2322 9 of 12
the perceived healthfulness. This observed mismatch occurs despite the fact that children’s dietary
behaviors are reported by the parent themselves. Even though parents tend to overestimate the overall
healthfulness of their child’s diet, we found an association between children’s eating behaviors and
parental perception. This association was observed for several sex/age groups and was in the expected
direction, as healthier behaviors corresponded to healthier perceptions. The most marked associations
were observed for vegetables, followed by fruits and added sugars.
Consistent with previous studies [5,26], we found that average vegetable consumption was lower
than the MyPlate recommendations for all age/sex groups. This lower consumption of vegetables
was observed across all parental perception categories. However, children in most age/sex categories
(5 out of 6 examined) whose parent strongly agreed they ate healthy consumed more vegetables
compared to children with parents in the other two perception categories (somewhat agree and
disagree). This suggests that overall, parents seem to be aware that eating vegetables is healthy;
however, they might underestimate the optimum quantity of vegetables their child should eat.
With regard to fruit, children (up to 13 years-old) on average tended to consume the recommended
amounts, adolescents (age 14–18) did not. This pattern is consistent with nationally representative
data [5,27]). When differences in fruit consumption were compared across parental perception
categories, they were in the expected direction, showing that consumption was higher for children
whose parents strongly agreed that their child ate healthy. This association was observed for 14–18-year
old males, but not for 14–18-year-old females. It is therefore likely that parents of adolescent boys may
consider fruit as a component of healthy eating more so than parents of adolescent girls. The low
consumption of fruit by adolescent girls in our sample and nationally [4], coupled with lack of their
parent’s perception that higher fruit consumption is associated with healthy eating is particularly
concerning and should be addressed through nutrition education programs.
Lastly, similar to what was observed at the national level [4,7,28], children in our sample, regardless
of age and sex, consumed more added sugars than recommended by the AHA. Differences in added
sugar intake across parental perception categories were only observed for 4–8-year-old children and
9–13-year-old males. This limited association between sugar consumption and parental perception
of children’s diet quality may have two possible explanations. First, parents may not be aware of
the overall detrimental effects of added sugars on health and may perceive sugar sweetened foods
as an integral part of children’s diets. Second, there is a large selection of highly marketed sugar
sweetened beverages that parents may not perceive as unhealthy [29]. Parents have also been shown
to consider sugary beverages, such as sports drinks, fruit drinks, and flavored waters, as healthier
alternatives to soda [30,31]. National data have shown that although prevalence of soda consumption
has decreased, sports/energy drink consumption has tripled among adolescents [32].
Our findings have implications for designing future interventions and studies aimed at improving
children’s diets. Although most children fell short of recommendations for vegetables and, to a lesser
extent for fruit, higher consumption of these foods was, in most instances, associated with parents’
perception that their child eats healthy. In addition to highlighting the healthful impacts of eating
fruits and vegetables, interventions targeting parents should emphasize age appropriate quantities for
children to consume. Parents’ inability to associate added sugars with unhealthy diets suggest future
interventions should focus on using evidence-based messaging for limiting added sugar consumption,
including clear information on sugar content of foods and beverages and negative health consequences
of sugar consumption [29].
A major strength of this study was a large, diverse sample of children across a wide age
range. Another strength was the use of validated survey questions to assess children’s consumption,
with frequency of consumption responses converted into quantities using the established protocol
recommended by the NCI. While we recognize that parent reports of their child’s dietary behaviors
have some drawbacks [33], using parent reports allowed us to analyze children of different ages
(3–18 years-old) and to directly compare child’s dietary behaviors with parental perception of the
healthfulness of their child’s diet [20,21]. Parent reports are also subject to social desirability bias,Nutrients 2020, 12, 2322 10 of 12
which can result in over-reporting consumption of healthy foods and underreporting unhealthy
ones [34]. However, in the current study, social desirability bias would translate into a conservative
estimate of the observed mismatch between parental perception and children’s consumption, as parents
are likely to have reported a higher consumption of healthy foods like fruits and vegetables and lower
consumption of unhealthy beverages and snacks. Future studies should consider using older children’s
self-reported diet consumption or other objective consumption measures to assess discrepancies
between parental perceptions and children’s diet. The main limitation of the current study was the
inclusion of only three food categories, while excluding three of the five MyPlate food group categories
(i.e., whole grains, dairy, and lean proteins), as these data were not available in the NJCHS. Lastly,
we acknowledge that the construct of an overall healthy diet might be interpreted differently across
respondents, as perception questions inherently carry a subjective component.
5. Conclusions
Most parents consider their children’s diets to be healthy, even though most children fall short of the
recommendations for fruits (except at younger ages) and vegetables and exceed the recommendations
for added sugars. Despite some variation across age/sex groups, we found that parents’ perceptions of
their children’s diets are positively associated with higher, albeit still inadequate, consumption of fruits
and vegetables but show a weak association with consumption of added sugars. Nutrition education
efforts aimed at informing parents of the components of a healthy diet should reflect specific age and
sex serving amounts that are provided in the DGA and MyPlate resources.
Author Contributions: Conceptualization, J.E., F.A., R.S.D. and P.O.-V.; methodology, J.E., F.A., R.S.D. and P.O.-V.;
software, J.E. and F.A.; validation, R.S.D., S.V.-L., and P.O.-V.; formal analysis, J.E., F.A., and P.O.-V.; investigation,
R.S.D. and P.O.-V; resources, P.O.-V.; data curation, J.E.; writing—original draft preparation, J.E.; writing—review
and visualization, J.E., F.A., R.S.D., S.V.-L., and P.O.-V.; supervision, P.O.-V.; project administration, P.O.-V.; funding
acquisition, P.O.-V. All authors have read and agreed to the published version of the manuscript.
Funding: The authors would like to thank the Eunice Kennedy Shriver National Institute of Child Health
and Human Development Grant 1R01HD071583-01A1, the National Heart, Lung and Blood Institute Grant
R01HL137814 and the Robert Wood Johnson Foundation for their support of this work. The content is solely the
responsibility of the authors and does not necessarily represent the official views of the National Institutes of
Health. The funding source had no role in the collection, analysis and interpretation of data; in the writing of the
report; or in the decision to submit the article for publication.
Conflicts of Interest: The authors declare no conflict of interest.
Ethics Approval and Consent to Participate: All data collected for this study involved the obtaining of an oral
informed consent form each participant. Prior to asking their consent, all participants were informed about
the purpose and meaning of the study, the subsequent plans for anonymized publication of the information,
the assured confidentiality of sensitive data points, and the voluntary nature of participation, including the right
to withdraw at any stage from the research, without any repercussions thereof. The Rutgers and Arizona State
University Institutional Review Boards approved the study.
References
1. United States Department of Health and Human Services; Department of Agriculture. Dietary Guidelines
for Americans 2015–2020. 2015. Available online: https://health.gov/dietaryguidelines/2015/guidelines/
(accessed on 21 April 2020).
2. United States Department of Agriculture. Choose MyPlate. 2019. Available online: https://www.
choosemyplate.gov/WhatIsMyPlate (accessed on 21 April 2020).
3. Vos, M.B.; Kaar, J.L.; Welsh, J.A.; Van Horn, L.V.; Feig, D.I.; Anderson, C.A.M.; Patel, M.J.; Cruz Munos, J.;
Krebs, N.F.; Xanthakos, S.A.; et al. Added sugars and cardiovascular disease risk in children: A scientific
statement from the American Heart Association. Circulation 2017, 135, e1017–e1034. [CrossRef] [PubMed]
4. National Cancer Institute. Usual Dietary Intakes: Food Intakes, U.S. Population, 2007–2010. Epidemiology
and Genomics Research Program website, updated October 31, 2019. Available online: https://epi.grants.
cancer.gov/diet/usualintakes (accessed on 21 April 2020).Nutrients 2020, 12, 2322 11 of 12
5. Kim, S.A.; Moore, L.V.; Galuska, D.; Wright, A.P.; Harris, D.; Grummer-Strawn, L.M.; Merlo, C.L.; Nihiser, A.J.;
Rhodes, D.G. Vital signs: Fruit and vegetable intake among children—United States, 2003–2010. Morb. Mortal.
Wkly. Rep. 2014, 63, 671–676.
6. Bailey, R.; Fulgoni, V.; Cowan, A.; Gaine, P. Sources of added sugars in young children, adolescents, and
adults with low and high intakes of added sugars. Nutrients 2018, 10, 102. [CrossRef]
7. Rosinger, A.; Herrick, K.; Gahche, J.; Park, S. Sugar-sweetened beverage consumption among U.S. youth,
2011–2014. Natl. Cent. Health Stat. (NCHS) Data Brief 2017, 271, 1–8.
8. Dunford, E.K.; Popkin, B.M. 37 year snacking trends for US children 1977-2014: Snacking in US children.
Pediatric Obes. 2018, 13, 247–255. [CrossRef]
9. Centers for Disease Control and Prevention. The CDC Guide to Strategies to Increase the Consumption of Fruits
and Vegetables; U.S. Department of Health and Human Services: Washington, DC, USA, 2011. Available online:
https://www.cdc.gov/obesity/downloads/strategies-fruits-and-vegetables.pdf (accessed on 21 April 2020).
10. Robson, S.M.; Couch, S.C.; Peugh, J.L.; Glanz, K.; Zhou, C.; Sallis, J.F.; Saelens, B.E. Parent diet quality and
energy intake are related to child ciet quality and energy intake. J. Acad. Nutr. Diet. 2016, 116, 984–990.
[CrossRef]
11. Coto, J.; Pulgaron, E.R.; Graziano, P.A.; Bagner, D.M.; Villa, M.; Malik, J.A.; Delamater, A.M. Parents as role
models: Associations between parent and young children’s weight, dietary intake, and physical activity in
a minority sample. Matern. Child Health J. 2019, 23, 943–950. [CrossRef]
12. Patrick, H.; Nicklas, T.A.; Hughes, S.O.; Morales, M. The benefits of authoritative feeding style: Caregiver
feeding styles and children’s food consumption patterns. Appetite 2005, 44, 243–249. [CrossRef] [PubMed]
13. Adamo, K.B. Parental perceptions and childhood dietary quality. Matern. Child Health J. 2014, 18, 978.
[CrossRef] [PubMed]
14. Briefel, R.R.; Deming, D.M.; Reidy, K.C. Parents’ perceptions and adherence to children’s diet and activity
recommendations: The 2008 feeding infants and toddlers study. Prev. Chronic Dis. 2015, 12, E159. [CrossRef]
[PubMed]
15. Kourlaba, G.; Kondaki, K.; Grammatikaki, E.; Roma-Giannikou, E.; Manios, Y. Diet quality of preschool
children and maternal perceptions/misperceptions: The GENESIS study. Public Health 2009, 123, 738–742.
[CrossRef] [PubMed]
16. Adamo, K.B.; Papadakis, S.; Dojeiji, L.; Turnau, M.; Simmons, L.; Parameswaran, M.; Cunningham, J.;
Pipe, A.L.; Reid, R.D. Using path analysis to understand parents’ perceptions of their children’s weight,
physical activity and eating habits in the Champlain region of Ontario. Paediatr. Child Health 2010, 15, e33–e41.
[CrossRef] [PubMed]
17. Börnhorst, C.; Huybrechts, I.; Ahrens, W.; Eiben, G.; Michels, N.; Pala, V.; Molnár, D.; Russo, P.; Barba, G.;
Bel-Serrat, S.; et al. Prevalence and determinants of misreporting among European children in proxy-reported
24 h dietary recalls. Br. J. Nutr. 2013, 109, 1257–1265. [CrossRef] [PubMed]
18. Murakami, K.; Livingstone, M.B. Prevalence and characteristics of misreporting of energy intake in US
children and adolescents: National Health and Nutrition Examination Survey (NHANES) 2003–2012.
Br. J. Nutr. 2016, 115, 294–304. [CrossRef] [PubMed]
19. Lamb, M.M.; Ross, C.A.; Brady, H.L.; Norris, J.M. Comparison of children’s diets as reported by the
child via the Youth/Adolescent Questionnaire and the parent via the Willett food-frequency questionnaire.
Public Health Nutr. 2007, 10, 663–670. [CrossRef] [PubMed]
20. Tasevska, N.; Delia, D.; Lorts, C.; Yedidia, M.; Ohri-Vachaspati, P. Determinants of sugar-sweetened beverage
consumption among low-income children: Are there differences by race/ethnicity, age, and sex? J. Acad.
Nutr. Diet. 2017, 117, 1900–1920. [CrossRef]
21. Steeves, S.; Acciai, F.; Tasevska, N.; DeWeese, R.S.; Yedidia, M.J.; Ohri-Vachaspati, P. The special supplemental
nutrition program for women, infants, and children spillover effect: Do siblings reap the benefits? J. Acad.
Nutr. Diet. 2020, 120, 1288–1294. [CrossRef]
22. Centers for Disease Control and Prevention. Behavioral Risk Factor Surveillance System (BRFSS) Survey; U.S.
Department of Health and Human Services: Atlanta, GA, USA, 2005.
23. Centers for Disease Control and Prevention. National Center for Health Statistics (NCHS). National Health and
Nutrition Examination Survey (NHANES) Questionnaire; U. S. Department of Health and Human Services,
Centers for Disease Control and Prevention: Hyattsville, MD, USA, 2014.Nutrients 2020, 12, 2322 12 of 12
24. National Cancer Institute. Converting Frequency Responses to Daily Frequency. 2018. Available online:
https://epi.grants.cancer.gov/nhanes/dietscreen/scoring/current/convert.html (accessed on 21 April 2020).
25. StataCorp. Stata Statistical Software: Release 15; StataCorp LLC: College Station, TX, USA, 2017.
26. Steinberger, J.; Daniels, S.R.; Hagberg, N.; Isasi, C.; Kelly, A.S.; Lloyd-Jones, D.; Pate, R.R.; Pratt, C.; Shay, C.M.;
Towbin, J.A.; et al. Cardiovascular health promotion in children: Challenges and opportunities for 2020 and
beyond. Circulation 2016, 134, e236–e255. [CrossRef]
27. Lorson, B.A.; Melgar-Quinonez, H.R.; Taylor, C.A. Correlates of fruit and vegetable intakes in US children.
J. Am. Diet. Assoc. 2009, 109, 474–478. [CrossRef]
28. Liu, J.; Rehm, C.D.; Onopa, J.; Mozaffarian, D. Trends in diet quality among youth in the United States,
1999–2016. J. Am. Med Assoc. 2020, 323, 1161–1174. [CrossRef]
29. Morel, K.; Nichols, K.; Nong, Y.; Charles, N.; Price, S.; Taveras, E.; Goldman, R.; Woo Baidal, J.A. Parental
and provider perceptions of sugar-sweetened beverage interventions in the first 1000 days: A qualitative
study. Acad. Pediatr. 2019, 19, 748–755. [CrossRef] [PubMed]
30. Munsell, C.R.; Harris, J.L.; Sarda, V.; Schwartz, M.B. Parents’ beliefs about the healthfulness of sugary drink
options: Opportunities to address misperceptions. Public Health Nutr. 2016, 19, 46–54. [CrossRef] [PubMed]
31. Moran, A.J.; Roberto, C.A. Health warning labels correct parents’ misperceptions about sugary drink options.
Am. J. Prev. Med. 2018, 55, e19–e27. [CrossRef] [PubMed]
32. Han, E.; Powell, L.M. Consumption patterns of sugar-sweetened beverages in the United States. J. Acad.
Nutr. Diet. 2013, 113, 43–53. [CrossRef]
33. Burrows, T.L.; Truby, H.; Morgan, P.J.; Callister, R.; Davies, P.S.; Collins, C.E. A comparison and validation of
child versus parent reporting of children’s energy intake using food frequency questionnaires versus food
records: Who’s an accurate reporter? Clin. Nutr. 2013, 32, 613–618. [CrossRef]
34. Miller, T.M.; Abdel-Maksoud, M.F.; Crane, L.A.; Marcus, A.C.; Byers, T.E. Effects of social approval bias
on self-reported fruit and vegetable consumption: A randomized controlled trial. Nutr. J. 2008, 7, 1–7.
[CrossRef]
© 2020 by the authors. Licensee MDPI, Basel, Switzerland. This article is an open access
article distributed under the terms and conditions of the Creative Commons Attribution
(CC BY) license (http://creativecommons.org/licenses/by/4.0/).You can also read