CHINA ALS BESCHAFFUNGSMARKT & ALTERNATIVEN - HERZLICH WILLKOMMEN ZUM CHINA TAG 28.01.2021
←
→
Page content transcription
If your browser does not render page correctly, please read the page content below

HERZLICH WILLKOMMEN ZUM CHINA TAG

           CHINA
 ALS BESCHAFFUNGSMARKT
      & ALTERNATIVEN

           28.01.2021
PROGRAMM
•
            BESCHAFFUNGSMARKT CHINA: TRENDS UND HERAUSFORDERUNGEN
            Christina Schösser, Wirtschaftsdelegierte Außenwirtschaftscenter Shanghai               1

             RISIKEN UND ABHÄNGIGKEITEN BEIM SOURCING AUS CHINA UND ASIEN

        •
              BEWERTEN UND MINDERN
               Christian Santner, Managing Director MANGGEI CONSULTING
               Eric Savoye, Programmanager Industry/Machinery/Materials, Aussenwirtschaft Austria
                                                                                                    2

    •
             VIETNAM EINE ALTERNATIVE ZU CHINA?
             Dietmar Schwank, Wirtschaftsdelegierter Außenwirtschaftscenter HoChiMinh City          3

•
            UPDATE TRANSPORT & LOGISTIK
             Michael Hoffmann, Director Sea Logistics Austria, Kühne + Nagel Ges.m.b.H.             4
                                                                                                        2
PROGRAMM
•
            BESCHAFFUNGSMARKT CHINA: TRENDS UND HERAUSFORDERUNGEN
            Christina Schösser, Wirtschaftsdelegierte Außenwirtschaftscenter Shanghai               1

             RISIKEN UND ABHÄNGIGKEITEN BEIM SOURCING AUS CHINA UND ASIEN

        •
              BEWERTEN UND MINDERN
               Christian Santner, Managing Director MANGGEI CONSULTING
               Eric Savoye, Programmanager Industry/Machinery/Materials, Aussenwirtschaft Austria
                                                                                                    2

    •
             VIETNAM EINE ALTERNATIVE ZU CHINA?
             Dietmar Schwank, Wirtschaftsdelegierter Außenwirtschaftscenter HoChiMinh City          3

•
            UPDATE TRANSPORT & LOGISTIK
             Michael Hoffmann, Director Sea Logistics Austria, Kühne + Nagel Ges.m.b.H.             4
                                                                                                        3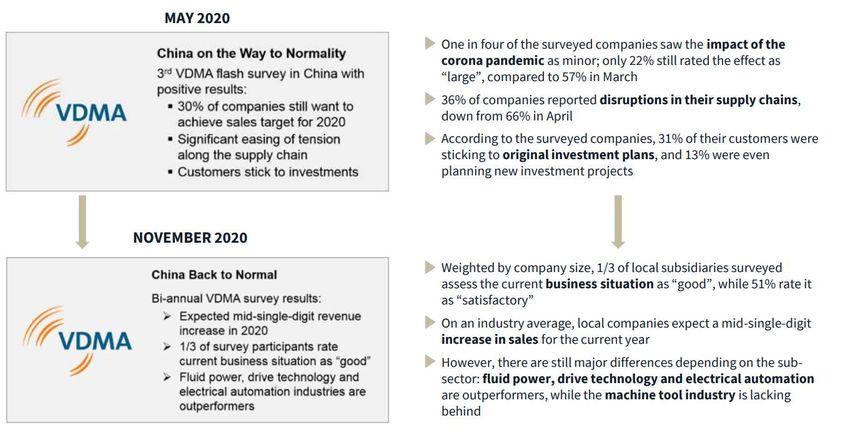
BESCHAFFUNSMARKT CHINA
2021 AND BEYOND

Exportweltmeister China Quo Vadis?
COVID, Optimierung von Lieferketten,
China +1…

China-Tag
28. Jänner 2020
Christina Schösser
Wirtschaftsdelegierte in Shanghai
AGENDA

                             ÖSTERREICH & EU
         EXPORTWELTMEISTER                        AKTUELLE
               CHINA                           SOURCING TRENDS

                                                                 5
EXPORTWELTMEISTER
    CHINA
1

                        6
EXPORTWELTMEISTER CHINA

CHINA – EIN GLOBAL PLAYER AUF VIELEN BÜHNEN

 Quelle: Unctad https://unctadstat.unctad.org/EN/Index.html   Quelle: IMF https://www.imf.org/en/Publications/WEO/weo-database/2020/October

                                                                                                                                              7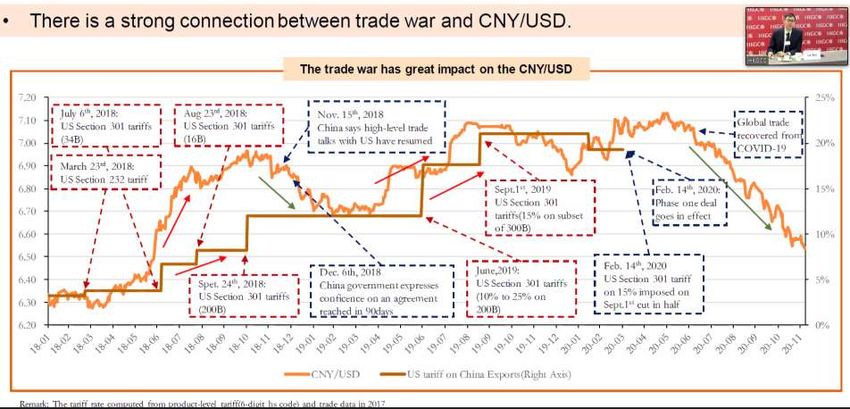
EXPORTWELTMEISTER CHINA

      EXPORTENTWICKLUNG

                                   Quelle: Chin. Statistikamt http://www.stats.gov.cn/english/PressRelease/202002/t20200228_1728917.html

Quelle: WTO https://data.wto.org                                                                                                     8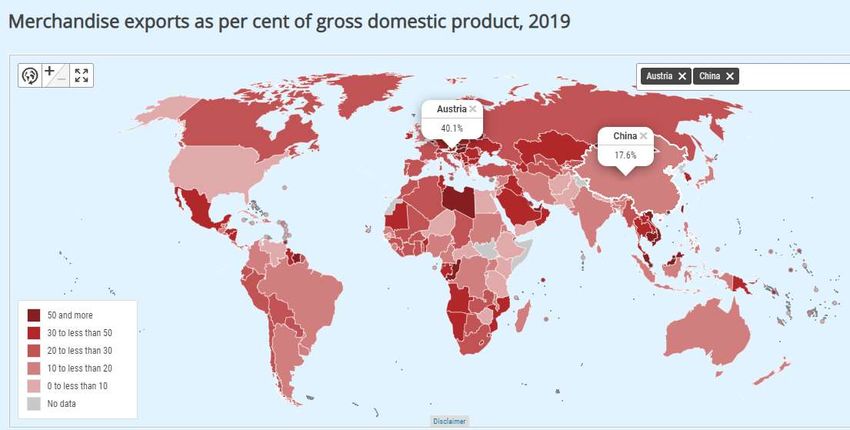
EXPORTWELTMEISTER CHINA

SETTING THE SCENE…

                          Quelle: Beides Unctad Handbook of Statistics 2020
                          https://stats.unctad.org/handbook/MerchandiseTrade/Total.html

                                                                              9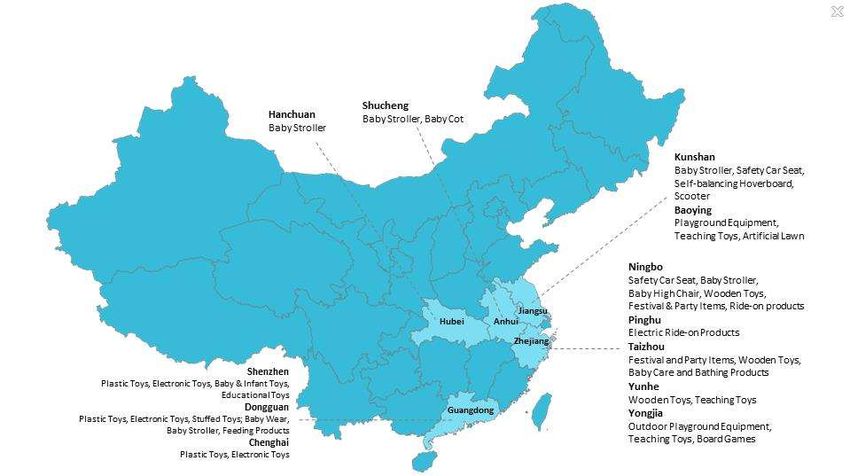
ÖSTERREICH & EU
2

                      10
ÖSTERREICH & EU
EU UND CHINA -
TOP HANDELSPARTNER
11
Quelle: EUROSTATÖSTERREICH & EU
ÖSTERREICHS IMPORTE IN MRD. EURO 2019
12
Quelle: Statistik AustriaÖSTERREICH & EU
ÖSTERREICH – CHINA
13
Quelle: Statistik AustriaÖSTERREICH & EU
ÖSTERREICHISCHE IMPORTE aus China
und ausgewählten Ländern 2019
14
Quelle: Statistik AustriaCLUSTER all over…
Quelle: Sourcing Alliance, https://www.sourcingallies.com/blog/guide-to-finding-a-manufacturer
15
Quelle: Webseite The 19th China International Toy Fair, https://www.china-toy-expo.com/en/html/2019/fairnews_0917/2866.htmlAKTUELLE SOURCING
TRENDS
3
16CHINA
AKTUELLE SOURCING TRENDS • Lieferanten / gesamte • Abnehmermarkt
Produktionskette /Scale • China als Lieferant für
• Produktionskosten emerging Markets
GLOBALE TRENDS • Infrastruktur • leapfrogging in
TECHNOLOGIE • Pool an Arbeitskräften / technology
• Digitalisierung – predates technische Fähigkeiten • ADI
COVID • Sustainabilty
• Einsatz KI • Near shoring Kapazität
• Smart Manufacturing
• 3D Design / VR / Big
Data /
HEDGING WATCH OUT FOR… BEDEUTUNG CPO
• Versicherung • ESG / Sustainability • umfassende strategische
• Vorratswirtschaft • Interventionen Partnerschaften
• Diversifikation • Patriotismus • Einsatz von Technologie
• Near- /Re-Shoring • Resilienz & Autarkie als enabler
• Risk accessment • Ownership of supply chain • diverse & inclusive supply
• Verständnis der vollen / M&A / strategic supply chains
Lieferketten / Monitoring chain acquisitions 17
• Kosten /Margen/ total costATKUELLE SOURCING TRENDS THAILAND
+ Gute Infrastruktur Bürokratie & Korruption
+ Zulieferindustrie Rechtsunsicherheit
ALTERNATIVEN hoch entwickelt Englischkenntnisse schwach
INDIEN + Attraktive Lohnkosten Kein FHA in Aussicht
+ Produktionskosten Logistik
+ Sprache fehlendes FTA EU
+ Innovation Schmuckwaren Maschinen, Motoren
kein RCEP Mitglied
+ Start-Up KFZ & KFZ-Teile & Apparate
Rechtssicherheit
Ökosystem Elektrische Geräte & Textilien & Bekleidung
Zollerhöhungen 2019
+ DBA, EU-Indien Komponenten Kautschukprodukte
Schuhe elektrotechn. Waren
Bekleidung Schaltungen
Motorenteile IT Services
MALAYSIEN
+ „Ease of Doing nicht so viele Elektronikteile IT-Services, Call Center
Business“ Lieferanten PPE, medizin. Waren Softwareentwicklung
+ E&E, Medizin-, kleinere Betriebe Kunststoffwaren
Nischenprodukte ev. teurer mineralische Rohstoffe 18ÖSTERREICH IN CHINA
19
Quelle: ABC Indikator China, Oktober 202020
PROGRAMM
•
            BESCHAFFUNGSMARKT CHINA: TRENDS UND HERAUSFORDERUNGEN
            Christina Schösser, Wirtschaftsdelegierte Außenwirtschaftscenter Shanghai               1

             RISIKEN UND ABHÄNGIGKEITEN BEIM SOURCING AUS CHINA UND ASIEN

        •
              BEWERTEN UND MINDERN
               Christian Santner, Managing Director MANGGEI CONSULTING
               Eric Savoye, Programmanager Industry/Machinery/Materials, Aussenwirtschaft Austria
                                                                                                    2

    •
             VIETNAM EINE ALTERNATIVE ZU CHINA?
             Dietmar Schwank, Wirtschaftsdelegierter Außenwirtschaftscenter HoChiMinh City          3

•
            UPDATE TRANSPORT & LOGISTIK
             Michael Hoffmann, Director Sea Logistics Austria, Kühne + Nagel Ges.m.b.H.             4
                                                                                                        21
SECTION...
DISRUPTIONS OCCUR WITH REGULARITY
1. Shocks that have not occurred
either at scale (eg, extreme
terrorism, systemic cyberattack,
solar storm) or in modern times
(eg, meteoroid strike,
supervolcano)
2. Based on experience to date;
frequency and/or severity of
events could increase over time
Source: McKinsey Global Institute
22CHINA OVERVIEW
EXPORT SUMMARY BY TOP HS CODES
China Export
CAGR % of total Top Export Import Duty Export No of
HS Series Category Top Products Value (2019) in
(in %) export (2019) Destinations into EU Duty Suppliers
Euro Billion
Electric app for line telephony, etc
Electric & USA, Japan, South
85 Electronic Television camera, transmission app for radio- 599.4 2.6 % 25 % Korea, Germany, 0-3.6% Nil >200
Equipment telephony Vietnam, Malaysia
Diodes/transistors & semiconductor devices etc
Automatic data processing machines, optical reader
USA, Japan,
etc
Industrial Netherlands,
84 Parts of computers & office machines 372.5 3.2 % 19 % 0-6% Nil >200
Machinery Germany, Italy,
Printing machinery, etc Mexico, UK
Flat Rolled Prod of Iron & Steel & Ferro Alloys
Iron & Steel and USA, Australia, Japan,
72 Structures like Rods, Angles & Plates 35.2 -5.59 % 10.7 % Nil Nil >200
Products South Korea, India
Nuts, Bolts & Screws, Tubes, Pipes, etc
Optical and
Liquid crystal devices; lasers; etc USA, Japan, South
90 Medical Devises 65.2 -0.45 % 11.9 % 0-4.7% Nil >200
Korea, Mexico
Electro-medical apparatus
Automotive (Cars,
USA, Japan, South
82 motorcycles, Automobiles & parts 14.8 3.1 % 25.2 % 0-4.5% Nil >200
Korea, Iran
bicycles)
Plastic Products
USA, Japan, South
39 Plastic Products Plastic packing goods or closures stoppers, lids, caps, 75.3 6.15 % 13.5 % 0-6.5% Nil >200
Korea, Germany
closures, plastic containers
23CHINA OVERVIEW
EXPORT SUMMARY BY TOP HS CODES
China Export Value CAGR % of total Top Export Import Duty Export No of
HS Series Category Top Products
(2019) in Euro Billion (in %) export (2019) Destinations into EU Duty Suppliers
Aluminum plates, sheets and strip
USA, Japan, Australia,
76 Aluminum Products Aluminum bars, rods and profiles 23.3 2.04 % 14.9 % 0.075 Nil >200
South Korea
Aluminum table, kitchen, household articles
Heterocyclic compounds with nitrogen hetero-
atom; nucleic acids & their salts
USA, India, Japan,
29 Organic chemicals Antibiotics 50.7 7.19 % 13.8 % 0-6.5% Nil >200
South Korea, Germany
Pro-vitamins & vitamins, natural/reproduced by
synthesis
Germany, USA,
Paper and paperboard; articles of paper pulp, of
48 Packaging 19.7 3.75 % 13 % Sweden, Finland, - Nil >200
paper or of paperboard
Canada
Manufacturing services on physical inputs owned France, Vietnam,
1 Services 17.4 -1.39 % 16 % - Nil >200
by others Germany, Netherlands
24CHINA OVERVIEW
EXECUTIVE SUMMARY
Contract
HS 72 Packaging
HS Category HS 85 HS 84 HS 90 HS 82 HS 39 HS 76 HS 29 manufac-
& 73 materials
turing
Dependency
high medium low medium high medium high high medium low
on China
India Taiwan Vietnam India Vietnam Vietnam Thailand India Malaysia Vietnam
Alternative Vietnam India Taiwan Vietnam Taiwan Taiwan Taiwan Vietnam Taiwan Taiwan
Destinations Malaysia Thailand Thailand Malaysia Thailand Thailand Vietnam Malaysia Thailand Thailand
Ease of
Moving
Major
Challenges
Expected
Transition
Period X X X X X X X X X X
(years)
25CHINA OVERVIEW
EXECUTIVE SUMMARY
Best Sourcing Alternative Countries India China Romania Vietnam
Matrix
Low
Supply Base
1
International
China Skilled Labour
Relation
0
Vietnam
Malaysia
Corruption Infrastructure
Cost
-1
Thailand India
Romania
Market
High
Political Stability
Opportunity
Low High Inflation
Market Attractiveness
-1 ― less favorable 0 ― favorable
1 ― highly favorable
26CHINA OVERVIEW
AUSTRIA IMPORTS FROM CHINA
China Exports to Austria 2017 to 2019 (Euro Million) Meanwhile, "coordination issues“ remain
one of the concerning area for EU
800
761 2017 2018 2019
countries with China. It is challenging to
713
703
coordinate with different jurisdictions,
655
levels of local government, from district
569
to district in individual cities.
The presence of European organizations
in China is to serve the Chinese market.
For example: The European medical
devices and pharmaceutical companies
127
122
119
113
111
110
has witnessed an increase in
82
75
71
68
64
62
59
59
59
58
58
56
56
53
45
45
39
30
opportunities in China due to increase in
drug approvals to maintain better public
85 84 90 94 87 73 61 29 62 95 health due to coronavirus crisis.
Electrical machinery Machinery Optical Furniture Vehicles Articles of Apparel, Organic Apparel Toys, games Although Western European producers
and equipment iron/steel clothing Chemicals and and sports looking CESEE as a potential supply base
Clothing
due to closer supply proximity and a
short term recovery from COVID
The impact of COVID 19 economic recession, trade However, with strong supplier networks, flexible & recession and unemployment, the recent
wars between China and US has influenced the EU skilled workforce, efficient ports and transportation data shows that the imports from EU15
importing countries to look for alternative infrastructure it could be challenging for certain HS countries declined by 35% from the CESEE
destinations to minimize any potential supply code categories to move away from China. region, while the imports from China has
disruption risk in future by diversifying their supplier been back to 2019 level by April 2020.
base (“China plus one” strategy).
Source: Statista, Trading
27
CESEE - Central, Eastern and Southeastern Europe Economics, ITC, Global TimesHS CATEGORIES
SOURCING CLUSTERS FOR OVERALL HS CATEGORIES
Province HS Categories
Anhui Automotive
Guangdong Electric & Electronic, Automotive, Packaging
Jilin Automotive
Fujian Packaging
Guangxi Aluminium
Jilin Guizhou Aluminium
Inner Mongolia Hebei Industrial Machinery, Iron & Steel, Automotive
Liaoning Henan Aluminium
Xinjiang Beijing
Xinjiang Hubei Optical Devices, Plastics & Rubber, Automotive
Neimongu
Gansu Hunan Automotive
Hebei Inner Mongolia Aluminium
Shanxi
Shandong Industrial Machinery, Electric & Electronic,
Ningxia Jiangsu
Packaging
Qinghai Jiangxi Industrial Machinery
Gansu
Shaanxi Henan Jiangsu Shanghai Iron & Steel
Liaoning
Tibet
Xizang Anhui Industrial Machinery
Hube Electric & Electronic, Industrial Machinery, Organic
Sichuan Shandong
i Zhejiang Chemicals
Jiangxi Shanghai Plastics & Rubber, Organic Chemicals, Packaging
Hunan Shanxi Aluminium
Fujian Taiwan
Guizhou Yunnan Aluminium
Automotive,
Yunan Guangxi Zhejiang
Guangdong Plastics & Rubber, Electric & Electronic, Packaging
Hongkong
28CHINA OVERVIEW
LOGISTICS: MAJOR PORTS Yingkou
Container Traffic 6.5 million TEU
Cargo Tonnage 21 million tons
Qinhuangdao
Container Traffic 6.5 million TEU
Major Sea Ports Cargo Tonnage 21 million tons
Dalian
Container Traffic 9.77 million TEU
Cargo Tonnage 455 million tons
Tianjin
Container Traffic 15.97 million TEU
Cargo Tonnage 428.7 million tons
Qingdao
Container Traffic 18.26 million TEU
Cargo Tonnage 600 million tons
Shanghai
Container Traffic 43.3 million TEU
Cargo Tonnage 514 million tons
Ningbo
Container Traffic 26.4 million TEU
Cargo Tonnage 1.12 billion tons
Number of major ports : 34 | Number
of minor ports : 2000 Xiamen
Container Traffic 10.7 million TEU
In Nov 2020, container volumes at 8 218 million tons
Cargo Tonnage
major Chinese ports increased 8.9%
year-on-year. Guangzhou Shenzhen
Container Traffic 21.9 million TEU Container Traffic 27.7 million TEU
Cargo Tonnage 600 million tons Cargo Tonnage 194.9 million tons
Source: Marine Insight
29CHINA OVERVIEW
WAGE ANALYSIS
Regions with the highest average hourly Regions with the lowest average hourly
wage (EUR) wage (EUR)
Beijing 3,03 Hainan 1,5
Shanghai 2,78 Hunan 1,67
Tianjin 2,63 Liaoning 1,68
Shenzneh 2,57 Heilongjiang 1,69
Hebei 2,28 Anhui 1,73
The minimum wages in China is expected to grow in In addition, due to US-China trade war, economic
future. However, the wage increase would be at slowdown, coronavirus pandemic and to keep to
minimum level to reduce the financial burden on remain competitive among regions will have
companies and stabilizing the jobs. significant pressure on wage increase.
30
Source: China-briefingCHINA OVERVIEW
WAGE ANALYSIS
Expected to
Guangxi – only province to increase the wage
Increased minimum Increased minimum after the coronavirus outbreak. Hunan,
Regions increase
wage in 2019-20 wage in last 7 years
minimum wage Gansu, Guiznhou, Tianjin and Zhejiang have
not raised the wage for the last 2 years).
Fujian ✔️ ✔️
Qinghai ✔️ ✔️ 15 out of the 31 regions increased wage in
Guangxi ✔️ 2018. 20 provinces increased wage in 2017.
Hunan ✔️
Gansu ✔️ In 2019 average hourly wages in large cities
Guizhou ✔️ equaled EUR 2.5, in “A” class cities − EUR
2.2, in “B” class cities − EUR 2.0, in “C” and
Tianjin ✔️
“D” class cities − EUR 1.8.
Zhejiang ✔️
Chongqing ✔️
Shaanxi ✔️
Shanghai ✔️
Beijing ✔️
Hebei ✔️
31
Source: China-briefingCHINA OVERVIEW
MONETARY POLICY & INFLATION
Exchange rate of EUR to CNY Due to socialist, free-market economy and unique export dependent
economic system, China has its own and unique money supply policies and
vary from methods used by other nations.
8,2 Body that controls the money supply in China - The People's Bank of
China (PBOC). The PBOC also control the money supply by changing the
7,9 reserve ratio and the discount rate. China manages its money supply by
controlling forex rates, printing currency, sterilization, the Reserve Ratio,
7,6
the Discount Rate.
7,3 From 2008 to 2020, the Chinese yuan exchange rate to the U.S. dollar
has remained stable and in the range of 6.1 to 7.1.
7,0
2016 2017 2018 2019 2020
Inflation
There is a moderate increase in prices of goods, but the increase is 6%
within the government target. China has set a CPI target of around 3.5%
for 2020, compared with 3% last year. 4%
In addition, there is an increase in food prices but at a slower rate
than in previous months. The major reason is due to the price of pork 2%
which has gradually fallen due to African swine fever outbreak which has
a significant impact on the pig population. 0%
2015 2016 2017 2018 2019
China’s inflation rate was increased to above 5% during the pandemic
-2%
and now the consumer inflation rate remains moderate.
India China Vietnam Romania
32
Source: Investopedia, Focus-EconomicsCurrency Trends
THE TRADE WAR HAS GREAT IMPACT ON CNY/USD
33Currency Trends
CHINESE YUAN IS SOARING
Exchange rate in US dollar per Yuan
Trade-weighted Yuan, index in points, 2019 = 100
China's currency has started the new year
with records. For the first time in two and a half
years, it is trading below the 6.50 yuan to the
dollar mark.
The driver is China's economic upturn. In
addition, the currency is benefiting from hopes
of an easing of the trade conflict with the US
under the new President Biden and a higher risk
appetite on the markets. Economists see further
upside potential for the yuan. One risk is the
Chinese authorities, who are already opposing a
rapid appreciation.
Source: Bloomberg
34CHINA OVERVIEW
CURRENT TRADE BARRIERS WITH EU
1 Service integration 4 Currency risk
The most desired by exporters especially smaller ones is a platform Comparing to North America, the European inspection and
to provide integrated services including logistics/custom/ certification processes and standards are more complicated.
certification etc. essentially a one stop shop. Historically it is very Therefore, it may discourage some exporters and make them favor
fragmented and frustrating. Alibaba International has been rolling North American customers.
out with some service packages but still far from ideal,
An EU based service vendor would be preferred for its ability to High shipping cost logistics
provide more efficient and trustful local services.
5
The unusually high outbound shipping cost has been devastating for
many exporters this year.
2 Currency risk
Most small/medium sized exporters do not have means/ways 6 Cancellation of export trade shows/expos
sometimes even the basic understanding of how to hedge against
currency risks, Traditionally exporters especially small and medium ones rely on
Euro/Yuan fluctuated quite a bit in 2020 with a trough to peak range trade shows/expos for business acquisitions. Pretty much everything
of almost 8%, some of the exporters suffered significant losses. has been cancelled for the year,
Now they try to accomplish the task through online method,
however, it is more difficult. Again, an EU based service provider
with the ability to organize such virtual expos will be met with utter
3 Extensive Anti-dumping list enthusiasm.
The ever evolving and very extensive anti-dumping list has been
frustrating for many exporters,
Some tried to reroute their products to other countries to avoid the
potential hefty tax. However, that would add additional cost and
other associated risks.
35COVID-19 IMPACT and RECOVERY
SUPPLY-CHAIN DISRUPTIONS AFTER COVID-19
Share of respondents having experienced a supply-chain
disruption, by country of main location
94% of companies surveyed in the US,
the UK, France, Germany and Italy USA 26,4% 36,3% 32,2%
reported a Covid-19 induced disruption to
their supply chains, with one out of five France 20,8% 43,6% 30,6%
reporting a “severe disruption”, including
highly digitized ones.
UK 18,0% 42,9% 34,0%
US companies stand out as 26%
reported a “severe disruption” (vs. 17% on
average for other companies); this is in line Germany 16,2% 44,4% 35,4%
with the higher share of IT and tech and
telecom companies in the U.S., which are Italy 13,9% 52,0% 23,0%
highly integrated in global supply chains.
Severely disrupted Disrupted a fair amount
Source: Euler Hermes Global Supply Chain Survey
Disrupted a little Not disrupted at all 36COVID-19 IMPACT and RECOVERY
SUPPLY-CHAIN DISRUPTIONS AFTER COVID-19
Share of respondents having experienced a supply-chain disruption,
by sector
Machinery and
equipment
26,2% 54,5% 12,2% When it comes to sectors, 25%
of companies in machinery and
IT, tech and
telecoms
22,8% 41,5% 29,7% equipment, IT, tech and telecoms
and energy and utilities faced
Energy and Utilities 22,9% 36,0% 33,0% disruption (vs. 16% of companies in
the chemicals and automotive
Automotive 15,9% 43,4% 35,7% sectors). Agrifood’s regional value
chains and its relative resilience
Chemicals 16,1% 41,9% 37,0% during the lockdowns (as one of the
only sectors not shut down) explain
Agrifood 14,00% 39,00% 34,90% why it was less disrupted.
Severely disrupted Disrupted a fair amount Disrupted a little Not disrupted at all
Source: Euler Hermes
Global Supply Chain Survey 37COVID-19 IMPACT and RECOVERY
RECOVERY INDICATORS
Selected economic indicators (monthly year-on-year development)
“First in, first out” – After
being hit hard by the COVID-
19 crisis in Q1 2020, China
recovered quickly in almost
all areas: by mid-2020,
economic indicators such as
Industrial Output had turned
back to growth
Most official indicators have returned back to pre-crisis growth
levels, but recovery has been imbalanced with supply side
rebounding much faster than the demand side Source: China Bureau
38
of StatisticsCHINA OVERVIEW
INDUSTRY UTILIZATION RATE
China - Utilization Rate of National Industrial Capacity China is the 2nd largest economy in the world to recover
(Q3 2020) from the COVID-19 pandemic crisis. (i.e. The industrial
capacity utilization rate reached 76.7% (Q3 2020) from 76.4%
Computer, communication and other
78,9%
(Q3 2019).
electronic equipment manufacturing
For example: The utilization rate for manufacturing
Electrical machinery and equipment
manufacturing
80,9% increased from 77.2% compared to 76.9% in Q3 2019.
Automobile manufacturing Meanwhile, the utilization rate for the mining sector fell to
77,6%
73.9% compared to 74.7 % in Q3 2019.
Special equipment manufacturing
77,8%
General equipment manufacturing
79,0% Quarterly utilization rate of industrial
Non ferrous metal smelting and processing
80,6%
80% capacity
Ferrous metal smelting and processing
81,6% 75%
Non-metallic mineral products
71,8%
70%
Chemical raw materials and chemical
76,2%
products manufacturing
Textile 65%
76,2%
Food manufacturing
74,5%
Coal mining and washing
71,2%
Source: Trading Economics 39COVID-19 IMPACT and RECOVERY
MACRO-ECONOMY
In Q1 2020 the Chinese economy was hit hard by COVID- Key considerations:
19, but with recovery from Q2 on, expected overall GDP
China likely only major global economy
growth for 2020 around 2% – Daily life and economy have
to still post a positive overall GDP
almost recovered back to normal.
growth year in 2020 (~2%) – Strong
growth of ~8% for 2021 expected
Quarterly GDP growth Major economic indicators like retail
sales, industrial output and travel
activity have already almost fully
recovered
Western brands, especially in consumer
goods, report backto-normal or even
growing revenues
Source: China National Bureau of Statistics,
40
Reserve Bank of India, EAC researchCHINA OVERVIEW
OUTLOOK: ECONOMIC DEVELOPMENT 2021
2021 china GDP growth forecasts (% YOY)
China to drive global
recovery: According to
the OECD, with a
forecasted GDP growth
rate of ~8% China is
expected to account for
>1/3 of world economic
growth in 2021
41
Source: OECD, research institutesCHINA OVERVIEW
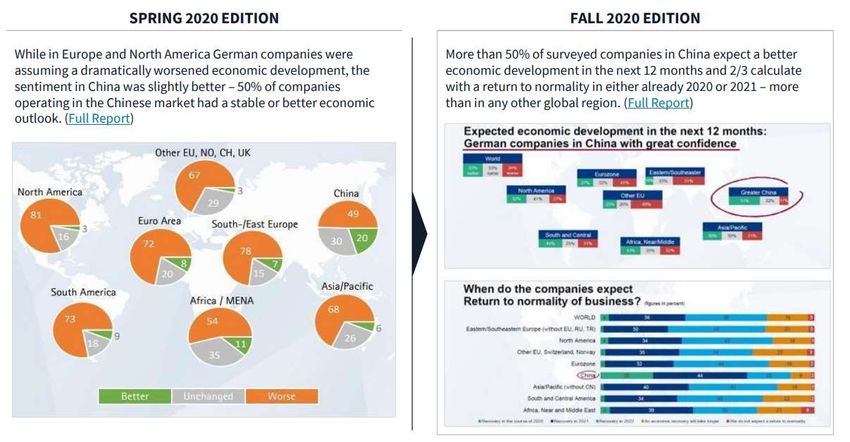
BUSINESS OUTLOOK – DIHK: CONFIDENCE IN CHINA
The DIHK World Business
Outlook reported a sub-
stantial crisis of German
businesses abroad in 2020 –
However, sentiment in
China quickly turned into
greater confidence than in
any other region
42
Source: DIHK World Business OutlookCHINA OVERVIEW
BUSINESS OUTLOOK – VDMA: BACK TO NORMAL
According to surveys
among VDMA member
companies, German
firms in China showed
confidence on the
situation in China early
on and were on average
already experiencing a
return to normal by end
of 2020
43
Source: VDMACOVID-19 IMPACT and RECOVERY
RECOVERY INDICATORS
Purchasing manager index (PMI)
“First in, first out” – After
being hit hard by the
COVID-19 crisis in Q1 2020,
China recovered quickly in
almost all areas: the
confidence of Purchasing
Managers rebounded
quickly and reached new
heights in late 2020
Values >50 indicate a positive outlook,COVID-19 IMPACT and RECOVERY
SUPPLY-CHAIN ACTIONS AS RESPONSE TO COVID-19
Businesses must respond on multiple fronts
at once: at the same time that they work
to protect their workers’ safety, they must
also safeguard their operational viability,
now increasingly under strain from a
historic supply-chain shock.
45
Source: McKinsey Global InstituteCOVID-19 IMPACT and RECOVERY
DRIVERS OF POTENTIAL VULNERABILITY
Source: McKinsey
Global Institute 46SECTION...
INCREASING RESILIENCE IN SUPPLY CHAINS AND
PRODUCTION THROUGH MULTIPLE STRATEGIES
93% of global supply chain leaders are
planning to increase resilience 44% would increase resilience even at
expense of short-term savings
Planned actions to build resilience, % of respondents
Source: McKinsey
47
Global InstituteSECTION...
ACTIONS TO MITIGATE SHORT-TERM
IMPACT ON YOUR SUPPLIERS
Support suppliers with analysis on risks for
certain components
53% Repurposing of manufacturing
Companies are repurposing their
production lines to join the fight against
Guaranteeing purchase of supply 49% COVID-19
Examples include LVMH switching from
producing perfume to making hand
Advance payment to ease pressure / facilitate sanitizer, industrial companies Foxconn
upstream production
46% or ZF Friedrichshafen making face masks,
and luxury hotels becoming quarantine
centres
Paying a premium to offset additional Companies must overcome different
precautions imposed on suppliers
40%
levels of complexity involved as they
make these shifts
I am not taking an actions to mitigate the
immediate impact on suppliers
1%
48
Source: World Economic ForumSECTION...
A TREND TOWARD HOLDING MORE INVENTORY
IS ALREADY UNDER WAY
Inventory turnover
Index: 100 = 2005
49
Source: McKinsey Global InstituteSECTION...
THE STRUCTURE OF SUPPLY CHAIN NETWORKS
CAN CREATE OR REDUCE VULNERABILITY
Creates resilience Invites vulnerability
50
Source: McKinsey Global InstituteSECTION...
THE STRUCTURE OF SUPPLY CHAIN NETWORKS
CAN CREATE OR REDUCE VULNERABILITY (continued)
Creates resilience Invites vulnerability
51
Source: McKinsey Global InstituteBsp: Lieferantenqualifikation Zweit und Drittlieferant
Bemusterungsprozesskosten sind gut investiert
52Bsp: Spend Analyse – Kategorie Risikobewertung –
Alternativmärkte – Nearshoring
Prozesserklärung
53Resilient Supply Chain
IMPACT OF A 50-DAY SUPPLY SHOCK WITH A DEMAND HIT
Analysis assumes differences in footprint, inventory patterns, and insurance
Index: Normalized to revenue = 100
A company with a resilient
supply chain can reduce the
EBITDA impact of a disruption
by 23 percentage points
54
Source: McKinsey Global InstituteCHINA OVERVIEW
OUTLOOK: IMPORTANT DATES TO KEEP IN MIND
Key events to watch
in 2021 will be the
release of China’s
14th Five-Year Plan
in Spring, the 100th
Anniversary of the
Chinese Communist
Party in July, as well
as several political
happenings in
autumn
55
Source: EAC research56
PROGRAMM
•
            BESCHAFFUNGSMARKT CHINA: TRENDS UND HERAUSFORDERUNGEN
            Christina Schösser, Wirtschaftsdelegierte Außenwirtschaftscenter Shanghai               1

             RISIKEN UND ABHÄNGIGKEITEN BEIM SOURCING AUS CHINA UND ASIEN

        •
              BEWERTEN UND MINDERN
               Christian Santner, Managing Director MANGGEI CONSULTING
               Eric Savoye, Programmanager Industry/Machinery/Materials, Aussenwirtschaft Austria
                                                                                                    2

    •
             VIETNAM EINE ALTERNATIVE ZU CHINA?
             Dietmar Schwank, Wirtschaftsdelegierter Außenwirtschaftscenter HoChiMinh City          3

•
            UPDATE TRANSPORT & LOGISTIK
             Michael Hoffmann, Director Sea Logistics Austria, Kühne + Nagel Ges.m.b.H.             4
                                                                                                        57
VIETNAM – EINE ALTERNATIVE ZU CHINA? Sourcing-Trends und Chancen am größten Beschaffungsmarkt Südostasiens China-Tag 28. Jänner 2020 MMag. Dietmar Schwank, Wirtschaftsdelegierter in Ho Chi Minh City
Vietnam als (alternativer) Beschaffungsmarkt
…zur Diversifizierung innerhalb Asiens (außerhalb Chinas)
Streigende Bedeutung von dual/multiple sourcing (China+1)
und „local for local“ Sourcing (Hub-Funktion)
Rezente Investoren-Beispiele
…zur Nutzung von Kostenvorteilen und Arbeitsressourcen
Produktionskosten
Handelsabkommen
…bei Fokus auf mittlere Qualität und kleine/mittlere Mengen
Qualitätsorientierung
In einigen Bereichen Mangel an Kapazitäten und Supply Chain
…bei gewissen Produkten
Quelle: QIMA Umfrage, Juli 2020
Textilien, Schuhe, Elektronik, Möbel, Haushaltswaren,…
Zunehmend auch Lebensmittel, Metall- und Kunststoffwaren,…
59Vietnams omnidirektionale Handelspolitik
EVFTA (in Kraft seit 1.8.2020)
Ambitioniertes, vielschichtiges Abkommen
Zollabbau auf 99 % der Produktlinien (2021: 2. Zollsenkung)
Kumulierung
RCEP (unterzeichnet am 15.11.2020)
Zollabbau für Agrar- und viele hergestellte Güter
Abbau von bürokratischen Handelshemmnissen (z.B.
beschleunigte Zollverfahren, einheitliche Ursprungsregeln)
Konsequenzen aus Sourcing-Sicht
▫ Weiterverarbeitung außerhalb von EPZ teilweise möglich
▫ Zugang zu Absatzmärkten in der Region
▫ Partizipation an globalen Lieferketten durch FDI
▫ Verwässerung von „Made in China“ durch Auslagerung von
Produktionsschritten
▫ Kombinierte Nutzung von FTA
60Beschaffungstrends Vietnam: Sonstige Fertigwaren
Sonstige Fertigwaren - Importe 2019 aus Asien nach AT
Gesamt: 6,7 Mrd. Euro (28 % Weltanteil)
Vietnam bereits #3 3.500 50
Beschaffungsmarkt in Asien
Millionen
Top-Märkte
festigen 40
3.000
Position
Dominanz Chinas schrumpft 2.500
30
in Low-Cost Sektoren Stärkster
Einbruch Abnehm- Zukunfts-
markt
20
ende
Importwachstum in %
2.000
Einfuhrvolumen
Relevanz 10
Ausgewogene Produktpalette Potential-
markt 0
1.500
Bekleidung, Schuhe werden 1.000
-10
traditionell aus Vietnam -20
beschafft 500
-30
0 -40
Boom: Holz- und China Bangladesch Vietnam Indien Thailand Kambodscha Japan Indonesien Myanmar Asien
(andere)
Möbelsektor/Konsumgüter Einfuhren 2019 in EUR Trend vor Pandemie Trend 2020 Quelle: Statistik Austria
Betrifft: Bekleidung, Schuhe, Möbel, Home Accessories,
Kunststoffwaren, Instrumente, Schmuck, etc.
61Beschaffungstrends Vietnam: Maschinenbauerzeugnisse
Maschinenbauwaren - Importe 2019 aus Asien nach AT
Hohe Abhängigkeit Vietnams Gesamt: 9,3 Mrd. Euro (16 % Weltanteil)
von FDI und China Supply 6.000 50
Millionen
Chain 5.000
Dominanz Ostasiens Süd(ost)asien holt langsam auf
40
Fokus auf Assemblierung und 30
4.000
Vertragsfertigung (dank Höchstes
Wachstum
Importwachstum in %
Einfuhrvolumen
20
steigender 3.000
Wachstum
2019
Geringe
Fertigungskapazitäten) 2020 Pandemieeffekte 10
2.000
Vietnam sehr stark 0
positioniert im (low-cost) 1.000
-10
Elektroniksektor 0 -20
China Japan Südkorea Taiwan Vietnam Thailand Indien Malaysia Philippinen Asien
Maschinenbau: (andere)
Technologieupgrades nötig Einfuhren 2019 in EUR Trend vor Pandemie Trend 2020 Quelle: Statistik Austria
Betrifft: Maschinen aller Art, Elektronik, Elektrische Geräte,
Fahrzeuge
62Beschaffungstrends Vietnam: Bearbeitete Waren
Bearbeitete Waren - Importe 2019 aus Asien nach AT
Dominanz Ost- und Südasiens Gesamt: 2,0 Mrd. Euro (8 % Weltanteil)
ggü. ASEAN 1.200
Maskenboom
50
Millionen
Wachstums Zukunfts- 40
-markt für märkte
1.000
China festigt Position auf HomeTex 30
Kosten anderer Länder Asiens 800
20
10
Importwachstum in %
Pandemiefolgen
Einfuhrvolumen
Vietnam als Zukunftsmarkt 600 0
für Beschaffung von 400
-10
Metallwaren, Textilien -20
-30
200
RCEP könnte Position Asiens -40
als Quellmarkt stärken 0
China Indien Japan Taiwan Südkorea Pakistan Thailand Vietnam Indonesien Asien
-50
(andere)
Einfuhren 2019 in EUR Trend vor Pandemie Trend 2020 Quelle: Statistik Austria
Betrifft: Metalle, Metallwaren, Textilien ohne Bekleidung, Papier,
Kautschukwaren
63Kulturbesonderheiten Vietnams in der Beschaffung
Vietnamesen suchen häufiger eine Win-Win-Situation in
der Geschäftsbeziehung
Persönliche Beziehungen (Einführung) noch wichtiger
als anderswo in Asien
Höheres Qualitätsbewusstsein (vs. Fokus auf Quantität)
Dennoch: Achtung auf Lieferqualität (Hands-off
Approach funktioniert nicht, Position auf Lernkurve)
Vorwiegend konservative Preiskalkulation der
Lieferanten
Prüfung der Exporterfahrung wichtig
Erhebliche Kulturunterschiede zwischen Nord und Süd
Quelle: DSA, Vietnam Briefing
6465
PROGRAMM
•
            BESCHAFFUNGSMARKT CHINA: TRENDS UND HERAUSFORDERUNGEN
            Christina Schösser, Wirtschaftsdelegierte Außenwirtschaftscenter Shanghai               1

             RISIKEN UND ABHÄNGIGKEITEN BEIM SOURCING AUS CHINA UND ASIEN

        •
              BEWERTEN UND MINDERN
               Christian Santner, Managing Director MANGGEI CONSULTING
               Eric Savoye, Programmanager Industry/Machinery/Materials, Aussenwirtschaft Austria
                                                                                                    2

    •
             VIETNAM EINE ALTERNATIVE ZU CHINA?
             Dietmar Schwank, Wirtschaftsdelegierter Außenwirtschaftscenter HoChiMinh City          3

•
            UPDATE TRANSPORT & LOGISTIK
             Michael Hoffmann, Director Sea Logistics Austria, Kühne + Nagel Ges.m.b.H.             4
                                                                                                        66
KONTAKT
Internationalisierungscenter Steiermark | Robert Brugger
+43 316 601 400 | rb@ic-steiermark.at
AußenwirtschaftsCenter Shanghai | Christina Schösser
+86 21 6289 7123 | shanghai@wko.at
AUSSENWIRTSCHAFT Industry / Machinery / Materials | Eric Savoye
+43 5 90 900 3727 | eric.savoye@wko.at
manggei consulting | Christian Santner
+43 316 376155 | christian.santner@manggei.comww.manggei.com
AußenwirtschaftsCenter Ho Chi Minh City | Dietmar Schwank
+84 28 7109 9781 | hochiminhcity@wko.at
Kühne + Nagel Ges.m.b.H. | Michael Hoffmann
+43 5 90690 1400 | +43 676 8229 1400 | michael.hoffmann@kuehne-nagel.com
67You can also read


