Choroidal structural evaluation in celiac disease - Nature
←
→
Page content transcription
If your browser does not render page correctly, please read the page content below
www.nature.com/scientificreports
OPEN Choroidal structural evaluation
in celiac disease
Maddalena De Bernardo1*, Livio Vitiello1, Michela Battipaglia2, Francesca Mascolo2,
Claudio Iovino3, Luigi Capasso4, Carolina Ciacci2 & Nicola Rosa1
This observational case–control study assessed the differences in choroidal structure between patients
with celiac disease and healthy subjects utilizing the choroidal vascularity index (CVI). Seventy-four
celiac patients and 67 healthy subjects underwent a complete ophthalmological evaluation, axial
length (AL) measurements and spectral-domain optical coherence tomography with enhanced depth
imaging mode (EDI SD-OCT) evaluation. These images were binarized and choroidal vasculature
was analyzed. Choroidal total subfoveal area (TSA), luminal subfoveal area (LSA), stromal subfoveal
area (SSA), CVI and subfoveal choroidal thickness (CT) were measured. Furthermore, subfoveal CT,
TSA, LSA, SSA, and CVI were also correlated with AL. A statistically significant difference was found
between the two groups for TSA, LSA, SSA and subfoveal CT, but not for CVI. In celiac patients,
a significant correlation was found between AL and TSA, LSA and SSA, but not with CVI. Similar
findings were also noticed in the healthy subjects. Thus, celiac patients have a thicker choroid than
healthy subjects, regardless of the AL, due to a proportional increase in both the vascular and stromal
components, which does not alter the CVI.
Celiac disease is an autoimmune inflammatory disorder mostly affecting the proximal small intestine. It is caused
by autoantibodies produced against tissue transglutaminase that are activated in genetically predisposed people
by gluten and gluten-like p roteins1. Once considered an intestine-related disorder, celiac disease is now known
as a systemic, chronic and immune-mediated condition2. In particular, the autoantibodies identified in celiac
disease bind to different extraintestinal tissues and cause a variety of immunological diseases, such as osteopenia,
dermatitis herpetiformis, iron deficiency anemia, dilated cardiomyopathy, myocarditis, peripheral neuropathy,
ataxia, epilepsy, liver diseases, and g lomerulonephritis3.
Some case reports have shown that celiac disease may involve the eye with different clinical p resentations4–7.
In fact, Al Hemidan et al.4 discussed a case of Vogt-Koyanagi-Harada disease in a diabetic 3-year-old girl with
celiac disease, Krifa et al.5 dealt with a diabetic and celiac 9-year-old girl presenting with uveitis responding to a
gluten-free diet, while Malhi et al.6 reported two cases of central retinal vein occlusion in two Indian girls with
an unknown diagnosis of celiac disease.
Hence, ocular involvement in celiac disease may include immunogenetic factors, cell antigenic epitopes
cross-reactivity, immune complexes or autoantibodies increase, and several vitamins d eficiencies4. Furthermore,
particular attention should be paid to the vascular component of the eye, as the clinical manifestations previously
discussed demonstrate a predominant involvement of this anatomical area.
The choroid is a densely vascularized structure that contributes to the greatest supply of oxygen and other
nutrients to the outer retina and the retinal pigment e pithelium8. It is one of the highest blood flow body tissues,
and most of its anatomical knowledge derives from postmortem histological s tudies9,10.
Over the last decades, optical coherence tomography (OCT) has permitted thorough and non-invasive in vivo
analysis of the retina and choroid. More recent technical developments with the introduction of spectral-domain
optical coherence tomography with enhanced depth imaging mode (EDI SD-OCT) evaluation, swept-source
OCT, and OCT angiography have allowed a more comprehensive study of the choroidal structure. Although
choroidal thickness (CT) measurement is considered a reliable tool in clinical research, it represents the whole
choroidal structure, with no distinction between the luminal and stromal c omponents11–13.
The choroidal vascularity index (CVI) is becoming a new imaging method for choroidal vascular system
measurement and analysis by quantifying both choroidal stromal and luminal parts14,15. CVI shows less variability
1
Eye Unit, Department of Medicine, Surgery and Dentistry, “Scuola Medica Salernitana”, University of Salerno,
Baronissi, Salerno, Italy. 2Celiac Centre at University Hospital San Giovanni Di Dio e Ruggi d’Aragona, University
of Salerno, Baronissi, Salerno, Italy. 3Eye Clinic, Multidisciplinary Department of Medical, Surgical and Dental
Sciences, University of Campania Luigi Vanvitelli, Naples, Italy. 4Corneal Transplant Unit, ASL Napoli 1, Naples,
Italy. *email: mdebernardo@unisa.it
Scientific Reports | (2021) 11:16398 | https://doi.org/10.1038/s41598-021-95812-y 1
Vol.:(0123456789)
www.nature.com/scientificreports/
than CT and it is affected by fewer physiological factors, so it is considered a relatively stable parameter to assess
changes in choroidal vasculature14.
To the best of our knowledge, there has been limited investigation of choroidal vasculature in patients with
celiac disease16–18, all of which have provided conflicting results, and none of these previous studies evaluated
the CVI.
The purpose of this study is to evaluate the differences in choroidal structure between celiac patients and
healthy subjects with CVI, trying to better understand the underlying pathogenetic mechanism of celiac disease
in ocular manifestations.
Materials and methods
Patients selection. In this observational case–control study, adult subjects with a diagnosis of celiac dis-
ease, consecutively seen at the Celiac Disease Center, and a control group of normal subjects, recruited among
spouses of patients and hospital staff, were enrolled between September 2019 and March 2020 at the Department
of Medicine, Surgery and Dentistry of the University of Salerno.
Patients with a diagnosis of celiac disease confirmed by serology and intestinal biopsy, regardless of the time
of diagnosis, were included. Controls were chosen among persons with no diagnosis of gastrointestinal diseases,
and at least one negative celiac disease-specific serology.
Subjects with systemic and ocular diseases, other than celiac disease, which could affect choroidal vascula-
ture, subjects presenting clinical features compatible with a diagnosis of glaucoma, patients younger than 18 or
older than 70 years of age, eyes with an axial length (AL) less than 21 mm or more than 26.5 mm and pregnant
women were excluded. Furthermore, amblyopic eyes and eyes with a best corrected visual acuity less than 20/25
were also excluded.
The established refraction limits were set < 5D (spherical) and < 3D (cylindrical) refractive error.
The present study adheres to the ethical principles of the Declaration of Helsinki.
All the participants were carefully informed about the purpose of the study and written informed consent
from each subject was acquired. Institutional Review Board (IRB) approval was also obtained from the ComEtico
Campania Sud (CECS), prot. n°16544.
Clinical and instrumental examination. Patients underwent a complete ophthalmological evaluation,
including clinical history, Snellen best corrected visual acuity, AL measurements with IOLMaster (Carl Zeiss
Meditec AG, Jena, Germany, version 5.4.4.0006) and EDI SD-OCT evaluation (Spectralis; Heidelberg Engineer-
ing; Heidelberg, Germany, version 6.0).
All participants were examined between 2:00 p.m. and 3:00 p.m., reducing the bias related to the diurnal vari-
ations of choroidal thickness19, and without pupil dilation. A horizontal 30° linear OCT B-scan passing through
the fovea was obtained for all examined eyes. Using the built-in software of the device (Heidelberg Eye Explorer
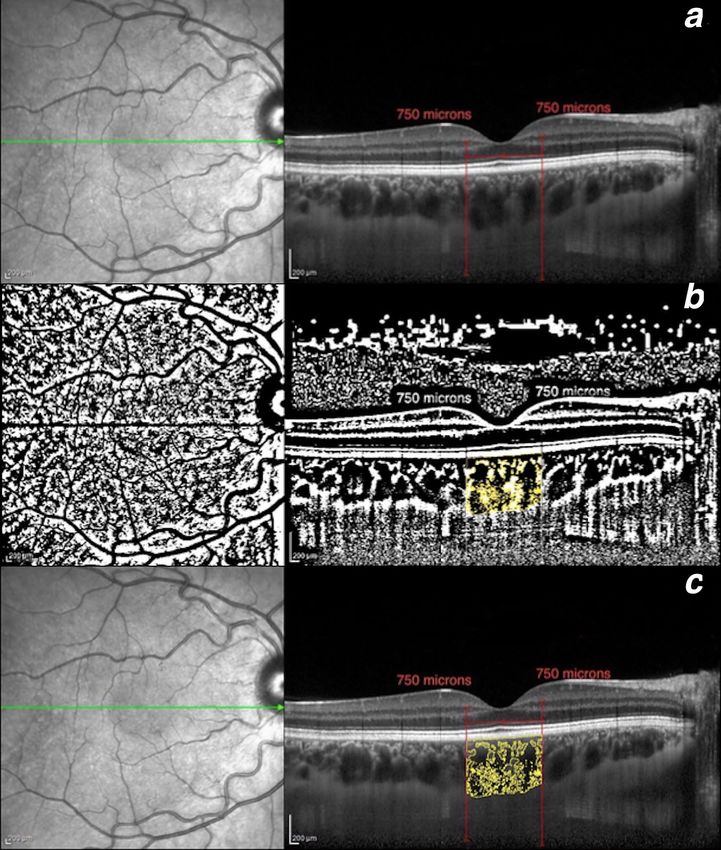
HEYEX; Heidelberg Engineering), the subfoveal CT was measured as the distance between Bruch’s membrane
and the sclera-choroidal interface under the fovea (Fig. 1a,b). Furthermore, a distance of 750 μm was manually
measured nasally and temporally from the centre of the fovea on the OCT B-scan, parallel to the retinal pigment
epithelium. Subsequently, two lines perpendicular to those previously drawn were manually prolonged until the
sclerochoroidal junction, delimiting a subfoveal area (Fig. 2a).
For each patient, the eye with the best OCT quality image index was chosen to perform this evaluation.
Choroidal total subfoveal area (TSA), choroidal luminal subfoveal area (LSA), choroidal stromal subfoveal area
(SSA) and CVI were evaluated in both celiac and healthy subjects.
Low quality OCT images, due to optic media opacities, with an OCT imaging quality index < 20 decibels
were excluded.
OCT analysis: choroidal vascularity index (CVI). All collected and analyzed images, together with sub-
foveal CT measurements, were reviewed by an expert in OCT evaluation (MDB).
In all eyes, macular B scan images were exported with a 1:1 pixel ratio and processed with ImageJ software
(National Institutes of Health, Bethesda, USA, version 1.52q) using the set scale tool to convert pixels to μm.
The TSA, LSA, SSA and CVI were measured and calculated by an examiner who was blind to the patient’s status,
as suggested20–22.
Briefly, the polygon tool was used to select the previously delimitated choroidal subfoveal area in the OCT
B-scan. After converting the image into 8 bit, Niblack’s auto-local threshold was applied to binarize the image
and demarcate the LSA and SSA. LSA was highlighted by applying the color threshold and then added to the
region of interest manager. The TSA and LSA were measured and the CVI (defined as the ratio of LSA to TSA)
was calculated in each eye (Fig. 2b,c). SSA was obtained by subtracting LSA from TSA.
Statistical analysis. All data were analyzed with SPSS Software (IBM SPSS Statistics version 25). For
each parameter the mean, standard deviation, variance, standard error of the mean, variation coefficient, and
minimum and maximum values were calculated. The Kolmogorov–Smirnov test showed a normal distribution
(p > 0.05) for all data, except for age and SSA. In addition, one way analysis of variance was performed, showing
similar variances between the two groups for AL and age. For this reason, to compare the different parameters of
the two groups, the two-tailed independent samples Student’s t-test was used for normal-distributed data, while
the two-tailed Mann–Whitney U test was used for age and SSA. Moreover, the Chi-Square test with Yates correc-
tion to assess potential differences for sex and myopia prevalence between the two groups was also performed.
The Pearson correlation coefficient (r) was utilized to evaluate the correlation between AL and CT, the different
Scientific Reports | (2021) 11:16398 | https://doi.org/10.1038/s41598-021-95812-y 2
Vol:.(1234567890)www.nature.com/scientificreports/
Figure 1. Choroidal thickness measured with the built-in software of the device at the subfoveal level in: (a)
celiac patient. (b) Healthy volunteer.
choroidal areas and CVI of the two study groups, except for SSA of the celiac group, where the Spearman cor-
relation coefficient (ρ) was used.
P values less than 0.05 were considered statistically significant.
The sample size was determined by maximizing the statistical power. The analysis was performed by using
G*Power software (version 3.1.9.4)23. A difference between two independent means (two groups) was computed.
Input data were the following: α was set at 0.05; 1-β was set at 0.838; allocation ratio N2/N1 was set at 0.91; effect
size was set as medium at around 0.5. Results were the following: non-centrality parameter δ = 2.965; critical
t = 1.977; Df = 139; sample size group 1 = 74; sample size group 2 = 67; actual power = 0.835; total sample size = 141.
Results
A total of 74 celiac patients and 67 healthy volunteers, chosen among spouses of patients and hospital staff, were
enrolled. Three celiac patients and with low quality OCT images were excluded. Sixty-eight patients out of 74
were following a gluten-free diet since the diagnosis of celiac disease (> 1 year). Six patients were examined after
a few days from the diagnosis and the beginning of the gluten-free diet. The mean disease duration of patients
with celiac disease was 9.2 ± 8.6 years (range: 0–41 years).
All clinical and choroidal characteristics of the two groups are summarized in Table 1. There were no sta-
tistically significant differences for age, AL and sex between the groups (p = 0.947, p = 0.119, and p = 0.065
respectively).
Concerning the prevalence of myopic eyes (AL > 24.5 mm) in the two study groups, (16.2% in the celiac group
and 23.9% in the control group), no statistical significant difference was found (p = 0.354) .
Regarding subfoveal CT, a statistically significant difference was found between the two studied groups
(p = 0.0002) (Table 1).
Concerning different subfoveal choroidal areas and CVI, a statistically significant difference was found
between the two groups for TSA, LSA and SSA (p < 0.0001, p < 0.0001, p = 0.002, respectively), but not for CVI
(p = 0.760) (Table 1).
Concerning the correlation between AL and the different choroidal parameters, for the celiac group a signifi-
cant correlation was found between AL and all the choroidal parameters, except for CVI (Table 2).
Regarding the control group, similar findings were noticed (Table 2).
All the correlation graphs are depicted in the Fig. 3a–e.
No significant correlation between disease duration and choroidal parameters was found.
Scientific Reports | (2021) 11:16398 | https://doi.org/10.1038/s41598-021-95812-y 3
Vol.:(0123456789)www.nature.com/scientificreports/
Figure 2. Choroidal vascularity index calculation in a healthy volunteer. (a) Determination of the subfoveal
choroidal region in the original EDI SD-OCT image with the built-in software of the device. (b) Identification
of the subfoveal luminal and stromal areas using the binarization technique. (c) Overlay of the target choroidal
region created by image binarization on the EDI SD-OCT image.
Discussion
Celiac disease is an autoimmune disease with systemic involvement that mainly affects the small intestine, but it
also presents several extraintestinal m anifestations3. Among these, the eye certainly represents one of the target
organs of the disease, and night blindness, dry eye, cataract, thyroid-associated orbitopathy, uveitis, central retinal
vein occlusion and neuro-ophthalmic manifestations may o ccur24.
In this context, an in vivo study of the choroidal characteristics would provide interesting information.
CVI is a recent imaging tool that allows a more accurate evaluation of the choroidal structure, facilitat-
ing discrimination of the vascular and stromal components, and also providing their quantification14,15. This
new parameter has already been used to evaluate different ocular and systemic disorders and pathological
conditions25–28. To the best of our knowledge, this is the first study which utilizes CVI in the choroid appraisal
and analysis of patients with celiac disease.
Scientific Reports | (2021) 11:16398 | https://doi.org/10.1038/s41598-021-95812-y 4
Vol:.(1234567890)www.nature.com/scientificreports/
Mean SD σ2 SEM σ* (%) Min Max p-value
Age
Celiac group 40.78 11.33 128.37 1.32 27.78 18.00 66.00
0.947a
Control group 40.67 13.82 190.99 1.69 33.98 23.00 69.00
AL (mm)
Celiac group 23.59 0.95 0.90 0.11 4.04 21.70 26.12
0.119b
Control group 23.85 1.00 1.00 0.12 4.19 21.50 26.36
Sex (M/F)
Celiac group 21/53
0.065c
Control group 30/37
Subfoveal CT (µm)
Celiac group 372.38 92.82 8615.55 10.79 24.93 178.00 560.00
0.0002b
Control group 315.51 86.63 7504.76 10.58 27.46 74.00 532.00
TSA (mm2)
Celiac group 1.94 0.50 0.25 0.06 25.74 0.83 2.74
< 0.0001b
Control group 1.62 0.41 0.17 0.05 25.62 0.36 2.65
LSA (mm2)
Celiac group 1.31 0.34 0.12 0.04 25.88 0.55 2.03
< 0.0001b
Control group 1.09 0.27 0.07 0.03 24.63 0.26 1.66
SSA (mm2)
Celiac group 0.63 0.18 0.03 0.02 28.91 0.28 1.02
0.002a
Control group 0.53 0.17 0.03 0.02 32.16 0.10 1.09
CVI (%)
Celiac group 67.75 3.41 11.63 0.40 5.03 60.18 78.25
0.760b
Control group 67.55 4.16 17.31 0.51 6.16 58.83 76.74
Table 1. Clinical and Choroidal Characteristics of the two study groups. SD standard deviation, σ2 variance,
SEM standard error of the mean, σ* variation coefficient, AL axial length, CT choroidal thickness, TSA total
subfoveal area, LSA luminal subfoveal area, SSA stromal subfoveal area, CVI choroidal vascularity index.
a
Mann Whitney U test. b Student t-test unpaired. c Chi-square test with Yates correction.
r 95% CI R2 p-value
Celiac group (74 patients)
AL-CT − 0.31 − 0.51 to − 0.09 0.10 0.007a
AL-TSA − 0.37 − 0.55 to − 0.16 0.14 0.001a
AL-LSA − 0.36 − 0.54 to − 0.14 0.13 0.002a
AL-SSA − 0.32 − 0.51 to − 0.09 – 0.006b
AL-CVI + 0.03 − 0.20 to + 0.25 0.00062 0.833a
Healthy group (67 patients)
AL-CT − 0.35 − 0.54 to − 0.12 0.12 0.004a
AL-TSA − 0.37 − 0.56 to − 0.14 0.13 0.002a
AL-LSA − 0.37 − 0.56 to − 0.14 0.13 0.002a
AL-SSA − 0.32 − 0.52 to − 0.08 0.10 0.009a
AL-CVI + 0.06 − 0.18 to + 0.30 0.0035 0.635a
Table 2. Correlation between AL and the choroidal parameters in the two study groups. r correlation
coefficient, 95% CI 95% confidence interval, R2 determination coefficient, AL axial length, CT choroidal
thickness, TSA total subfoveal area, LSA luminal subfoveal area, SSA stromal subfoveal area, CVI choroidal
vascularity index. a Pearson correlation. b Spearman correlation.
In addition to the increased subfoveal CT in celiac patients, the present study also showed that all subfoveal
choroidal areas were thicker in these patients than in healthy controls, confirming the findings by Bolukbasi
et al.16. Nevertheless, no statistical significance was found for CVI between the two studied groups.
Since CVI is the ratio of LSA to TSA, the absence of a statistically significant difference between the two
groups could be explained by a proportional increase in all choroidal areas of celiac patients. This may be due
to the simultaneous presence of inflammatory and autoimmune mechanisms, typical of celiac disease, which
determine an increase of all the choroidal components, as already hypothesized in previous studies16–18. In fact,
Scientific Reports | (2021) 11:16398 | https://doi.org/10.1038/s41598-021-95812-y 5
Vol.:(0123456789)www.nature.com/scientificreports/
Figure 3. Scatter plot correlating axial length in the two study groups with: (a) subfoveal choroidal thickness
(b) total subfoveal area. (c) Luminal subfoveal area. (d) Stromal subfoveal area. (e) Choroidal vascularity index.
R2: determination coefficient. ImageJ: http://imagej.nih.gov/ij. GPower: https://www.psychologie.hhu.de/arbei
tsgruppen/allgemeine-psychologie-und-arbeitspsychologie/gpower.html.
Scientific Reports | (2021) 11:16398 | https://doi.org/10.1038/s41598-021-95812-y 6
Vol:.(1234567890)www.nature.com/scientificreports/
Figure 3. (continued)
LSA may be enlarged by the increase of choroidal vessels due to inflammatory response in celiac disease, while
SSA may be increased by the deposition of autoimmune complex in the choroidal stromal tissue. Consequently,
the combined increase in LSA and SSA may lead to an increase in TSA.
Furthermore, in the present study, no significant correlation between disease duration and choroidal param-
eters was found. Probably, the thickness of the subfoveal choroidal areas is related to an immune-mediated altera-
tion, that is not responsive to the gluten-free diet. A similar condition is also known for other abnormalities found
in patients with celiac disease on a gluten-free diet, such as t hyroiditis29, or insulin-dependent d iabetes30. This
could be related to irreversible changes caused by the disease itself, which are not affected by the the gluten-free
diet. However, further studies in naive patients would be needed to better understand the choroidal baseline
status of such subjects, and how it modifies over time.
In the literature, a few studies have evaluated the CT in celiac p atients16–18, but none have evaluated the CVI.
17
Karatepe Hashas et al. evaluated 31 celiac children and 34 controls, performing a SD-OCT examination
including macular thickness, retinal nerve fiber layer measurements, ganglion cell thickness, and choroidal meas-
urements. In detail, in all studied participants CT was measured at 9 points: at subfovea, and 500 μm, 750 μm,
1000 μm, and 1500 μm nasal and temporal to the fovea. However, a statistically significant difference was found
between the celiac group and the control group only for the retinal nerve fiber layer, showing a thinner one in
celiac patients. The authors explained this finding by presuming an underlying autoimmune mechanism related
to autoantibodies with an affinity to retinal nerve tissue.
Bolukbasi et al.16 carried out a study on 70 eyes of 70 patients with celiac disease, comparing them to 70 eyes
of 70 healthy patients. The authors measured AL and performed an EDI SD-OCT evaluation of CT at 7 different
points: at subfovea, and 500 μm, 1000 μm, and 1500 μm nasal and temporal to the fovea. They found no sig-
nificant differences for AL between the two study groups but, contrarily to Karatepe Hashas et al.17, they found
the choroid to be thicker at all predefined measurement points in celiac patients (all p < 0.001). No correlation
between AL and CT was tested. The authors speculated that systemic inflammation in celiac disease causes the
enlargement of choroidal vessels with a subsequent increase in CT.
In a case–control study, Doğan et al.18 analyzed 42 celiac children and 42 age and sex-matched healthy
controls, correlating subfoveal CT measured with EDI SD-OCT to titers of anti-endomysial antibodies and
tissue transglutaminase type 2 antibody, which are used in the diagnosis of celiac disease and following adher-
ence to diet. The authors found that the mean CT of celiac patients was slightly thicker than those of healthy
controls, but without any statistical significance. Furthermore, they found that patients with celiac disease who
were non-adherent to a gluten-free diet had a thinner mean subfoveal CT than celiac patients adherent to a
gluten-free diet. They tried to explain this finding speculating that circulating antibodies may have had a role in
thinning the choroidal layers. Unfortunately, they were unable to prove circulating antibodies within choroidal
Scientific Reports | (2021) 11:16398 | https://doi.org/10.1038/s41598-021-95812-y 7
Vol.:(0123456789)www.nature.com/scientificreports/
microcirculation. Moreover, their data had no sufficient statistical significance, possibly due to the small sample
size of the study, as the authors themselves stated.
Several papers have been published on the correlation between AL and CT in emmetropic and myopic
patients, most of them showing AL to be inversely related to subfoveal CT20,31–35.
Sonoda et al.20 examined a large (7500-μm width) choroidal area of 180 right eyes of 180 healthy volunteers
with an AL range between 21.9 and 27.7 mm, showing no statistically significant correlation between AL and
total choroidal area, luminal area and stromal area. However, the authors found an inverse correlation between
AL and the ratio of the luminal to stromal area, thus considering the luminal area to be more affected by reduc-
tion than the stromal area.
A different structure is hypothesized to be present in long eyes, as reported by Alshareef et al.36, who evaluated
30 eyes with myopia (AL > 25 mm) in comparison to age-matched healthy subjects. The authors demonstrated
statistically significant differences between myopic and healthy eyes in total choroidal area and stromal area
(p < 0.001) but, interestingly, they found no significant differences in vascular area or vessel-to-stroma ratio
between the groups. They considered these differences among the two examined groups attributable to stromal
area modifications rather than to vascular changes.
The present study is the first to evaluate and to correlate the choroidal parameters with AL in patients with
and without celiac disease. In both groups, a statistically significant inverse correlation between AL and subfoveal
CT, TSA, LSA and SSA, but not for CVI, was found.
This study has some limitations. First, subfoveal CT measurements and segmentation method were manually
performed. However, we attempted to reduce this bias, as all the choroidal evaluations were performed by a well-
trained masked examiner. Moreover, macula morphometry could vary with AL, so slightly different choroidal
areas between subjects could have been analyzed.
In addition, this is a monocentric study, so different ethnicities and subjects from larger geographic areas
could have enriched the study findings.
In conclusion, patients with celiac disease showed a thicker choroid than healthy patients, due to a propor-
tional increase in both the vascular and stromal components, which did not change the CVI. This may be linked
to the inflammatory and autoimmune responses related to celiac disease pathophysiology. Nevertheless, further
validations are needed.
Data availability
The datasets generated and analyzed during the current study are available from the corresponding author on
reasonable request.
Received: 24 April 2021; Accepted: 26 July 2021
References
1. Lindfors, K. et al. Coeliac disease. Nat. Rev. Dis. Primers 5, 3. https://doi.org/10.1038/s41572-018-0054-z (2019).
2. Bai, J. C. & Ciacci, C. World Gastroenterology Organisation Global Guidelines: Celiac disease February 2017. J. Clin. Gastroenterol.
51, 755–768 (2017).
3. Ludvigsson, J.F., et al. BSG Coeliac Disease Guidelines Development Group; British Society of Gastroenterology. Diagnosis and
management of adult coeliac disease: Guidelines from the British Society of Gastroenterology. Gut. 63, 1210–1228 (2014).
4. Al Hemidan, A. I., Tabbara, K. F. & Althomali, T. Vogt-Koyanagi-Harada associated with diabetes mellitus and celiac disease in a
3-year-old girl. Eur. J. Ophthalmol. 16, 173–177 (2006).
5. Krifa, F. et al. Uveitis responding on gluten free diet in a girl with celiac disease and diabetes mellitus type 1. Gastroenterol. Clin.
Biol. 34, 319–320 (2010).
6. Malhi, R. K., Dhami, A., Malhi, N. S., Soni, A. & Dhami, G. S. Central retinal vein occlusion revealing celiac disease: The first
report of two cases from India. Indian J. Ophthalmol. 66, 1315–1317 (2018).
7. Mollazadegan, K., Kugelberg, M., Lindblad, B. E. & Ludvigsson, J. F. Increased risk of cataract among 28,000 patients with celiac
disease. Am. J. Epidemiol. 174, 195–202 (2011).
8. Linsenmeier, R. A. & Padnick-Silver, L. Metabolic dependence of photoreceptors on the choroid in the normal and detached retina.
Invest. Ophthalmol. Vis. Sci. 41, 3117–3123 (2000).
9. Alm, A. & Bill, A. Ocular and optic nerve blood flow at normal and increased intraocular pressures in monkeys (Macaca irus): A
study with radioactively labelled microspheres including flow determinations in brain and some other tissues. Exp. Eye Res. 15,
15–29 (1973).
10. Hayreh, S. S. Submacular choroidal vascular pattern. Experimental fluorescein fundus angiographic studies. Albrecht Von Graefes
Arch. Klin. Exp. Ophthalmol. 192, 181–196 (1974).
11. Tan, K. A. et al. State of science: Choroidal thickness and systemic health. Surv. Ophthalmol. 61, 566–581 (2016).
12. Sezer, T., Altınışık, M., Koytak, İA. & Ozdemir, M. H. The choroid and optical coherence tomography. Turk. J. Ophthalmol. 46,
30–37 (2016).
13. Laviers, H. & Zambarakji, H. Enhanced depth imaging-OCT of the choroid: A review of the current literature. Graefes Arch. Clin.
Exp. Ophthalmol. 252, 1871–1883 (2014).
14. Iovino, C. et al. Choroidal vascularity index: An in-depth analysis of this novel optical coherence tomography parameter. J. Clin.
Med. 9, 595. https://doi.org/10.3390/jcm9020595 (2020).
15. Agrawal, R. et al. CVI.grid. Exploring choroidal angioarchitecture in health and disease using choroidal vascularity index. Prog.
Retin. Eye Res. 77, 100829. https://doi.org/10.1016/j.preteyeres.2020.100829 (2020).
16. Bolukbasi, S. et al. Pachychoroid pigment epitheliopathy and choroidal thickness changes in coeliac disease. J. Ophthalmol. 2019,
6924191. https://doi.org/10.1155/2019/6924191 (2019).
17. Karatepe Hashas, A. S. et al. The eyes of children with celiac disease. J. AAPOS 21, 48–51 (2017).
18. Doğan, G. et al. Should we worry about the eyes of celiac patients?. Eur. J. Ophthalmol. 30, 886–890 (2020).
19. Tan, C. S., Ouyang, Y., Ruiz, H. & Sadda, S. R. Diurnal variation of choroidal thickness in normal, healthy subjects measured by
spectral domain optical coherence tomography. Invest. Ophthalmol. Vis. Sci. 53, 261–266 (2012).
20. Sonoda, S. et al. Luminal and stromal areas of choroid determined by binarization method of optical coherence tomographic
images. Am. J. Ophthalmol. 159, 1123-1131.e1 (2015).
Scientific Reports | (2021) 11:16398 | https://doi.org/10.1038/s41598-021-95812-y 8
Vol:.(1234567890)www.nature.com/scientificreports/
21. Agrawal, R. et al. Choroidal vascularity index as a measure of vascular status of the choroid: Measurements in healthy eyes from
a population-based study. Sci. Rep. 6, 21090. https://doi.org/10.1038/srep21090 (2016).
22. Agrawal, R. et al. Choroidal vascularity index (CVI)—A novel optical coherence tomography parameter for monitoring patients
with panuveitis?. PLoS ONE 11, 146344. https://doi.org/10.1371/journal.pone.0146344 (2016).
23. Faul, F., Erdfelder, E., Lang, A. G. & Buchner, A. G*Power 3: A flexible statistical power analysis program for the social, behavioral,
and biomedical sciences. Behav. Res. Methods 39, 175–191 (2007).
24. Fousekis, F. S., Katsanos, A., Katsanos, K. H. & Christodoulou, D. K. Ocular manifestations in celiac disease: An overview. Int.
Ophthalmol. 40, 1049–1054 (2020).
25. Giannaccare, G. et al. Choroidal vascularity index quantification in geographic atrophy using binarization of enhanced-depth
imaging optical coherence tomographic scans. Retina 40, 960–965 (2019).
26. Iovino, C. et al. Evaluation of the choroid in eyes with retinitis pigmentosa and cystoid macular edema. Invest. Ophthalmol. Vis.
Sci. 60, 5000–5006 (2019).
27. Shin, Y. U. et al. Evaluation of changes in choroidal thickness and the choroidal vascularity index after hemodialysis in patients
with end-stage renal disease by using swept-source optical coherence tomography. Medicine 98, e15421. https://doi.org/10.1097/
MD.0000000000015421 (2019).
28. De Bernardo, M., Altieri, V., Coppola, A., Gioia, M. & Rosa, N. Choroidal evaluation in patients under alphalytic therapy. Graefes
Arch. Clin. Exp. Ophthalmol. 258, 2729–2736 (2020).
29. Metso, S. et al. Gluten-free diet and autoimmune thyroiditis in patients with celiac disease. A prospective controlled study. Scand.
J. Gastroenterol. 47, 43–48 (2012).
30. Bakker, S. F., Tushuizen, M. E., von Blomberg, M. E., Mulder, C. J. & Simsek, S. Type 1 diabetes and celiac disease in adults: glycemic
control and diabetic complications. Acta Diabetol. 50, 319–324 (2013).
31. Liu, B. et al. Correlation of subfoveal choroidal thickness with axial length, refractive error, and age in adult highly myopic eyes.
BMC Ophthalmol. 18, 127. https://doi.org/10.1186/s12886-018-0791-5 (2018).
32. Bulut, A., Öner, V., Büyüktarakçı, Ş & Kaim, M. Associations between choroidal thickness, axial length and spherical equivalent
in a paediatric population. Clin. Exp. Optom. 99, 356–359 (2016).
33. El-Shazly, A. A., Farweez, Y. A., ElSebaay, M. E. & El-Zawahry, W. M. A. Correlation between choroidal thickness and degree of
myopia assessed with enhanced depth imaging optical coherence tomography. Eur. J. Ophthalmol. 27, 577–584 (2017).
34. Ulaganathan, S., Read, S. A., Collins, M. J. & Vincent, S. J. Daily axial length and choroidal thickness variations in young adults:
Associations with light exposure and longitudinal axial length and choroid changes. Exp. Eye Res. 189, 107850. https://doi.org/10.
1016/j.exer.2019.107850 (2019).
35. De Bernardo, M. et al. Biometric parameters and corneal astigmatism: Differences between male and female eyes. Clin. Ophthalmol.
14, 571–580 (2020).
36. Alshareef, R. A. et al. Subfoveal choroidal vascularity in myopia: Evidence from spectral-domain optical coherence tomography.
Ophthalmic Surg. Lasers Imaging Retina 48, 202–207 (2017).
Author contributions
N.R. and C.C. conceived the study. M.D.B. wrote the original draft. L.V., M.B. and F.M. performed data acquisi-
tion and analysis. C.I. and L.C. interpreted the data. All authors reviewed and approved the manuscript.
Competing interests
The authors declare no competing interests.
Additional information
Correspondence and requests for materials should be addressed to M.D.B.
Reprints and permissions information is available at www.nature.com/reprints.
Publisher’s note Springer Nature remains neutral with regard to jurisdictional claims in published maps and
institutional affiliations.
Open Access This article is licensed under a Creative Commons Attribution 4.0 International
License, which permits use, sharing, adaptation, distribution and reproduction in any medium or
format, as long as you give appropriate credit to the original author(s) and the source, provide a link to the
Creative Commons licence, and indicate if changes were made. The images or other third party material in this
article are included in the article’s Creative Commons licence, unless indicated otherwise in a credit line to the
material. If material is not included in the article’s Creative Commons licence and your intended use is not
permitted by statutory regulation or exceeds the permitted use, you will need to obtain permission directly from
the copyright holder. To view a copy of this licence, visit http://creativecommons.org/licenses/by/4.0/.
© The Author(s) 2021
Scientific Reports | (2021) 11:16398 | https://doi.org/10.1038/s41598-021-95812-y 9
Vol.:(0123456789)You can also read