Citi's 2020 Global Property CEO Conference - March 2-4, 2020
←
→
Page content transcription
If your browser does not render page correctly, please read the page content below
A view toward downtown and multiple covered
                                                                   Prologis
                                                                        landPark
                                                                              plays
                                                                                 Wroclaw
                                                                                    in San Francisco,
                                                                                           III, Wroclaw,
                                                                                                      California
                                                                                                         Poland

Citi’s 2020 Global Property CEO Conference

March 2-4, 2020
Forward-looking statements
This presentation includes certain terms and non-GAAP financial measures that are not specifically defined herein. These terms and financial measures are
defined and, in the case of the non-GAAP financial measures, reconciled to the most directly comparable GAAP measure, in our fourth quarter Earnings Release
and Supplemental Information that is available on our investor relations website at www.ir.prologis.com and on the SEC’s website at www.sec.gov.

The statements in this document that are not historical facts are forward-looking statements within the meaning of Section 27A of the Securities Act of 1933,
as amended, and Section 21E of the Securities Exchange Act of 1934, as amended. These forward-looking statements are based on current expectations,
estimates and projections about the industry and markets in which we operate as well as management's beliefs and assumptions. Such statements involve
uncertainties that could significantly impact our financial results. Words such as "expects," "anticipates," "intends," "plans," "believes," "seeks," and
"estimates," including variations of such words and similar expressions, are intended to identify such forward-looking statements, which generally are not
historical in nature. All statements that address operating performance, events or developments that we expect or anticipate will occur in the future —
including statements relating to rent and occupancy growth, development activity, contribution and disposition activity, general conditions in the geographic
areas where we operate, our debt, capital structure and financial position, our ability to form new co-investment ventures and the availability of capital in
existing or new co-investment ventures — are forward-looking statements. These statements are not guarantees of future performance and involve certain
risks, uncertainties and assumptions that are difficult to predict. Although we believe the expectations reflected in any forward-looking statements are based
on reasonable assumptions, we can give no assurance that our expectations will be attained and, therefore, actual outcomes and results may differ materially
from what is expressed or forecasted in such forward-looking statements. Some of the factors that may affect outcomes and results include, but are not limited
to: (i) national, international, regional and local economic and political climates; (ii) changes in global financial markets, interest rates and foreign currency
exchange rates; (iii) increased or unanticipated competition for our properties; (iv) risks associated with acquisitions, dispositions and development of
properties; (v) maintenance of real estate investment trust status, tax structuring and changes in income tax laws and rates; (vi) availability of financing and
capital, the levels of debt that we maintain and our credit ratings; (vii) risks related to our investments in our co- investment ventures, including our ability to
establish new co-investment ventures; (viii) risks of doing business internationally, including currency risks; (ix) environmental uncertainties, including risks of
natural disasters; and (x) those additional factors discussed in reports filed with the Securities and Exchange Commission by us under the heading "Risk
Factors." We undertake no duty to update any forward-looking statements appearing in this document except as may be required by law.

This document shall not constitute an offer to sell or the solicitation of an offer to buy any securities, nor shall there be any sale of securities in any jurisdiction
in which such offer, solicitation or sale would be unlawful prior to registration or qualification under the securities laws of any such jurisdiction. No offering of
securities shall be made except by means of a prospectus meeting the requirements of Section 10 of the U.S. Securities Act of 1933, as amended.

                                                                                                                                                                      2
Contents

01   Points of Focus                      04

02   Why Logistics Real Estate            10

03   Why Prologis                         18

04   Prologis ESG: Ahead of What’s Next   31

                                               Prologis International Park of Commerce, Tracy, California

                                                                                                            3
Prologis Park Torrance, Torrance, California   Prologis Park San Leandro, San  Leandro, California
                                                                        Prologis Park Dunstable,
                                                                                 Prologis I-17,   Dunstable,
                                                                                                Phoenix,      UK
                                                                                                         Arizona

01

Points of Focus

                                                                                                                   4
A compelling investment opportunity

EMBEDDED GROWTH:

Global in-place-to-market of over 15.5% – harvesting NOI* from rolling leases

Development stabilizations – unlocking NOI* from completed development projects and those under construction

Ready to build land bank of $10B TEI – generating NOI* from build out of existing land bank

LTV capacity – possibility to fund value-added opportunities, every 100 bps leverage = 1% Core FFO* growth

Growth initiatives – scale provides ability to create value beyond the real estate

                       *This is a non-GAAP measure                                                           5
Superior earnings and dividend growth

CORE FFO* PER SHARE CAGR                                                   1-YEAR                         3-YEAR                       5-YEAR               Prologis has:
                                                                                                                                                            Best Core FFO* CAGR for
PLD (excluding promotes)                                                       9%                         10%                           12%                 the five-year time period
Other Logistics REITs1                                                          6%                             4%                            5%
Blue Chips2                                                                     5%                             6%                            7%             Prologis has:

REIT Average3                                                                   5%                             7%                            6%             Top Dividend CAGR
                                                                                                                                                            for the one, three, and
S&P 500 Average4                                                              23%                            11%                             8%
                                                                                                                                                            five-year time periods
                                                                                                                                                            Over the three-year time
Dividend CAGR                                                               1-YEAR                         3-YEAR                       5-YEAR              period, Prologis reduced
                                                                                                                                                            leverage by 700 bps and
PLD                                                                            9%                            8%                         11%                 achieved an A3/A-rating5
Other Logistics REITs1                                                          3%                             2%                            3%
Blue Chips2                                                                     6%                             7%                            9%
REIT Average3                                                                   6%                             6%                            7%
S&P 500 Average4                                                                7%                             7%                          10%

                           *This is a non-GAAP financial measure
                           Source: FactSet; Core FFO and Dividend growth through December 31, 2018
                           1. Includes DRE, EGP, FR, LPT and STAG. LPT 2018 FFO has been adjusted to exclude one-time items. Weighted on market cap as of December 31, 2018
                           2. Includes AVB, BXP, EQR, FRT, HST, PSA, and SPG. Weighted on market cap as of December 31, 2018
                           3. Includes REITs in the RMZ as of 12/31/2018 with data for every year in each respective period; weighted on market cap as of December 31, 2018
                           4. Source: SP500 per FactSet
                           5. A securities rating is not a recommendation to buy, sell or hold securities and is subject to revision or withdrawal at any time by the rating agency   6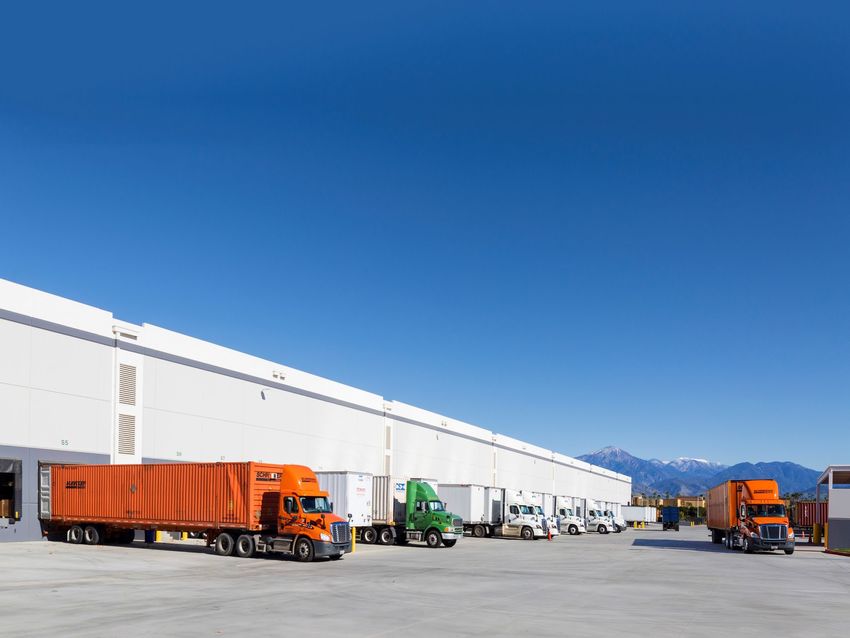
Strong Organic Growth and Returns

                                                  2017-2020                            2017-2019                               2020         2020-2022
                                                  FORECAST                               ACTUAL                           GUIDANCE2         FORECAST

   Core FFO1                                       7-8%                                  9.3%                            14.1%              8-9%
   Dividend
   Yield                                                   3%                            2.9%                                 2.5%          2.5%

   TOTAL                                  10-11%                                    12.1%                                16.6%        10.5-11.5%3

1. Excludes promotes
2. Midpoint of guidance
3. Illustrative, based on a number of assumptions that Prologis believes to be reasonable, however, no assurance can be made that
   Prologis’ expectations will be attained and there are actual outcomes and results that may differ materially                                         7
Top-rated financial position
A3/A- rated by Moody’s/S&P1

 PROLOGIS DEBT METRICS                                                                                                              Q4 2019                 Prologis manages its
                                                                                                                                                            balance sheet to:

 Debt as % of Gross Market Cap*                                                                                           18.3%                             • Low leverage

                                                                                                                                                            • High liquidity
 Debt / Adjusted-EBITDA*                                                                                                         4.0X
                                                                                                                                                            • Low near-term
                                                                                                                                                              maturities
 Fixed Charge Coverage Ratio*                                                                                                    9.8X
 USD Net Equity Exposure                                                                                                          94%
 Liquidity                                                                                                                 $4.8B

                         * This is a non-GAAP financial measure
                         1. A securities rating is not a recommendation to buy, sell or hold securities and is subject to revision or withdrawal at any time by the rating agency   8
$10B of internal capacity to fund growth1

ANNUAL CAPITAL SOURCES                                                  ANNUAL CAPITAL USES                                                              Significant investment
Millions                                                                Millions                                                                         capacity to self fund
                                                                                                                                                         without the need to
Contribution Proceeds                                $1,325             Development Spend                                              $2,000            issue equity
Retained Cash Flow                                                      Acquisitions
                                                        $275                                                                             $100
(from Core Operations)                                                  (via co-investment ventures)                                                     We have not issued
Leverage Capacity                                                                                                                                        equity through a
                                                        $165
(on Value Creation)                                                                                                                                      follow-on offering or
                                                                                                                                                         through our ATM since
Total Annual Capital Sources                         $1,765             Total Annual Capital Uses                                      $2,100
                                                                                                                                                         Q1 2015

ONE-TIME CAPITAL SOURCES                                                Total Annual
Millions                                                                Funding Requirement                                         $335M

Open-End Funds Capacity                             $2,2502

                                                                                   +10 years
Joint Venture Capacity                              $4,2502

Balance Sheet Capacity                               $4,000
                                                                                    of anticipated funding
Total Additional Capital Sources                    $10,500                         requirements from
                                                                                    one-time capital sources

                               1. Illustrative, based on estimated annual pro rata share run-rate deployment for 2020 and beyond
                               2. Includes reduction in our ownership interest in our PELF and USLF ventures down to 15% and our PELP and USLV ventures down to 20%               9
Tokyo, Japan

02

Why Logistics Real Estate

                                           10
Diverse demand drivers
CYCLICAL SPENDING BASIC DAILY NEEDS STRUCTURAL TRENDS
• Auto parts • Food & beverage • E-commerce
• Construction • Apparel • Transportation
• Home goods / appliances • Fast-moving consumer goods • Healthcare
Source: Prologis Research
Note: Graphics represent approximate share of logistics space occupied globally 11Supply chain modernization essential for competitiveness
“As we approach the end of the second year of investment geared at achieving our One Home Depot
vision, we are confident that we are making the right investments for the business to extend our
competitive advantage over the long term.” – Richard V. McPhail, CFO & Executive VP (Q3 2019 Earnings
Call)
“It’s about more speed, more efficiency and higher quality. We are going to keep making these
investments as e-commerce grows.” – Lee Spratt, CEO (Freightwaves.com, Dec 1, 2018)
“If you're not evolving your fulfillment options, you're certainly losing ground to the competition. Speed is
essential.” – Robert L. Bass, Chief Supply Chain Officer (Investor Update Meeting Sept 25, 2019)
“We have a backlog of blue-chip customers hungry to get access to … contract logistics, last mile,
labor, technology, transportation and the storage capabilities of XPO Direct.” – Brad Jacobs, CEO
(Q4 2018 earnings call)
"Our previous investments in fulfillment centers and systems, plus our acquisitions, are helping us
drive strong sales but we need to make more progress to improve profitability.” – Doug McMillon,
CEO (Q4 2019 earnings call)
12Rising value of time
DEFINITION OF FAST SHIPPING TIME SPENT IN TRAFFIC DELAYS
Respondents who view 3-4 days as too slow, % Annual hours per commuter
90
80
70
60
67
65
62
58 50
40
37 30
20
10
-
2015 2016 2017 2018 2019 1982 90 00 10 17
Source: Deloitte, Prologis Research Source: Texas A&M Transportation Institute, Prologis Research
13Future direction of supply chain creates margin
DISTRIBUTION OF SUPPLY CHAIN COSTS
%
Transportation 45-55
1%
Cost savings in
transportation or labor
Labor 25-30
=
Inventory Costs 20-25 ~15%
spend on logistics
real estate
Rent ~5
Source: Deloitte, AT Kearney, IMS Worldwide, public company filings, Prologis Research 14Value Beyond the Real Estate
Total supply chain costs - traditional
TOTAL COSTS
x 800MSF
100%
SPEND PER SQUARE FOOT
80%
Transportation $60
60%
Labor $42
40%
= +$100B
Inventory $18
20% Other Operating Costs $ 6 Total supply chain
costs within the
Prologis platform
0% Rent $ 6
Source: Estimates compiled from CSCMP report prepared by AT Kearney, IMS Worldwide, public company filings, and Prologis Research 15Outsized rent growth
Rent growth gradient
RENTAL RATE PREMIUM, INTRA-CITY DIFFERENCES: HIGH-BARRIER-TO-ENTRY MARKETS
Indexed to 50 miles from city center
6.0
5.0
4.0
3.0
2.0
1.0
0.0
100 90 80 70 60 50 40 30 20 10 0
Source: Prologis Research
Note: Prologis’ infill premium is defined as the market rental rate in the given submarket divided by the market rental rate for 50 miles from city center.
Includes the market rents at the submarket level of ten major consumption markets 16Logistics rental rate history
MARKET RENTS, GLOBAL • The structural decline
Index, 1998 = 100 (%) of cap rates mitigated
rent growth
160 10
• Inflation-adjusted
market rents well
9
140 below the prior peak
8
120
7
100
6
80 5
4
60
3
40
2
20
1
0 0
1998 99 00 01 02 03 04 05 06 07 08 09 10 11 12 13 14 15 16 17 18 19
Inflation-Adjusted Market Rent (L) Nominal Market Rent (L) House Cap Rate (R)
Note: Global based upon Prologis share of NOI by geography, specifically 78% Americas, 18% Europe, 3% Japan and 1% China. Estimates of inflation-
adjusted market rents based on IMF historical inflation data and Prologis Research estimates of historical Prologis share of NOI by geography; cap rates
shown represent core assets in the top markets of each region, stabilized to 95% occupancy and are adjusted for the amortization of the ground lease
and free rent. 2019 cap rate reflects 4Q house view and not year-end forecast.
Source: CBRE, JLL, Cushman & Wakefield, Prologis Research 17Prologis Park South San Francisco, South San Francisco, California
03
Why Prologis
18Prologis at a glance
1983
Founded
100 GLOBAL
Most sustainable corporations
PLD NYSE
S&P 500 member
$118 B
Assets under management
964 MSF
On four continents
A3/A-
Credit rating
Note: A securities rating is not a recommendation to buy, sell or hold securities and may be subject to revision or withdrawal at any time
Data as of December 31, 2019 and inclusive of the IPT acquisition on January 8, 2020 and the LPT acquisition on February 4, 2020 (with the exception of
AUM which is as of December 31, 2019.
19
Prologis Park Ichikawa 1, Tokyo, JapanPrologis is a critical waypoint for the global economy
$2.1 TRILLION
Is the economic value of goods flowing
3.5%
of GDP for the 19 countries
2.5%
of the World’s GDP
through our distribution centers each where we do business, and
year, representing
857 K
Employees under Prologis’ roofs
20
Prologis Park Redlands, Redlands, California
Source: Oxford Economics, IMF, Prologis Research as of December 31, 2019. Includes LPT and IPT.Diversity of customers and segments mitigates risk
Diverse by customer and industry
CUSTOMER ACTIVITY IN BUILDING TYPE OF GOODS IN BUILDING Our top 25 customers
%, Net Rentable Area basis (NRA) %, NRA basis represent just
90
80
Consumer Goods
Food
20%
of net effective rent
Transport
70 E-commerce
Appliances
60 General Retailer
Clothing
50
Construction
40
Auto
30 Paper/Packaging
Home Goods
20
Industrial/Commodities
10
Healthcare
0 Data, other
Manufacturing Transport / Freight Distribution
0 2 4 6 8 10
Source: Prologis Research as of December 31, 2019
Note: Based upon internal Prologis data. The Type of Goods in Building classifications do not sum to 100%. The balance, 17%, is attributable to units
where 3PL customers have more than one industry type present 21Strong NPS Correlates With:
• 4-8% more revenue
growth than market
average
B2B Averages 2019 NPS = 52
• Higher retention
Banking
and loyalty
Commercial RE
• Growing insensitivity Construction
toward price Insurance
-10 0 10 20 30 40 50 60 70 80 90
Data: Bain & Company 2018, Prologis October 2019, ClearlyRated, Inc. 2019 NPS® Benchmarks for B2B Service Industries and Customer Guru 22A new lexicon: property categories
Greater New York City
Central PA
Gateway
Multi-Market
City
Last Touch®
Source: Prologis Research, U.S. Census, ESRI 23Rising importance of locations
Portfolio construction for the future of supply chains
Gateway Multi-Market City Last Touch®
High-Barrier
PLD Others PLD Others PLD Others PLD Others
18% 16% 7% 7% 17% 6% 29% 17%
Lower-Barrier
PLD Others PLD Others PLD Others
4% 8% 11% 21% 15% 25%
Sources: SEC filings, Prologis Research
Note: Distributed by value. Prologis portfolio and other logistics REITs includes DRE, EGP, FR, LPT, REXR, STAG, and TRNO as of September 30, 2019 24Significant Embedded NOI Drives SSNOI* Growth
Potential rent change on rollover
IPTM1 of 15.5% = Rent change on rollover >18%
POTENTIAL SAME STORE NOI2 RANGE
40% RANGE
32% 32% Average Rent
29% Change 23% 31%
30% 27%
Annual NOI-Based
Churn 16% 16%
NOI Growth from
20% Rent Change 3.75% 5.00%
Reserve for
Occupancy Loss (0.25%) (0.50%)
10%
Same Store
0%
2019 2020 2021 2022
NOI Growth 3.5% 4.5%
Without Future Market Rent Growth With 4% Future Market Rent Growth
1. IPTM—In-place-to-market on net effective
2. Net effective
* This is a non-GAAP financial measure 25Value Creation Drives Core Growth
POTENTIAL ADDITIONS TO CORE GROWTH
$500M
$500M
x 20%
Margin Investment yield x 6%
$2.5B
NOI = $30M
$2.5B $3.0B Annual FFO
Growth 1.5%
Prologis Investment
REINVESTED
26Scale – growing profitability
MANAGEMENT FEES AND EXPENSES1 3RD PARTY ASSETS UNDER MANAGEMENT POTENTIAL ANNUAL SCALE BENEFIT
NOI Growth Exceeding
$350 $45,000
G&A Growth by 1-2% 0.25%
18% FEE $40,000 13% AUM
$300 GROWTH CAGR GROWTH CAGR
Increased fees from
Contributions 0.25%
$35,000
$250 Fees from Asset Value
$30,000 growth 0.50%
$200 $25,000 Subtotal from Scale 1.0%
$150 $20,000 Prologis Essentials 0.50%
$15,000
$100
$10,000 Total Scale Benefits 1.5%
$50
$5,000
$0 $0
2011 2014 2016 2018 2019 2011 2014 2016 2018 2019
Fees Expenses 3rd Party Assets Under Management
1. Includes asset and property management fees and expenses - Q4 annualized numbers for each respective period except 2019 27Value Beyond the Real Estate
Current and future opportunities
Digital &
Data Solutions
Transportation
Solutions
Real Estate
$150M
Revenue opportunity
Labor
Solutions
28Annual leverage neutral debt capacity
RETAINED OPERATING DEVELOPMENT EMBEDDED GROWTH POTENTIAL ANNUAL EARNINGS FROM
CASH FLOW VALUE CREATION IN VALUES1 LEVERAGE NEUTRAL DEBT CAPACITY
$300 million $500 million $2.75 billion Leverage Neutral Debt
before gains Capacity $710M
Investment Spread 3.0%
Potential Earnings $20M
Creates $60M of Creates $100M of Creates $550M of Addition to Growth 1.0%
Debt Capacity Debt Capacity Debt Capacity
Interest Savings2 0.5%
Total Growth 1.5%
$710 million of annual debt capacity
1. Assumes 4% annual property appreciation
2. Estimates the current annual savings from expected refinancing rates over the next three years 29Strong organic growth and returns
Illustrative potential 2020-2022
Net Effective SSNOI* 3.5-4.5%
Value Creation Drives Core Growth + 1.5%
Scale + 1.5%
Additional Cash Flow and Maintaining Debt Capacity + 1.5%
Core FFO* Growth Excluding Promotes = 8.0-9.0%
Dividend Yield + 2.5%
Annual Total Return = 10.5-11.5%
*Non-GAAP financial measure
Illustrative, based on a number of assumptions that Prologis believes to be reasonable, however, no assurance can be made that Prologis’ expectations
will be attained and there are actual outcomes and results that may differ materially 30Prologis RFI DIRFT DC, Rugby, UK
04
Prologis ESG: Ahead of What’s Next
31ESG Objectives
PROGRESS (2015-2019) GOALS
Certifications1 218% 100% (design standards)
Solar2 46% 400MW by 2025
Cool Roofs3 30% 100% of portfolio
Efficient Lighting4 15% 100% LED
Hours Benefiting the Community 24%5 75,000 by 2025
Note: All numbers are as of December 31, 2019 and cover the global portfolio
1. 100% of new developments are designed with a goal of certification
where appropriate and recognized sustainability rating systems are
available.
2. The generating capacity of solar installations is measured in megawatts
(MW), 212 MWs is the equivalent energy to power nearly 33,000 homes
for a year.
3. Goal is to install cool roofing at 100 percent of new developments and
property improvements, where feasible and appropriate, given climate
factors.
4. Prologis defines efficient lighting as T5 or T8 fluorescent and LED. Going
forward, Prologis will install LED lighting in all new buildings, and retrofit
existing buildings with LED lighting. Prologis International Park of Commerce,
5. Growth between 2018 and 2019 32
Tracy, CaliforniaTop-25 corporate solar installers by installed on-site solar
capacity (MW)
MW
Target
Walmart
Prologis
Prologis U.S.*
Apple
Amazon
Brookfield Properties Retail Inc.
IKEA
Macys
Kohls
Costco Wholesale
GGP Inc
Hartz Mountain
ALDI
Bed Bath and Beyond
Intel
FedEx
Home Depot
Johnson & Johnson
Toyota
Staples
Campbell Soup Co.
LOreal
Walgreens
McGraw-Hill Companies
Verizon
Source: Solar Energy Industries Association (SEIA); “2018 Solar Means Business Report”, July 2019
* As of Year-End 2018 and only in the U.S.; the global total for installed capacity by Prologis as of Year-End 2018 was 186 MW of installed capacity 33Prologis Labor Solutions
PROLOGIS
REAL ESTATE
SOLUTIONS
CUSTOMERS SERVED NGO PARTNERS • Develops targeted
PROLOGIS
training for logistics
COMMUNITY industry careers
WORKFORCE
• Furthers relationships
INITIATIVE Prologis Trade & Logistics Lab
with city agencies to
assist with entitlements
• Enhances local
economies and
community
34Building the Future
• #1 real estate company / #6 in U.S. / #26 overall (2020 Global 100 Most Sustainable
Corporations)
• #1 industrial real estate company in the Americas and Asia (GRESB)
• #3 in corporate solar installations in the U.S.1
• First WELL2 certified logistics facilities in Europe / U.S.
• First logistics real estate company to set a Science Based Target (SBT)
1. Measured by installed onsite solar capacity by Solar Energy Industry Association’s (SEIA) Solar Means Business Report 2018
2. The WELL Building Standard® is a performance-based system for measuring, certifying, and monitoring features of the built
environment that impact human health and well-being, through air, water, nourishment, light, fitness, comfort, and mind. Prologis iPort, Carteret, New35
JerseyYou can also read