CITY OF ORLANDO Impact Fee Study - August 2014
←
→
Page content transcription
If your browser does not render page correctly, please read the page content below
C IT Y O F O RLA ND O
     I m p a c t Fe e S tu dy
                   August 2014
                        DRAFT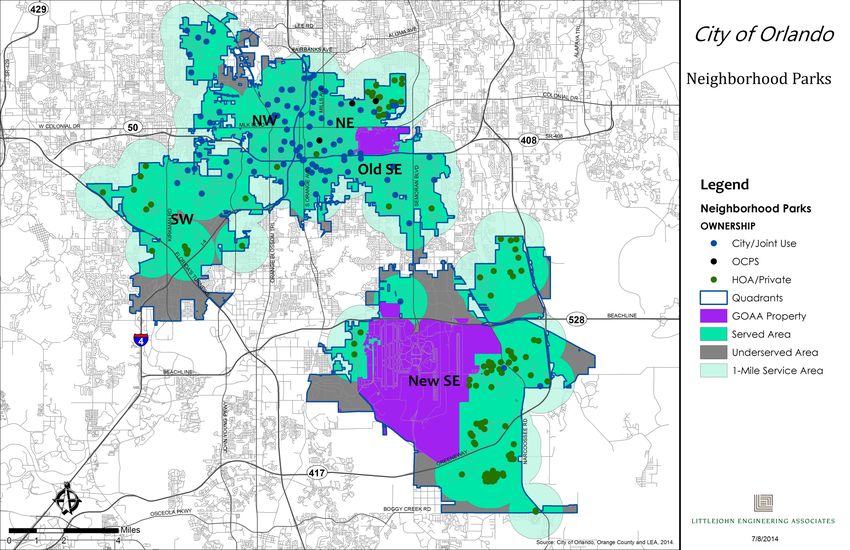
City of Orlando

Families, Parks and Recreation Impact Fee Study

            Littlejohn Project No.: 20131179

                        DRAFT

                     August 2014

                     Prepared for:

                   City of Orlando
          Economic Development Department
                  Planning Division
               400 S. Orange Avenue
               Orlando, Florida 32802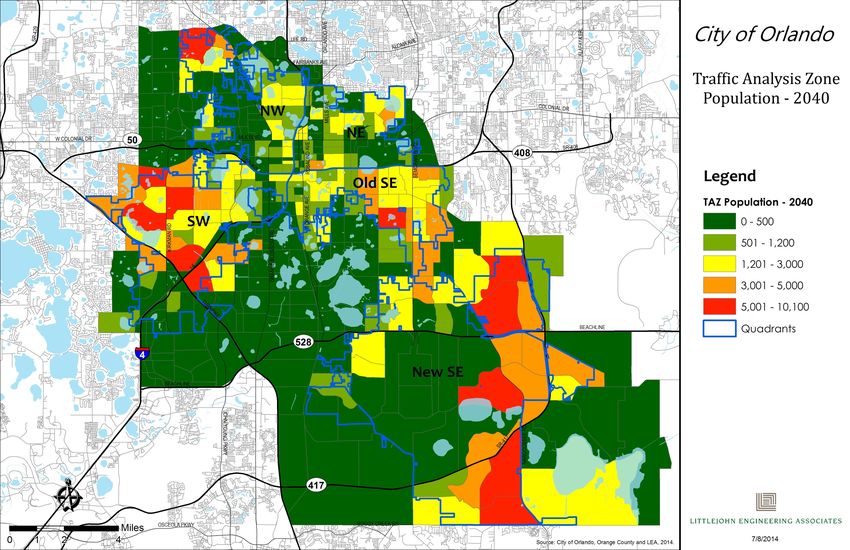
City of Orlando
Families, Parks and Recreation Impact Fee Study

Table of Contents

I.   Executive Summary ........................................................................................................... 1
II. Population Growth and Trends.......................................................................................... 5
     A. Orlando’s Current Population ......................................................................................... 5
     B. Orlando’s Future Population ........................................................................................... 6
     C. Population Growth Summary........................................................................................ 14
III. Parks and Recreation Service Standards ....................................................................... 15
     A. Acreage Standards ........................................................................................................ 16
          1. Current Deficiencies- Acreage Standard ............................................................. 19
     B. Accessibility Standards .................................................................................................. 19
          1. Accessibility Standard-Regional Parks ................................................................... 23
          2. Accessibility Standard-Community Parks .............................................................. 25
          3. Accessibility Standard-Neighborhood Parks ........................................................ 30
          4. Costs to Provide Facility to Underserved Areas (Facility Access) ...................... 31
     C. Park and Facility Capacity Standards ......................................................................... 34
          1. Existing Capacity Needs .......................................................................................... 35
IV. Future Park and Facility Needs and Costs ..................................................................... 38
     A. Future Park and Facility Needs ..................................................................................... 38
          1. Acreage Standards .................................................................................................. 38
          2. Accessibility Standards ............................................................................................ 39
          3. Park and Facility Capacity Standards ................................................................... 43
     B. Future Parks and Facilities Costs ................................................................................... 46
V. Identification of Appropriate Funding Mechanism ....................................................... 49
     A. Standards-Based (LOS) Impact Fee............................................................................. 49
          1. Credit Components ................................................................................................. 50
          2. Debt Service Credit .................................................................................................. 53
     B. Improvement Based Impact Fee ................................................................................. 57
     C. Quadrant Based Impact Fee........................................................................................ 57
     D. Impact Fee Implementation ......................................................................................... 58
VI. Appendix A Parks and Recreation Facilities Service Areas ......................................... 59
VII. Appendix B List of Existing Parks and Facilities, Locations, Acreage and Quadrant . 60

                                                                                                                         i|Page
Revised Draft [8/22/2014]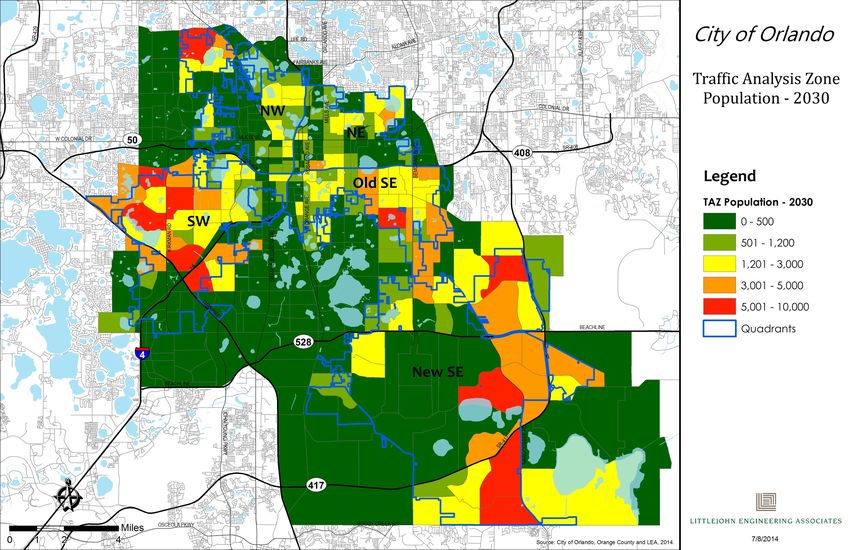
City of Orlando
Families, Parks and Recreation Impact Fee Study

VIII.      Appendix C Spatial Constraint Park Design Analysis .............................................. 63
IX. Appendix D Park Replacement Cost Estimates............................................................. 69
Regional Park Cost Estimates................................................................................................ 70
Community Park Cost Estimates ........................................................................................... 71
Neighborhood Park Cost Estimates ...................................................................................... 74
Other Park Facility Cost Estimates ........................................................................................ 75
X. Appendix E Improvements-Based Fee by Quadrant .................................................... 77
XI. Appendix F Impact Fee Comparison ............................................................................. 78

List of Tables
Table 1: Impact Fee Summary Table ......................................................................................... 3
Table 2: Potential Future Impact Fee Revenue Scenarios Table ........................................... 4
Table 3: Orlando Population Projections 2013-2040 .............................................................. 14
Table 4: 2014 Citywide Actual Park Levels of Service ........................................................... 17
Table 5: Parks and Facilities Service Areas (Radii) ................................................................. 20
Table 6: Costs to Provide Parks to Underserved Areas (Facility Access) ............................ 31
Table 7: Costs to Provide Facilities to Underserved Areas (Facility Access) ....................... 32
Table 8: Population Served Per Facility Type .......................................................................... 34
Table 9: Population Served Per Facility Type .......................................................................... 34
Table 10: Existing Capacity Needs (Capacity Standards) ................................................... 35
Table 11: Existing Capacity Costs by Quadrant (Capacity Standards) ............................. 36
Table 12: Future Park Need/Cost by Quadrant (Adopted LOS Standards) ...................... 39
Table 13: Park Accessibility Needs ........................................................................................... 40
Table 14: Future Facility Accessibility Needs ........................................................................... 41
Table 15: Park Needs by Capacity .......................................................................................... 43
Table 16: Future Facility Needs by Capacity .......................................................................... 44
Table 17: Future Park Cost by Capacity .................................................................................. 46
Table 18: Facilities Cost by Capacity ....................................................................................... 47
Table 19: Facility, Equipment and Land Replacement Costs & Total Impact Cost per
Resident ....................................................................................................................................... 50
Table 20: Parks and Recreation Capital Improvement Projects Credit .............................. 51
Table 21: CIP Credit per Unit ..................................................................................................... 53
Table 22: Parks and Recreation Debt Service Credit ............................................................ 55
Table 23: Debt Service Credit per Unit .................................................................................... 55
Table 24: Combined Credit per Unit ........................................................................................ 56
Table 25: Net Parks and Recreation Impact Fee Cost per Resident (Standards-Based) . 56
Table 26: Parks and Facilities Cost per Future Resident......................................................... 57
Table 27: Net Parks and Recreation Impact Fee Cost per Residential Unit
(Improvements-Based) .............................................................................................................. 57

                                                                                                                                    ii | P a g e
Revised Draft [8/22/2014]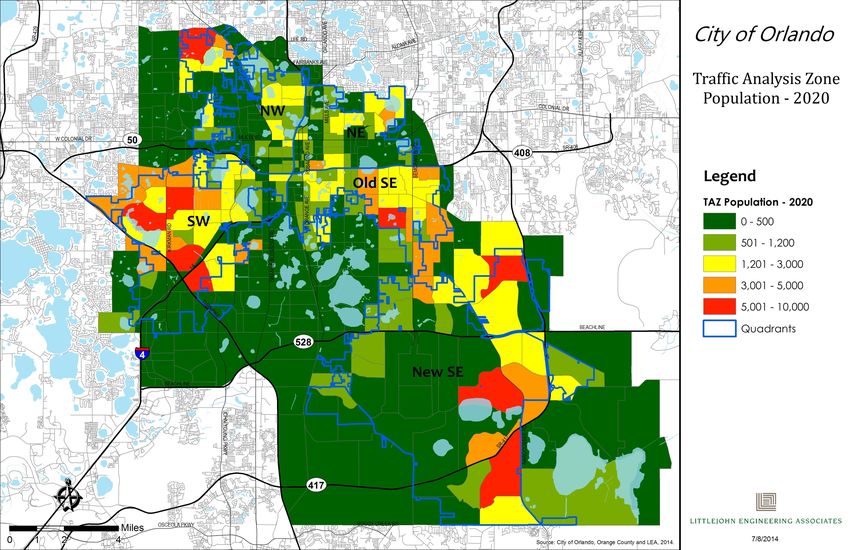
City of Orlando
Families, Parks and Recreation Impact Fee Study

List of Maps
Map 1: City of Orlando Population 2013 by TAZ ...................................................................... 7
Map 2: City of Orlando Population 2020 by TAZ ...................................................................... 9
Map 3: City of Orlando Population 2030 by TAZ .................................................................... 11
Map 4: City of Orlando Population 2040 by TAZ .................................................................... 13
Map 5: Regional Parks Service Areas ...................................................................................... 22
Map 6: Community Parks Service Areas ................................................................................. 24
Map 7: Neighborhood Parks Service Areas ............................................................................ 26

                                                                                                               iii | P a g e
Revised Draft [8/22/2014]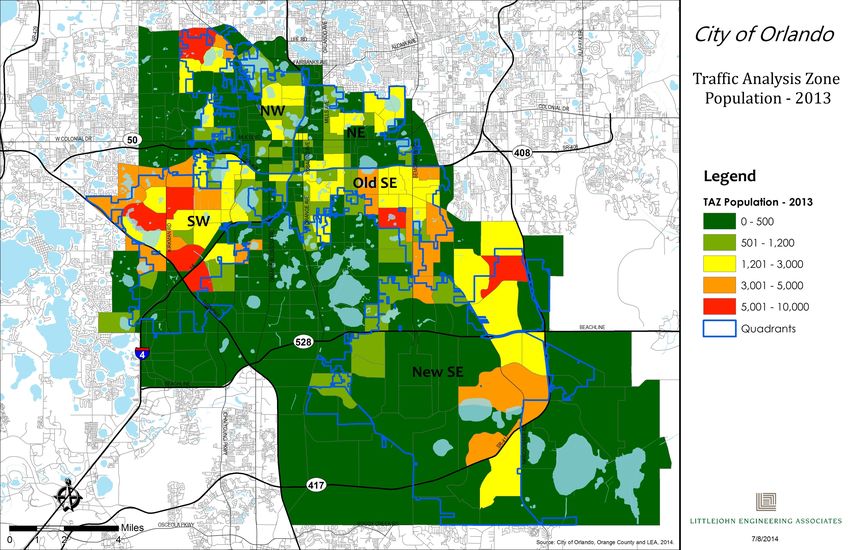
City of Orlando
Families, Parks and Recreation Impact Fee Study

I. Executive Summary
The City of Orlando Families, Parks and Recreation Department includes the Recreation
Division, Parks Division, and the Orlando After School All Stars.
The Families, Parks and Recreation Department provides the residents of Orlando fitness,
recreational, educational and cultural activities and programs at one hundred-one
park locations, seventeen recreation centers, seven After School All-Star locations, four
special facilities, two Senior Centers and two trails.
       This report:
           •      Evaluates future population and growth trends within the City of Orlando,
           •      Identifies the areas of the City where and when the greatest anticipated
                  residential growth will occur,
           •      Evaluates the existing level of parks and recreation services provided to
                  City residents and visitors, examines alternative level-of-service
                  measurements and identifies potential deficiencies in service provision
                  based on alternative level-of-service measurements,
           •      Identifies potential replacement costs for existing park and recreational
                  facilities based on current industry standards, current park facility
                  inventory and proposed park facility function and service models; and,
           •      Presents for consideration, two potential impact fee schedules based on
                  a standards-based (level-of-service) model and an improvements-based
                  (New Facilities) model.
       This report presents a Standards-Based (level-of-service) impact fee, an
       Improvements-Based (New Facilities) impact fee and a Quadrant-Based (variant
       of Improvement-Based) impact fee schedules for consideration by the City as
       potential funding mechanisms to support the development of future park
       facilities’ capital improvements to address population growth related demands
       for parks and recreation services through the 2030 planning horizon.
       Additionally, this report evaluated and assessed the feasibility of developing
       separate impact fees for the five quadrants of the City versus a citywide fee
       based on anticipated population and development impacts.
       The proposed fee alternatives present the maximum, justifiable, potential impact
       fees that the City of Orlando may determine to charge new residential
       development based on maintaining the existing level-of-service for Park and
       Recreational services or to address a specific capital improvement program for
       Parks and Recreation facilities. Future policy decisions by the Orlando City
       Council will be needed to determine: if the use of an impact fee to address the
       identified future Parks and Recreation capital needs is appropriate; if deemed
       appropriate, what type of impact fee mechanism may be utilized; and, whether
       the maximum justifiable fee amount, or a proportion thereof, is utilized to
       augment funding future capital needs for Park and Recreational facilities based
       on population growth.
       The result of the analysis of the three potential impact fee methods revealed that
       the most equitable potential impact fee methodology with the most flexibility for

                                                                                   1|Page
Revised Draft [8/22/2014]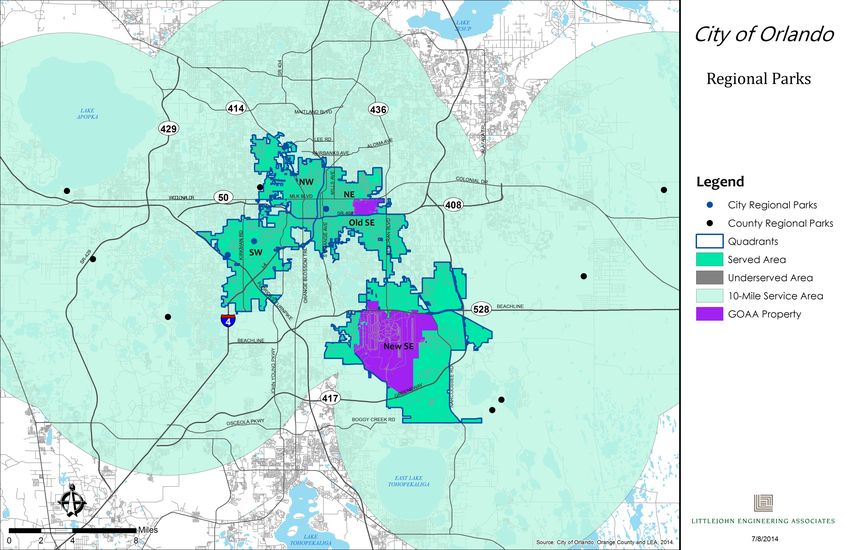
City of Orlando
Families, Parks and Recreation Impact Fee Study

       utilization of the fee revenues by the City is a citywide Level-of-Service
       Standards-Based fee of $6,902.38 (for new Single-Family residential units) and
       $5,892.73 (for new Multi-Family residential units). Improvements-Based fees
       provide for limited flexibility due to the predetermined nature of the parks
       facilities that may utilize the fees. An Improvements-Based fee does not allow for
       city discretion or community-driven desires to allocate funds for future
       improvements that were not specifically identified during the formulation of the
       Improvements-Based fee. The maximum Improvements-Based fee presented is
       $4,429.32 (for new Single-Family residential units) and $3,800.14 (for new Multi-
       Family residential units). Please note that these potential fee amounts represent
       the maximum amount that the City may choose to utilize. It is at the City’s
       discretion, if an impact fee is appropriate for funding future parks and recreation
       capital improvements, and whether to use the maximum fee amount, or a
       partially discounted fee amount.
       Also completed as part of this analysis, was an evaluation of allocating costs and
       fees by service quadrant for the Improvements-Based fees methodology. Due to
       the historical growth patterns, anticipated future growth locations and the
       unique demands of specific service quadrants (areas of the City), the analysis
       revealed a large range of potential fees for different quadrants from $0 to over
       $17,000. Due to the potential range of fees, a service quadrant specific fee
       approach was not selected for further evaluation due to potential equity issues
       and the potential effect that disparate fees may discourage future
       development in service quadrant areas that may have higher Improvement-
       Based fees.

                                                                                 2|Page
Revised Draft [8/22/2014]
City of Orlando
Families, Parks and Recreation Impact Fee Study

       Summary and Recommendations
       The following proposed impact fee schedules, shown in Table 1, were developed
       to address the potential funding for FPR capital facilities needed to address
       future demands for service based on population growth.
       Table 1: Impact Fee Summary Table

        LOS Standards-             Residents per   Net Cost per   Net Credit   Total Impact
        Based Fee                       Unit        Resident       per Unit    Fee Per Unit
        Single Family                   2.60        $2,654.76      $154.39       $6,902.38
        Multi-family                    2.20        $2,678.51      $130.64       $5,892.73
        Improvements-              Residents per   Net Cost per   Net Credit   Total Impact
        Based Fee                       Unit        Resident       per Unit    Fee Per Unit
        Single Family                   2.60        $1,703.58      $154.39       $4,429.32
        Multi-family                    2.20        $1,727.34      $130.64       $3,800.14
       Source: Littlejohn, 2014.

       Based on in-depth discussions with Families, Parks and Recreation Department
       (FPR) staff regarding the Department’s long term service delivery and
       programming objectives and to ensure equity regarding the collection of
       proposed fees and to provide maximum flexibility regarding the use of potential
       impact fees collected for the provision of parks and recreation facilities, the use
       of the Level-of-Service (LOS) standards based impact fee is recommended.
       The improvements based fee provides less flexibility to the City and would restrict
       the City to provide specific recreation improvements for the areas of the City
       regardless of community desires, demographic and social makeup of the area,
       or realistic demand for the facilities. Standards based impact fees provides a
       pool of funds that can be more flexibly utilized to address recreation facilities
       improvements Citywide.
       It is recommended that the city evaluate on annual basis whether to adjust the
       adopted impact fee based on the Consumer Price Index (CPI). It should be
       noted that the CPI fluctuates from year-to-year.
       Potential Future Impact Fee Revenue Scenarios
       The following table illustrates the potential impact fee revenues that may be
       generated from the LOS Standard-Based Fee and Improvement-Based Fee
       based on population and housing development projections through 2040.
       Potential Impact Fee revenues were generated using undiscounted rates and a
       fifty-percent (50%) discounted rates for evaluation by the City. Table 2 presents
       these projections.

                                                                                    3|Page
Revised Draft [8/22/2014]
City of Orlando
Families, Parks and Recreation Impact Fee Study

Table 2: Potential Future Impact Fee Revenue Scenarios Table

 Proposed Impact Fee                Estimated              Estimated             Estimated             Estimated             Estimated
 Methodology              2015         Fees       2025        Fees       2030       Fees       2035       Fees       2040       Fees          Total
 LOS Standards-Based Methodology
 100% Proposed Fee
             SFR(Units)     1,204    $8,310,466    2,368   $16,344,836   2,375   $16,393,153    844     $5,825,609    779     $5,376,954    $52,251,017
            MFR (Units)     2,832   $16,688,211   10,493   $61,832,416   8,463   $49,870,174   4,615   $27,194,949   3,191   $18,803,701   $174,389,452
                  Total                                                                                                                    $226,640,468
 50% Proposed Fee
 (Discounted)
             SFR(Units)     1,204    $4,155,233    2,368    $8,172,418   2,375    $8,196,576    844     $2,912,804    779     $2,688,477    $26,125,508
            MFR (Units)     2,832    $8,344,106   10,493   $30,916,208   8,463   $24,935,087   4,615   $13,597,474   3,191    $9,401,851    $87,194,726
                  Total                                                                                                                    $113,320,234
 Improvements-Based Methodology
 100% Proposed Fee
             SFR(Units)     1,204    $5,332,901    2,368   $10,488,630   1,652    $7,317,237    844     $3,738,346    779     $3,450,440    $30,327,554
            MFR (Units)     2,832   $10,761,996   10,493   $39,874,869   5,025   $19,095,704   4,615   $17,537,646   3,191   $12,126,247    $99,396,462
                  Total                                                                                                                    $129,724,016
 50% Proposed Fee
 (Discounted)
             SFR(Units)     1,204    $2,666,451    2,368    $5,244,315   2,375    $3,658,618    844     $1,869,173    779     $1,725,220    $15,163,777
            MFR (Units)     2,832    $5,380,998   10,493   $19,937,435   8,463    $9,547,852   4,615    $8,768,823   3,191    $6,063,123    $49,698,231
                  Total                                                                                                                    $64,862,008

                                                                                                                                           4|Page
Revised Draft [8/22/2014]
City of Orlando
Families, Parks and Recreation Impact Fee Study

II. Population Growth and Trends
This section includes Orlando’s estimated current and projected population figures. For
the purposes of this study, population numbers were extracted from Traffic Analysis
Zones (TAZ) prepared by MetroPlan Orlando. The use of TAZ data provides both
empirical information and spatial growth patterns that is not possible in generalized
population forecasts.

          A.       Orlando’s Current Population
          The City of Orlando is estimated to have a population of 249,562 (2012 Estimate,
          US Census) and a land area of approximately 111 square miles. The City’s current
          population density is 2,327 persons per square mile. Orlando is the 77th largest
          city in the United States. The City receives over 51 million tourists per year.
          Orlando is one of the nation’s most rapidly growing municipalities due primarily
          to the growth of the tourism-related attractions and the hospitality industry.
          Orlando is part of the dynamic and growing central Florida region. The City of
          Orlando is a diverse community that is composed of a significant amount of
          relocated residents. Orlando’s demographic composition is reflective of this
          increasing diversity. The largest segments of the City’s population as classified by
          the 2010 US Census are as follows:

             •    41% of the population classified as White/Caucasian Non-Hispanic
             •    Over 28% classified as Black or African-American
             •    Over 25% classified as Hispanic or Latino
             •    Almost 4% (3.8%) classified as Asian

          “In-migration 1” continues to fuel Orlando’s population growth. For the period of
          2000 through 2012 the Orlando metropolitan area’s 2 population has grown from
          185,951 persons to 249,562 persons, an approximate population increase of 34%!
          Orlando’s populace is also relatively young. The median age for a City resident
          is approximately 33 years of age.
          The continuing diversification of Orlando’s economy beyond the tourism-related
          industries into such sectors as modeling,
          simulation, software, manufacturing, financial
          services, health-care services and television      Orlando is #4 of the top-10
          and motion-pictures production has added to        fastest growing cities in US.
          the City’s population growth and diversity.
                                                                             -CNN Money, 2014

1In-migration is a verb meaning to move into or come to live in a region or community especially as part of
a large-scale and continuing movement of population. Source: Merriam-Webster Dictionary, 2014.
2   Orlando Metropolitan Statistical Area (MSA).

                                                                                                5|Page
Revised Draft [8/22/2014]
City of Orlando
Families, Parks and Recreation Impact Fee Study
B. Orlando’s Future Population
Growth in the technology industry sector, the tourism and hospitality sector, the
healthcare industry, and the film and television sector will continue to drive
Orlando’s economic development and population growth. During the period
July, 2012 to July, 2013, the Orlando Metropolitan Statistical Area added 44,390
new residents. 3
The most significant geographic areas of anticipated population growth for the
City of Orlando are the downtown urban core and the southeast areas of the
City.
The geographic location of the City’s The need is still great,
anticipated population growth is shown on however, and demand for
the following series of maps for the 2040 outdoor recreation
planning horizon. These maps utilize Traffic opportunities will evolve and
Analysis Zone (TAZ) data provided by US continue to grow in tandem
Census forecasts, and are tailored to the with the state’s population.
Orlando area conditions by the City of
Orlando and other local government -Outdoor Recreation in
planning agencies to estimate future Florida, 2013-Florida
population growth. The maps detail where
Statewide Comprehensive
the largest anticipated increases in
population will occur within the City and
Outdoor Recreation Plan
show where the City will have the largest (SCORP)
future demand for parks and recreation
services.
The map areas shown are segmented into the “service-area” quadrants utilized
in the 2010, City of Orlando, Families, Parks and Recreation Vision Plan. The
proportional increases in population density are color coded. Areas are color
coded from “green” to “red” with green representing the lowest threshold of
population density and red representing the highest comparative threshold of
population density. Population density growth in specific areas (TAZ’s) over time
is reflected by a change in color from the preceding threshold level.
3 CNN, Money, “Top 10 Fastest Growing Cities”, March 27, 2014. U.S. Census Bureau, 2014.
6|Page
Revised Draft [8/22/2014]City of Orlando
Families, Parks and Recreation Impact Fee Study
Map 1: City of Orlando Population 2013 by TAZ
7|Pag e
Revised Draft [8/22/2014]City of Orlando
Families, Parks and Recreation Impact Fee Study
Map 1 graphically depicts the current population density conditions of the City
with the largest concentrations of highest-density population (5001-10,000
persons) located in the older areas of the City, the Northwest (NW), Southwest
(SW), and Old Southeast (Old SE) service quadrants. The least densely
populated quadrant in 2013 is located in the ‘newer’ part of the City, the New
Southeast (New SE) quadrant. This map serves as the base for future map series
comparisons. Subsequent changes in population density due to population
growth will be depicted as changes in color of the affected TAZ areas.
8|Page
Revised Draft [8/22/2014]City of Orlando
Families, Parks and Recreation Impact Fee Study
Map 2: City of Orlando Population 2020 by TAZ
9|Page
Revised Draft [8/22/2014]City of Orlando
Families, Parks and Recreation Impact Fee Study
Map 2 graphically depicts the growing population density conditions of the City
with significant growth anticipated in the Southwest (SW) and New Southeast
(New SE) service quadrants during the 2013-2020 period. When compared to the
2013 TAZ Population Map, the changes in colors in the south-eastern portion of
the New Southeast (New SE) service quadrant graphically indicates the areas of
anticipated population growth and increasing population density, south of the
East-West Expressway and east of South Orange Avenue. This area includes the
Lake Nona, Medical City and Vista East developments.
10 | P a g e
Revised Draft [8/22/2014]City of Orlando
Families, Parks and Recreation Impact Fee Study
Map 3: City of Orlando Population 2030 by TAZ
11 | P a g e
Revised Draft [8/22/2014]City of Orlando
Families, Parks and Recreation Impact Fee Study
Map 3 graphically depicts the growing population density conditions of the City
with significant growth anticipated in the Old Southeast (Old SE) and continuing
population growth in the Northeast (NE) and New Southeast (New SE) service
quadrants during the 2020-2030 period. The on-going growing population
density in the New Southeast (New SE) quadrant is associated with continuing
development of the Lake Nona, Vista East and Medical City developments.
12 | P a g e
Revised Draft [8/22/2014]City of Orlando
Families, Parks and Recreation Impact Fee Study
Map 4: City of Orlando Population 2040 by TAZ
13 | P a g e
Revised Draft [8/22/2014]City of Orlando
Families, Parks and Recreation Impact Fee Study
Map 4 graphically depicts the growing population density conditions of the City
with growth anticipated in the Northwest (NW) and Northeast (NE) quadrants
and continuing population growth Old Southeast (Old SE) in the New Southeast
(New SE) service quadrants during the 2020-2040 period. The significant
population growth that is shown in the south-eastern portion of the New
Southeast (New SE) service quadrant indicates the area that will have the
highest new demand for community and neighborhood parks in the future.
C. Population Growth Summary
Table 3 shows the anticipated population growth for the City of Orlando for the
period of 2013 through 2040 segmented by service-area quadrants. The overall
population of the City is estimated to increase by approximately 84,243 residents.
The largest population increases for that period occur in Northeast (NE) and New
Southeast (New SE) service-quadrants with population increases of 10,271 person
(approximately 30%) and 53,033 persons (approximately 135%) respectively. This
represents approximately 75% of the City’s total population growth for the
planning period occurring in these two services areas. Approximately 63% of the
total population growth for the planning period occurring in the New Southeast
(New SE) service quadrant. The Northwest (NW), Old Southeast (Old SE), and
Southwest (SW) service-quadrants are estimated to grow by 6,592 persons or
approximately 17%, 7,303 persons or approximately 11% and 7,044 persons or
approximately 8% respectively during the 2013-2040 planning period. The largest
increase in demand for parks and recreation services and facilities will be within
the New Southeast (New SE) service-quadrant followed by the Northeast (NE)
service-quadrant.
Table 3: Orlando Population Projections 2013-2040
TAZ 2013 2020 2025 2030 2035 2040
Quadrant
Count Population Population Population Population Population Population
Northeast 66 34,783 39,172 41,962 42,744 43,648 45,054
New
49 39,177 52,783 70,108 81,784 88,215 92,210
Southeast
Northwest 49 38,555 40,960 42,587 43,287 44,759 45,147
Old
49 65,800 65,951 67,812 69,040 70,945 73,103
Southeast
Southwest 63 83,427 87,286 88,297 89,119 89,997 90,471
Total 276 261,742 286,152 310,766 325,974 337,564 345,985
Source: Traffic Analysis Zones, MetroPlan Orlando, 2014.
14 | P a g e
Revised Draft [8/22/2014]City of Orlando
Families, Parks and Recreation Impact Fee Study
III. Parks and Recreation Service Standards
The National Recreation and Parks Association (NRPA), defines level-of-service (LOS) as
"an allocation mechanism for the delivery of park land and basic recreation facilities
throughout a community. By adopting such a standard, a community in essence says
that all citizens, regardless of the taxes they pay or the use they will make of the services
provided, will have an equal opportunity to share in the basic menu of services implicit
in the standard and accompanying spatial distribution and allocation policies."
This section of the document evaluates the current level-of-service measurements of
parks and the recreational facilities utilized by the City of Orlando and also evaluates
two other level-of-service measurement techniques, facility access and facility
capacity. In addition to level-of-service standards, the City of Orlando also considers
other factors when determining how to provide park and recreation facilities for
neighborhood residents, residents citywide, regional residents and visitors. These factors
considered by the City include:
1) The amenities offered at each location. Amenities include recreation centers,
playgrounds, basketball courts, swimming pools, ball fields, and other amenities.
2) The users of each facility. The population which is served by a particular site is
influenced by factors such as age, local culture and interests. The Families, Parks
and Recreation Department is the lead entity in dealing with recreational
programming and amenity planning.
3) The condition of each park site. The City of Orlando is committed to providing
safe, environmentally friendly, usable park facilities. Identification of repair and
replacement issues are handled primarily under the auspices of the Public Works
Department and the Families, Parks and Recreation Department. Funding for repair
and replacement of amenities are addressed through the goals, objectives, and
policies section of the Parks and Recreation Element and the Capital Improvement
Element of the City’s Comprehensive Plan.
4) The location and the accessibility of each site. Accessibility to parks and other
recreation opportunities in Orlando varies considerably among population groups.
Lower income groups, the very young and the elderly tend to have limited mobility
and typically have limited access to recreational opportunities. Orlando’s Parks
have been designed so that all persons of all abilities and ages may access the park
in an independent and safe manner.
Each of the alternative level-of-service measurement techniques presented addresses
different aspects of the four factors presented above. When the various level-of-service
measurements are viewed in total, they present a more complete picture of the
anticipated future needs for parks and recreation services than the picture presented
when utilizing a singular level-of-service standard. Each level-of-service measurement
technique has its own unique measurement characteristics. No one level-of-service
measurement technique is perfect. While the City’s currently adopted level-of-service
measurement technique has served the City well, utilization of the information
presented by the alternative level-of-service measurement techniques evaluated will
enable the City to identify and address service delivery deficiencies and more
effectively deliver parks and recreational services to City residents and visitors.
15 | P a g e
Revised Draft [8/22/2014]City of Orlando
Families, Parks and Recreation Impact Fee Study
A. Acreage Standards
The City of Orlando provides recreational facilities and programming,
educational services and cultural activities to residents and visitors to the City.
The City measures the current level-of-service for the provision of parks and
recreational services through a ratio of the acreage of park sites per 1,000
persons. The two park classifications used for the analysis of level-of-service are
Neighborhood Parks and Community Parks. Major Sports, Performing Arts and
Special Facilities, and Undeveloped Parks do not have adopted LOS standards.
The adopted levels of service for parks and recreation services are 3.25 acres per
1,000 persons of population for Neighborhood and Community parks combined,
with a 1.3 acres per 1,000 persons for Community Parks and 0.75 acres per 1,000
persons for Neighborhood Parks. 4
Due to the large amount of park acreage Orlando provides 12.6 acres
owned, maintained, operated or mandated of parks and recreation area
by the City, it will take nearly 35 years to per 1,000 residents. The
reach a need for a new parks and recreation
median acreage provided
facilities based solely on the adopted level-
of-service standard and population growth.
by the Top 50 cities in the
This useful for measuring the provision of land nation is 13.1 acres per 1,000
(acreage) for park uses, but does not address residents.
facilities or location.
-2012 City Park Facts-The Trust
This level-of-service measurement technique
addresses the “When and how much area?”
for Public Land
question of providing parks and recreation
facilities in the future. However that is the limit of the level-of-service guidance
this measurement can provide. It does not address the types of facilities (What
type of facility is needed?) that may be needed in the future or the potential
locations where new facilities may be needed in the future to address localized
demands for service (Where are new facilities needed?).
4City of Orlando Comprehensive Plan, Recreation and Opens Space Element, Goals, Objectives
and Policies, Policy 1.1.1, Page R-1, 2012.
16 | P a g e
Revised Draft [8/22/2014]City of Orlando
Families, Parks and Recreation Impact Fee Study
Table 4: 2014 Citywide Actual Park Levels of Service
Actual Existing Level-of-
Existing City Parks Acreage
Service
All Developed Park Land 3,159.20 12.66 Acres per 1,000 pop.
Combined Regional,
Community and
Neighborhood Park Land 1,824.91 7.31 Acres per 1,000 pop.
Regional Parks 352.93 1.41 Acres per 1,000 pop.
Community Parks 431.11 1.73 Acres per 1,000 pop.
Neighborhood Parks 1,040.87 4.14 Acres per 1,000 pop.
Source: City of Orlando, Comprehensive Plan, Figure R-2 Orlando Park Amenities, August 2014.
Table 4 shows the actual citywide level-of-service for park and recreation space
currently provided by the City. The 12.66 acres per 1,000 persons LOS is very near
the national median of 13.1 acres for the top 50 cities in the U.S. 5
To better understand the relationship between the different types of parks, their
typical sizes, uses and amenities within the City of Orlando the following
definitions are provided.
Regional Parks are frequently defined as facilities that may serve the
neighborhood, community and have the capacity and amenities to serve a still
larger section of the city and the region as well. Included are the larger parks,
golf courses, athletic complexes, parkways, and camp sites. Regional parks are
designed and developed for diversified use by large numbers of people.
Because of their area, they will contain facilities that cannot be accommodated
in the neighborhood or community park. They give the urban dweller contact
with nature and a pleasant environment in which he can engage in a variety of
recreational activities. There is wide variation for the ‘standard’ size for regional
parks ranging from 50 acres to over 200 acres in size depending on local
community, agency or organization standards and definitions 6 . Regional parks
may include Dog parks as one of their amenities. Examples of Regional parks
within the City of Orlando are: Bill Frederick Park at Turkey Lake; Eagle Nest Park;
Lake Eola Park and Trotter’s Park (formerly Ben White raceway).
Community Parks are usually defined as a combination of active and passive
facilities ranging in size from 5 to 25 acres. The average size of community parks
in Orlando is 24.78 acres 7. Community parks serve an area between the smaller
neighborhood facilities and the larger regional parks which may serve the entire
city and region. Community parks facilities should be centrally located for the
5 City Park Facts-The Trust for Public Land, 2012.
6 American Planning Association (APA), Planning Advisory Services, Standards for Outdoor
Recreational Areas, 1965.
7 City of Orlando, Comprehensive Plan, Recreation & Open Space Support Document, Data
Inventory and Analysis, 2009.
17 | P a g e
Revised Draft [8/22/2014]City of Orlando
Families, Parks and Recreation Impact Fee Study
area it serves. The two most common types of community facilities are the
playfield and the community park, which in some cities have been combined to
form a playfield-park. Community parks may include Dog parks as one of their
amenities. The ‘standard’ size for community parks varies from 20-50 acres in size
depending on local community, agency or organization standards and
definitions 8. Examples of Community Parks within the City of Orlando are: Blue
Jacket Park; Demetree Park; Lake Fairview Park; Langford Park and Park of the
Americas (formerly Herndon Nature Park).
Neighborhood Parks are usually defined as active or passive parks, ranging in
size from 3 to 10 acres. Neighborhood parks may utilize or complement
playground facilities and service areas provided by public schools, wherever
possible. The average size of neighborhood parks within the City of Orlando is
3.47 acres 9. Neighborhood parks may include Dog parks as one of their
amenities. Pocket-parks, and other very small urban parks, frequently comprised
of passive use open space with little or no amenities, are also included in the
Neighborhood park definition. The ‘standard’ size for neighborhood parks varies
from 1/2-10 acres in size depending on local community, agency or organization
standards and definitions 10. Examples of Neighborhood Parks within the City of
Orlando are: Al Coith Park; Baldwin Park’s shoreline parks areas; Big Tree Park;
Cherokee Park; Dartmouth Park; Englewood Park; Lake Como Park; Park Lake
Park; Orwin Manor Green; the Parramore Heritage Park; Rock Lake Park and
Spring Lake Park.
Community and Recreation Centers
In addition to Neighborhood, Community and Regional parks, one of the key
features of the unique services and programming provided by City of Orlando’s
Families, Parks and Recreation system are the local Community Centers and
Recreational Centers. The ever-increasing population and urban density of the
City of Orlando demands that the provision of particular social activities, services
and recreational programming be made available at the City’s Community and
Recreation Centers. Social activity services include after-school athletic and
academic programming, youth-mentoring and development, active living
programs and senior residents’ activities and programs. The City of Orlando
currently has nineteen (19) Community and Recreation Centers including: the
Callahan Neighborhood Center; the Claudia Allen Senior Center; the Citrus
Square Recreational Site; the College Park Community Center; the Colonialtown
Neighborhood Center; the Dover Shores Neighborhood Center; the Downtown
recreation and Tennis Center; the Dr. Smith neighborhood Center; the
Englewood Neighborhood Center; the Dr. I Sylvester Hankins Park Recreation
Site; the Ivey Lane Recreational Site; the John H. Jackson Recreational Center;
8 American Planning Association (APA), Planning Advisory Services, Standards for Outdoor
Recreational Areas, 1965.
9 City of Orlando, Comprehensive Plan, Recreation & Open Space Support Document, Data
Inventory and Analysis, 2009.
10 American Planning Association (APA), Planning Advisory Services, Standards for Outdoor
Recreational Areas, 1965.
18 | P a g e
Revised Draft [8/22/2014]City of Orlando
Families, Parks and Recreation Impact Fee Study
the Langford Park Neighborhood Center; the Northwest Community Center; the
Reeves Terrace Recreation Site; the Rock Lake Community Center; the Rosemont
Community Center; and the Wadeview Community Center.
1. Current Deficiencies- Acreage Standard
Table 3 shows the current citywide level-of-service based on acres per
capita. It shows that the existing level-of-service currently exceeds the
adopted level-of-service standard. There is no LOS deficiency using the
City adopted LOS standard. Based on the current LOS standards utilizing
a combined Community and Neighborhood Park land acreage yields an
existing level-of-service standard of 7.28 acres per 1,000 persons.
Although the City is providing a level-of-service that is in excess of the
adopted standard, it does not address the provision of services based on
location and capacity. The City is providing a satisfactory amount of
Community and Neighborhood park area, as measured in acres of
facilities per 1,000 persons, however this measurement does not address
where the parks are located relative to residents who may utilize the park
facilities (accessibility) and does not address the physical capacity of the
facilities, or how many people may be able utilize the facilities.
B. Accessibility Standards
The second level-of-service measurement technique evaluated is accessibility
standards. The City’s current Comprehensive Plan level-of-service standard of
3.25 acres per 1,000 persons for parks and recreation facilities does not account
for facility accessibility, or how far residents have to travel to use parks and
recreation facilities. Facility access is defined by the service area that a park or
recreation facility serves. Service areas may be defined as either a measure of
distance from a specific facility or of travel time to get to a specific facility. Parks
and recreation planning guidelines include service area radii for each park type
(i.e. neighborhood, community, and regional) and facility type (e.g. basketball
courts, baseball fields, soccer fields, etc). The 2000 Florida State Comprehensive
Outdoor Recreation Plan (SCORP) guidelines provide service radius guidelines for
park and recreation facilities. Service radius guidelines are based on the specific
type of park, which is generally based on the size, capacity and facilities.
However, these guidelines are flexible and can be molded to a specific
community that has unique characteristics, or guidelines for specific park/facility
type and may also be adjusted due to events programming or functionality. For
example, Lake Eola Park does not meet the recommended size or general
description for a regional park, but due to its functionality it operates more as a
regional park because it draws visitors from throughout the Central Florida region
and therefore has a large service area. Table 5, shows the recommended
service area radii for parks and facilities by type.
19 | P a g e
Revised Draft [8/22/2014]City of Orlando
Families, Parks and Recreation Impact Fee Study
Table 5: Parks and Facilities Service Areas (Radii)
Service Area Radii
Type (Miles)
Parks
Neighborhood 1
Community 3
Regional 10
Facility
Baseball Fields 2
Softball Fields 5
Soccer Fields 2
Swimming Pools 2
Senior Centers 2
Dog Parks 5
Tennis Courts 5
Basketball Courts 1
Source: SCORP, FRP Vision Plan (2010), and Littlejohn, 2014.
Service area and accessibility to parks and recreational facilities for all citizens of
the City of Orlando was identified as an Objective in the City’s Comprehensive
Plan 11. The City of Orlando’s Families, Park and Recreation Vision Plan (2010)
introduced facility access standards for consideration in establishing future levels
of service for park and recreation facilities. Accessibility standards move the
typical acres per capita standard to a spatial exercise of providing facilities and
parks within a specific distance to potential users. The benefit of using a service
area and accessibility level-of-service standard is the ability to identify
underserved areas of the City with regards to parks and recreation facilities. This
level-of-service measurement technique addresses the “Where?” question of
providing parks and recreation facilities.
The 2010 Families, Parks and Recreation Vision Plan identified service areas by
parks and facility type. This park and facility evaluation showed the underserved
areas in the City for the different facility types. As provided in the FRP Vision Plan,
the New Southeast quadrant (Airport/Lake Nona Area) lacked facilities due in
large part to the underdeveloped nature of the area. The benefit of utilizing this
level-of-service measurement technique is that it can geographically identify
underserved areas of the community by park facility.
The following map series graphically depicts the service areas for Regional,
Community and Neighborhood park facilities. Appendix A shows the facility
City of Orlando Comprehensive Plan, Recreation and Opens Space Element, Goals,
11
Objectives and Policies, Objective 1.4, Page R-8, 2012.
20 | P a g e
Revised Draft [8/22/2014]City of Orlando
Families, Parks and Recreation Impact Fee Study
service areas for various recreational facilities including baseball fields,
basketball courts, softball fields, swimming pools, senior centers, soccer fields,
tennis courts, gymnasiums and community centers.
21 | P a g e
Revised Draft [8/22/2014]City of Orlando
Families, Parks and Recreation Impact Fee Study
Map 5: Regional Parks Service Areas
22 | P a g e
Revised Draft [8/22/2014]City of Orlando
Families, Parks and Recreation Impact Fee Study
Map 5 depicts the Regional Parks that serve the City of Orlando as identified in
the City of Orlando FPR Vision Plan and the Orange County Parks database.
Due to their ten (10) mile service radius City residents are served by both City of
Orlando Regional Parks and Orange County Regional Parks. City of Orlando
Regional Parks shown on this map include: Mayor Bill Frederick Park at Turkey
Lake; Lake Eola Park; Trotter’s Park, and Eagle Nest Park. Eagle Nest Park,
although identified as a Community Park in the FPR Vision Plan, is included as a
Regional Park facility due to its size and regional draw of park users. Orange
County Parks Regional Parks shown on this map include: Tibet Butler Preserve;
Fort Christmas Park; Hal Scott Reserve; Split Oak Park Forest; Moss Park; Barnett
Park; the Oakland Nature Preserve, and Horizon West Park.
1. Accessibility Standard-Regional Parks
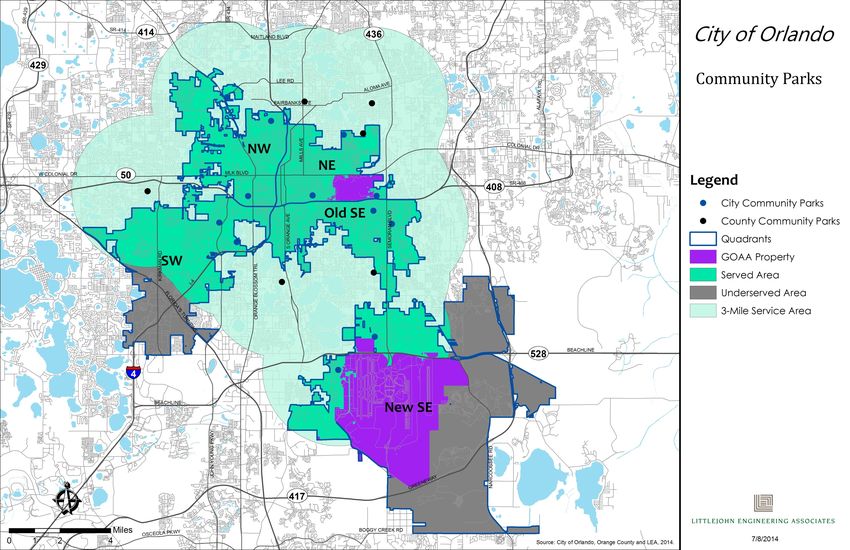
Due to the overlapping service areas of the City of Orlando and Orange
County Regional Park facilities there are no underserved areas identified
within the City of Orlando for Regional Park facilities when utilizing
accessibility standards.
23 | P a g e
Revised Draft [8/22/2014]City of Orlando
Families, Parks and Recreation Impact Fee Study
Map 6: Community Parks Service Areas
24 | P a g e
Revised Draft [8/22/2014]City of Orlando
Families, Parks and Recreation Impact Fee Study
Map 6 depicts the Community Parks that serve the City of Orlando as identified
in the City of Orlando FPR Vision Plan and the Orange County Parks database.
Due to their three (3) mile service radius Orlando residents are served by both
City of Orlando Community Parks and Orange County Community Parks. City of
Orlando Community Parks shown on this map include the following: Clear Lake
Park; Dr. I Sylvester Hankins Park; Blue Jacket Park; Park of the Americas; Langford
Park; Airport Lakes Park; La Costa Urban Wetlands; Lake Fairview Park; Loch
Haven Park; Lorna Doone Park; Southport Park, and Demetree Park.
Orange County Parks Community Parks shown on this map include: Cypress
Grove Park; Orlo Vista Park; Barber Park; Ward Park Sports; Fleet Peoples Park at
Lake Baldwin, and Lake Island Park.
2. Accessibility Standard-Community Parks
Due to the overlapping service areas of the City of Orlando and Orange
County Community Park facilities the City as a whole is well-served with
Community Park facilities. However there are underserved areas
identified within the City of Orlando for Community Park facilities in the
New Southeast quadrant (New SE) and the Southwest quadrant (SW) of
the City when utilizing accessibility standards. The underserved areas are
more than three miles away from a City of Orlando or Orange County
Community Park facility. These two quadrants lack the current resident
population due in part to a thriving tourist district (SW) and a burgeoning
suburban sector developing around Medical City (New SE).
25 | P a g e
Revised Draft [8/22/2014]City of Orlando
Families, Parks and Recreation Impact Fee Study
Map 7: Neighborhood Parks Service Areas
26 | P a g e
Revised Draft [8/22/2014]City of Orlando
Families, Parks and Recreation Impact Fee Study
Map 7 depicts the Neighborhood Parks that serve the City of Orlando as
identified in the City of Orlando FPR Vision Plan and the Orange County Parks
database. Due to their one (1) mile service radius Orlando residents are served
by City of Orlando Neighborhood Parks, Orange County Neighborhood Parks,
Joint-Use Parks that may include Orange County Neighborhood Parks and
Orange County Public Schools facilities, an Orlando/Orange County Expressway
Authority facility and numerous Home-Owner Association (HOA) facilities.
Appendix B contains the full list of parks, amenities, acreage, and quadrant
location by facility.
There are eighty-four (84) City of Orlando Neighborhood Parks shown on this
map. Please note that Lorna Doone Park is placed in the Community Park
category and Lake Eola Park is placed in the Regional Park category. Although
both of these parks serve the immediate neighborhoods in which they are
located they also serve a larger service areas generally associated with
Community and Regional Park facilities. City of Orlando Neighborhood Parks
shown on this map include the following:
Airport Lakes Park Dickson Azalea Park Lace Fern Village Park
(within Timberleaf)
Al Coith Park Dover Estates Linear
Park Lake Adair
Albert Park (aka First
Park) Dover Shores Lake Beauty Park
Neighborhood Center
Baldwin Park (Unit 7, Lake Cherokee
Tracts 244, 245, Unit 9A East Central Shoreline Park
Tract 289,Unit 8A, Tract Neighborhood Center
Lake Como
315,Lk Susannah
East Park PD N-1
Shoreline) Lake Concord (Don
Neighborhood Park
Dudley)
Beth Johnson Park (City Owned-Privately
Maintained) Lake Davis
Big Tree Park
Englewood Park Lake Dot
Cherokee Park
Florida A&M School of Lake Dover (803
Cherry Tree Park
Law Green Wavecrest Drive)
Citrus Square
George Barker Park Lake Emerald
Recreation Site
Gertrude's Walk Lake Estelle
College Park
Community Center Gilbert McQueen Park Lake Formosa
(Adj to Princeton Elem. Lake Highland Park
Guernsey Park
& Princeton Park)
Hampton Park Lake Ivanhoe
Colonialtown Square
Iowa Place Park Lake Lancaster
Dartmouth Park
Ivanhoe Plaza Park Lake Lawsona
Delaney Park
Playground Ivey Lane Park Lake Lucerne
Kittinger Park Lake Rowena
27 | P a g e
Revised Draft [8/22/2014]City of Orlando
Families, Parks and Recreation Impact Fee Study
Lake Weldona Orlando City Hall Urban Rock Lake Park
Park
Leroy Hoequist Park Rosemont Community
Orlando Cultural Park Area (Lake Shore Park)
Lighthouse Park
(former USDA site)
Rosemont Park/Tot-Lot
Lizzie Rogers Park
Orwin Manor Green
Rosemont Sports Fields
Loch Haven
Orwin and Community
Neighborhood Center
Manor/Westminster Center
Malibu Groves Park (Tot Green
Signal Hill Park
Lot)
Overbrook Park
Songbird Park (1124/30
Mathews Park
Park Lake Cardinal Rd)
Mayfair Green (939
Parramore Community Southern Gateway
Mayfair Circle)
Garden Park
Mercy Drive
Parramore Heritage Spring Lake Park
Playground (Children's
Central Park
Safety Village) Wall Street Plaza
(Stormwater Pond - 4.8
Mitchell Nutter Park ac; Parkland 2.3) Washington Shores
NorthLake Park (Entry Pleasant Valley Park West Underhill Park
Pond/Ped Trail)
Poppy Park Willie Mays Park
Northwest Community
Princeton Park Willows Park
Center (Hal Marston
Playground Z.L.Riley Park
Community Center)
Seven (7) Orange County Neighborhood Parks and Joint-Use Neighborhood Parks
(County and OCPS) shown on this map include:
Audubon Park Elementary Howard Middle School
Baldwin Park (Unit 2; Elementary School Lake Lawne Park (Joint City/County
and Park Site) Neighborhood Park, 1320 Lawne Blvd)
Como Elementary Playground and Ball Wadeview Park/Boone High
fields School/Blanker K-8/Pool
Grand Avenue Elementary/Park
Ninety-nine (99) Home-Owner Association, Community Development District and
private Neighborhood Parks are shown on the map and include:
Amhurst Park (Vista Baldwin Park (Unit 1, Tract 391, West Unit 10;
Lakes HOA, Privately Tract 2, "S" Park, New CDD)
Owned, Accessible to Broad Street)
Baldwin Park (Unit 10,
All)
Baldwin Park (Unit 1, Tract 392, East Unit 10;
Baldwin Park (Unit 1, Fox Tract 5, Enders Park) CDD)
Street)
Baldwin Park (Unit 10, Baldwin Park (Unit 10,
28 | P a g e
Revised Draft [8/22/2014]City of Orlando
Families, Parks and Recreation Impact Fee Study
Tract 393, Community Maintained) Space - 2
Center; Private)
East Park PD N-7 (Park Laureate Park Open
Baldwin Park (Unit 2, #1, Public-Privately Space - 3
Tract 71, Grace Hopper Maintained)
Laureate Park Open
Hall)
Education Village Space - 4
Baldwin Park (Unit 2,
Fairway Cove Green Laureate Park Open
Tract 72, Crescent Park)
(6600 Fairway Cove Space - 5
Baldwin Park (Unit 4, Drive)
Laureate Park Open
Tract 180, Robin
Fells Landing Tract C-1 Space - 6
Rd./Ethan Ln.)
Fells Landing Tract C-2 Laureate Park Open
Baldwin Park (Unit 4,
Space - 7
Tract 181, Robin Hidden Beach (6601
Rd./Lower Union Rd.) Hidden Beach Circle) Laureate Park Open
Space - 8
Baldwin Park (Unit 4, Isle of Catalina
Tract 182, Osprey Ave) Neighborhood Center Laureate Park Open
(2701 Catalina Drive, Space - 9
Baldwin Park (Unit 6,
Private)
Tract 203, Meeting Place Laureate Park Open
Park) Lake Nona - DiVosta Space - Phase 1C - 11
VillageWalk Residential
Baldwin Park (Unit 8A, Laureate Park Open
Center (Gated)
Tract 310, Dorwin Place Space - Phase 1C - 12
Park) Lake Nona- Divosta
Laureate Park Open
Villagewalk Unit 1 - Tract
Baldwin Park (Unit 8A, Space - Phase 1C - 13
Tract 313, Foss Ave.) Lake Nona Estates
Laureate Park Open
(Gated)
Baldwin Park (Unit 8A, Space - Phase 1C - 16
Tract 314, Lake Lake Nona Preserve
Laureate Park Open
Susannah Mews) Tract D (Gated)
Space - Phase 1C - 17
Baldwin Park (Unit 9A, Laureate Park
Laureate Park Open
Tract 259, Lake Neighborhood Center
Space - Phase 1C - 18
Connection Park; CDD) Aquatic Center
Laureate Park Open
Baldwin Park (Unit 9A, Laureate Park
Space - Phase 2b - 19
Tract 285, Lake Baldwin Neighborhood Center
Dr/Shea Dr.; CDD Open Space - 1 Laureate Park Open
Space - Phase 2b - 20
Bryn Mawr Recreation Laureate Park Open
Area (Privately Space - 1 Laureate Park Open
Owned/Maintained) Space - Phase 2b - 21
Laureate Park Open
Carver Park Stormwater Space - 10 Laureate Park Open
Pond / Park Space - Phase 2b - 22
Laureate Park Open
Constitution Green Space - 11 Laureate Park Phase 3A
(Private Ownership) Laureate Park Open Laureate Park Phase 3B
East Park PD N-5 (Park Space - 12 LaVina PD (Tract AA -
#2, Public-Privately Laureate Park Open Tot Lot, Gated)
29 | P a g e
Revised Draft [8/22/2014]City of Orlando
Families, Parks and Recreation Impact Fee Study
LaVina PD (Tract L - Tot NorthLake Park N-2 (Tot (3101 Robert Trent Jones
Lot, Gated) Lot - Sunbonnet Street) Dr)
LaVina PD (Tract M, NorthLake Park N-2A Tivoli Gardens Tract F
Gated) (Glatting Green) (Crowntree)
LaVina PD (Tract P - NorthLake Park N-2B Tivoli Gardens Tract J
Lakeshore Trail, Gated) (Azalea Place Green 1, (Crowntree)
Azalea Place Green 2,
LeeVista Square Tract U Tivoli Woods PD Tract B
Azalea Place Green 3)
(Crowntree)
Tivoli Woods PD Tract E
NorthLake Park N-3B
MetroWest Country Club
(Lakeshore Park/Trail) Tivoli Woods PD Tract F
- (Golf Course
Subtracted; 2100 S. NorthLake Park N-4 Tivoli Woods PD Tract I
Hiawassee Rd) (Enclave Green) Tivoli Woods PD Tract Y
Milford Haven Green NorthLake Park N-5 UCF Medical School
(Vista Lakes; 5958 Milford (Water's Edge; Boat Green
Haven Place; Gated) Launch Park; Rec-
Center Gated) Ventura PD (Privately
Millenia Park Phase 1 Owned, Gated)
Tract N, Tract Q, Tract R, Palma Vista Green (7548
Tract T Westpointe Blvd) Villagewalk Tract E14
NonaCrest Park Avenue at Villagewalk Tract E2
Neighborhood Park Metrowest Green Villagewalk Tract L
(LaVina PD, Gated)
Park Central PD (Gated) Vista Lakes Tot
NorthLake Park Lot/Lakeshore Park
Randal Park P-1
(NorthLake Parkway (Gated)
Green) Randal Park P-2
Waters Edge Green
NorthLake Park N-1 SouthPort Pool #2 - Dock Park
(Magnolia Green) South
Westchester Open
Northlake Park N-1 , N-2 Stonebridge Commons Space/Green (601 Berks
(Dog Park) Open Space/Green Ct)
3. Accessibility Standard-Neighborhood Parks
Neighborhood parks are the most prevalent type of park facility in the City
and are designed to be accessed by walking or cycling. Due to the small
service areas of the Neighborhood Parks facilities, one (1) mile, there are
several areas within the City that are underserved, or are otherwise
located outside a 1-mile serve area of an existing Neighborhood Park
facility. Areas that are identified as underserved by Neighborhood Park
facilities when utilizing accessibility standards include, the Northwest (NW)
quadrant, the Southwest (SW) quadrant, a small portion of the Old
Southeast (Old SE) quadrant and areas within the New Southeast (New SE)
quadrant.
30 | P a g e
Revised Draft [8/22/2014]You can also read