Climate and Health Outlook - HHS.gov
←
→
Page content transcription
If your browser does not render page correctly, please read the page content below

Climate and Health Outlook                                                                                          ISSUED SEPTEMBER 2022

  The Climate and Health Outlook is an efort to inform health professionals and the public on how our health may be
  afected in the coming month(s) by climate events and provide resources to take proactive action. An associated
  webpage includes additional resources and information.

            Northern Great Plains Drought is favored to persist
            or develop in Nebraska as well as parts of Montana,
            North Dakota, South Dakota, and Wyoming. Above
            normal wildland fre* potential is projected for
            western Montana.

            Northwest: One county in Idaho is projected
            to have more than 5 heat exceedance days in
            September 2022. Drought is favored to persist
            in parts of southern Idaho, southern and central
            Oregon, and central Washington. Above normal
            wildland fre* potential is projected for much of
            Idaho, southern and central Oregon, and central
            and southern Washington.
                                                                                                Northeast: Drought is favored to persist in parts
                                                                                                of Connecticut, Maine, Massachusetts, New
            Southwest: Counties in California (10), Arizona
                                                                                                Hampshire, New Jersey, New York, Pennsylvania,
            (5), and Utah (2), are projected to have more than
                                                                                                Rhode Island, and Vermont. Drought is favored
            5 heat exceedance days in September 2022.
                                                                                                to develop in parts of Delaware. Above
            Drought is favored to persist in California, Nevada,
                                                                                                normal wildland fre* potential is projected
            and Utah as well as parts of Arizona Colorado, and
                                                                                                for Connecticut, Maine, Massachusetts, New
            New Mexico. However, drought removal is favored
                                                                                                Hampshire, Rhode Island, and Vermont, as well
            in southern and central Arizona and much of New
                                                                                                as eastern New York and the northern tips of New
            Mexico. Above normal wildland fre* potential
                                                                                                Jersey and Pennsylvania.
            is projected for northern California and
            north-western Nevada.

                                                                                                Southeast: The Atlantic basin is forecasted to
                                                                                                have an above-average hurricane season with
            Southern Great Plains: Counties in Texas (2) are
                                                                                                14 – 20 named storms with winds of 39 mph or
            projected to have more than 5 heat exceedance
                                                                                                higher, with 6 –10 of those possibly becoming
            days in September 2022. Drought is favored to
                                                                                                hurricanes with winds of 74 mph or higher, and
            persist in Kansas, much of Oklahoma and northern
                                                                                                3 – 5 possibly becoming major hurricanes with
            Texas. However, drought removal and improvement
                                                                                                winds of 111 mph or higher. One county in Florida
            is favored in most of Texas and eastern Oklahoma.
                                                                                                is projected to have more than 5 heat exceedance
            Above normal wildland fre* potential is projected
                                                                                                days in September 2022. Drought is favored
            for much of Oklahoma.
                                                                                                to develop in parts of North Carolina and South
                                                                                                Carolina. However, drought removal/improvement
                                                                                                is favored in parts of Arkansas, Mississippi,
                                                                                                and Tennessee.

    Drought               Heat               Hurricane               Wildfre

*Smoke from wildfres can impact health hundreds of miles from site of the fre.
A “heat exceedance day” is when the daily maximum temperature is above the 95th percentile value of the historical temperature distribution in that county.
Developed with data from the Centers for Disease Control and Prevention, National Oceanic and Atmospheric Administration, and National Interagency
Fire Center.

We want to hear from you! Please send your feedback on ways to improve the Climate and Health Outlook to ocche@hhs.gov.                                       1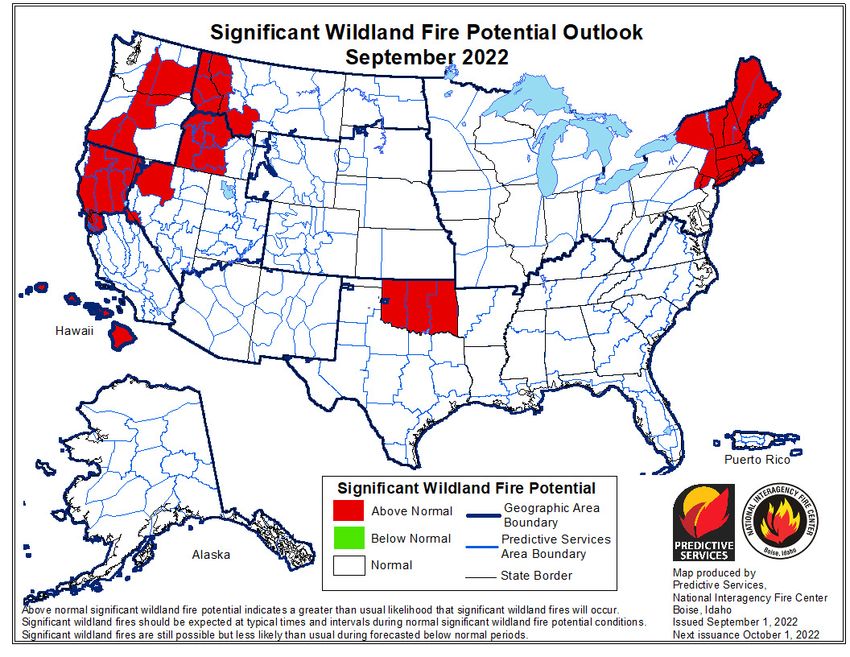
Climate and Health Outlook

                                                                       Who is at high risk in the counties
                                                                       with above-normal wildland fre
                                                                       potential in September?
                                                                       Wildland fres are occurring more frequently in the United
                                                                       States and present a health hazard for populations living
                                                                       close to a fre. As indicated in the map to the left, 312 coun-
                                                                       ties across 17 states are projected to have above-normal
                                                                       wildfre potential in August. In these counties, the total popu-
                                                                       lation at risk is 54,742,313 people:

                                                                         68 (22%) have a high number of people aged 65 or over,
                                                                         living alone.
                                                                         81 (26%) have a high number of people without health
                                                                         insurance
Figure. The National Signifcant Wildland Fire Potential Outlook
identifes areas with above, below, and near normal signifcant fre
                                                                         84 (27%) have a high number of uninsured children.
potential using the most recent weather, climate, and fuels data         60 (19%) have a high number of people with frequent
available. These outlooks are designed to inform decision makers for     mental distress.
proactive wildland fre management.
                                                                         103 (34%) have a high number of adults with asthma.
Year-to-date acres burned for the US is approximately
                                                                         61 (20%) have a high number of adults with coronary
116% of the 10-year average, with over half of the total
                                                                         heart disease.
acres burned in Alaska alone. Above normal signifcant
fre potential is forecast for much of the Northeast                      48 (16%) have a high number of people living in poverty.
September through November due to ongoing drought.                       114 (37%) have a high number of people with electricity-
Above normal potential is also forecast for much of                      dependent medical equipment and enrolled in the HHS
Oklahoma in September and October, expanding to                          emPOWER program.
include all of Oklahoma and Texas by December. Most                      42 (14%) have a high number of people in mobile homes.
of northern California, central and southwest Oregon,                    77 (25%) have a high number of people with one or more
southeast Washington, Idaho, and far western Montana                     disabilities.
will have above normal potential in September. Lee
                                                                         70 (23%) are identifed as highly vulnerable by CDC’s
sides of the Hawai’ian Islands will continue to have
                                                                         Social Vulnerability Index.
above normal potential through November before
                                                                         *“A high number” indicates that these counties are in the top quartile for
returning to normal potential in December.                               this indicator compared to other counties

   Wildfres Afect Health in Many Ways
   Wildland fre increases the risk for a diverse range of health outcomes from both the fre itself and smoke. For example:

            Due to the nature of their work, frefghters                             For pregnant people, smoke exposure
            are at risk of developing severe heat-                                  may increase the risk of reduced
            related illness (such as heat stroke) and                               birth weight and preterm birth.
            rhabdomyolysis (muscle breakdown).
                                                                                    Wildfre smoke may afect the immune
            Wildfre can cause burns through contact                                 system, potentially leading to increased
            with fames and hot surfaces as well as                                  vulnerability to lung infections
            chemical and electrical burns.                                          like COVID-19.
            Wildfre smoke can lead to disorders                                     Smoke from wildfres can travel downwind
            including reduced lung function, bronchitis,                            and afect air quality hundreds of miles away
            exacerbation of asthma, and cardiovascular                              from the fre.
            efects like heart failure.
We want to hear from you! Please send your feedback on ways to improve the Climate and Health Outlook to ocche@hhs.gov.                               2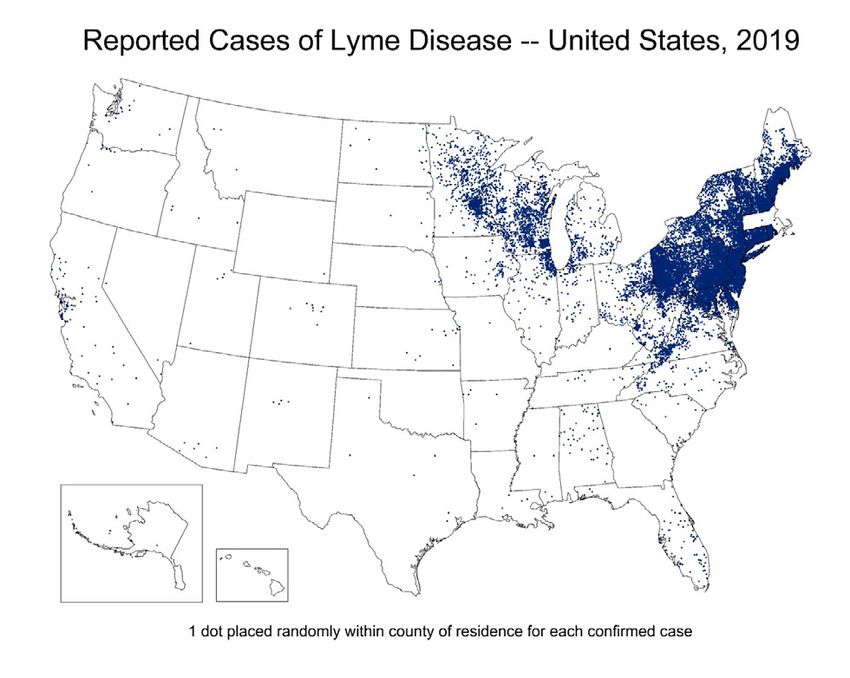
Climate and Health Outlook
Real-Time Tracking of Respiratory Outcomes Wildfre Smoke Can Travel Far Distances
Linked to Wildfre Smoke
2.0%
2018 Camp Fire 2018 Alert
Percent of Emergency Department Visits
1.5%
1.0%
0.5%
0.0%
1 3 5 7 9 11 13 15 17 19 21 23 25 27 29 31 33 35 37 39 41 43 45 47 49
Week of the Year
Figure. This graph overlays the percentage of Emergency Depart-
Figure: Example of the AirNow Fire and Smoke Map run by U.S. EPA
ment (ED) visits due to asthma or reactive airway disease (RAD) in
and the U.S. Forest Service. This screenshot, from September 15, 2020,
San Mateo County during the 2018 Camp Fire. It uses Morbidity and
shows the far distances smoke can travel from the location of wildfres.
Mortality Weekly Report weeks, which begin with 1 for the frst week The map also shows the U.S. Air Quality Index (AQI) from hundreds of
of the year. Each red dot indicates an instance where the percent of air quality monitors and more than 10,000 privately owned air sensors.
ED visits due to asthma or RAD is exceptionally high. You can learn Green symbols indicate a good AQI; yellow indicates moderate;
more on the CDC’s website. orange indicates unhealthy for sensitive groups; red indicates
As wildfres continue to threaten the public’s health unhealthy for everyone; and purple indicates very unhealthy. The
fame symbols indicate a large fre incident, and the small yellow
across the country, agencies are demonstrating the utility, spark symbols indicate unverifed satellite fre detections.
reliability, and timeliness of syndromic surveillance data for
monitoring and characterizing health impacts. During the Wildfre smoke can impact the health of people close
frst two weeks of the 2018 Camp Fire in California, there to the fre and at distances far from fre impacted
were higher-than-expected increases in 24-hour particulate areas, depending on meteorological conditions, such
matter (PM2.5) concentrations in San Mateo County, which as wind speed and direction. As wildfres burn, they
reached unhealthy levels. San Mateo County public health generate smoke that is comprised of a mixture of
ofcials monitored for acute respiratory health efects particulate matter (PM) (also referred to as particle
and, in collaboration with the CDC National Syndromic pollution) and gaseous pollutants (e.g., carbon
Surveillance Program and the California Department of monoxide). The pollutant of most concern to public
Public Health, they demonstrated an increase in the weekly health during a smoke event is fne particulate matter,
percentage of ED visits for asthma or reactive airway or PM2.5, because these particles can penetrate deep
disease (RAD) exacerbation, and an increase in the number into your lungs and cause adverse health efects.
of visits for smoke exposure or smoke inhalation. Among
participating EDs, the county’s safety net hospital had
the highest average daily percentage of ED visits for all Resources to Reduce Health Risks Associated with
respiratory syndromes, excluding infuenza-like illness and Wildfre and Smoke
pneumonia. The Ready.gov Wildfres site, Centers for Disease Control
and Prevention (CDC) Wildfres site, and Environmental
Protection Agency (EPA) Smoke-Ready Toolbox for Wildfres
include information about how to prepare for wildfres, stay
safe during a fre, and return home after a fre.
Pregnant people should take actions to reduce their
exposure to wildfre smoke, which could afect the
developing fetus. Other groups like young children, the
elderly, those with pre-existing heart and lung disease, and
outdoor workers also should take extra care to reduce their
exposures to wildfre smoke. Monitor fres and air quality
in your area through AirNow and follow instructions about
exercise and going outside for “sensitive individuals.”
Source: https://ww2.arb.ca.gov/protecting-yourself-wildfre-smoke
We want to hear from you! Please send your feedback on ways to improve the Climate and Health Outlook to ocche@hhs.gov. 3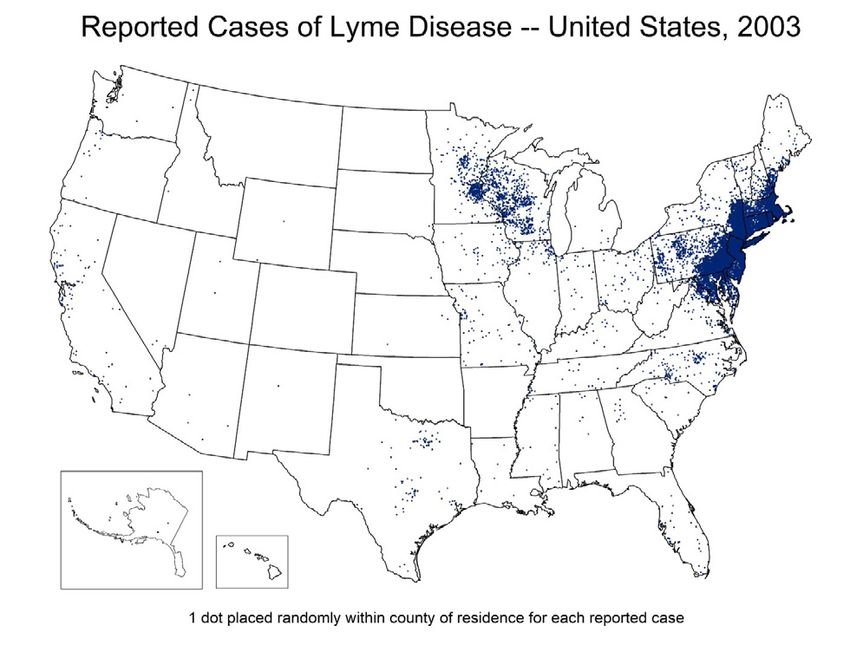
Climate and Health Outlook

    U.S. Monthly Drought Outlook
    Drought Tendency During the Valid Period
                                                       Valid for September 2022
                                                       Released August 31, 2022
                                                                                                   Who is at high risk in the counties
                                                                                                   projected to have drought in
                                                                                                   September?
                                                                                                   As indicated in the map to the left, 1294 counties across
                                                                                                   42 states are projected to have persistent/remaining
                                                          Depicts large-scale trends based
                                                          on subjectively derived probabilities
                                                          guided by short- and long-range
                                                          statistical and dynamical forecasts.
                                                          Use caution for applications that
                                                          can be affected by short lived events.
                                                          "Ongoing" drought areas are
                                                                                                   drought or drought development in September. In these
                                                                                                   counties, the total population at risk is 157,164,458 people
                                                          based on the U.S. Drought Monitor
                                                          areas (intensities of D1 to D4).

                                                                                                   and, of those, 1,612,440 people work in agriculture.
                                                          NOTE: The tan areas imply at least
                                                          a 1-category improvement in the
                                                          Drought Monitor intensity levels by
                                                          the end of the period, although

                                                                                                   Of these counties:
                                                          drought will remain. The green
   Author:                                                areas imply drought removal by the
   Adam Allgood                                           end of the period (D0 or none).
   NOAA/NWS/NCEP/Climate Prediction Center
                                                         Drought persists

                                                         Drought remains but improves

                                                         Drought removal likely

                                                         Drought development likely                  368 (29%) have a high number of people aged 65 or
                                                                                                     over, living alone.
                                                      http://go.usa.gov/3eZGd
                                                                                                     362 (28%) have a high number of people living in
                                                                                                     rural areas.
Figure: The National Weather Service Climate Prediction Center's
Monthly Drought Outlook is issued at the end of each calendar                                        247 (19%) have a high number of people living in poverty.
month and is valid for the upcoming month. The outlook predicts
whether drought will persist, develop, improve, or be removed                                        200 (16%) have a high number of people with frequent
over the next 30 days or so. For more information, please refer to                                   mental distress.
drought.gov.                                                                                         195 (15%) have a high number of adults with asthma.
For September, drought expansion is favored for portions                                             439 (34%) have a high number of people without
of the Plains and western Corn Belt. However, above-                                                 health insurance.
average rainfall in the southwest is favored, raising the                                            519 (40%) have a high number of uninsured children.
potential for further drought reduction across the southern
                                                                                                     187 (15%) have a high number of Black or African
Four Corners region from the Monsoon. Forecasted
                                                                                                     American persons.
heavy rain across Texas and the Gulf Coast states favors
further drought improvements and a potential for fooding.                                            320 (25%) have a high number of people with severe
Drought persistence remains favored across the Northeast                                             housing cost burden.
and drought conditions are favored to continue expanding                                             246 (19%) have a high number of people in mobile homes.
across Hawai’i. Drought conditions are favored to improve                                            251 (19%) have a high number of people with one or
across Puerto Rico.                                                                                  more disabilities.
Drought can have direct and indirect impacts on health –                                              301 (23%) are identifed as highly vulnerable by CDC’s
increasing incidence of illness among those living in the                                            Social Vulnerability Index.
afected area and worsening mental health outcomes as                                                 *“A high number” indicates that these counties are in the top quartile forthis
livelihoods are challenged.                                                                          indicator compared to other counties

        Drought Afects Health in Many Ways
        Drought increases the risk for a diverse range of health outcomes. For example:

                     Low crop yields can result in rising food                                                  If there isn’t enough water to fow,
                     prices and shortages, potentially leading                                                  waterways may become stagnant breeding
                     to malnutrition.                                                                           grounds for disease vectors like mosquitos
                                                                                                                as well as viruses and bacteria.
                     Dry soil can increase the number of
                     particulates like dust and pollen that are                                                 Drought’s complex economic consequences
                     suspended in the air, which can irritate the                                               can increase mood disorders, domestic
                     bronchial passages and lungs.                                                              violence, and suicide.
                     Dust storms can spread the fungus that                                                     Long-term droughts can cause poor-quality
                     causes coccidioidomycosis                                                                  drinking water and leave inadequate water
                     (Valley Fever).                                                                            for hygiene and sanitation.

We want to hear from you! Please send your feedback on ways to improve the Climate and Health Outlook to ocche@hhs.gov.                                                          4
Climate and Health Outlook

The Distribution of Lyme Disease                                      Which Seasons Are People Most Often Bitten by
                                                                      Blacklegged Ticks?

                                                                      Figure: Emergency department (ED) visits for tick bites by month for
                                                                      2020 – 2022. This graph shows 2022 following a similar pattern to
                                                                      previous years, with tick bites spiking in the spring. If this trend con-
                                                                      tinues, there may also be a second, smaller spike in the fall
                                                                      In areas in the eastern US where Lyme disease cases are
                                                                      common, people are most likely to be bitten by black-
                                                                      legged ticks at two times of year: from April through July
                                                                      when nymphs are active, and in September through
                                                                      November when adults are active. Nymphal ticks, which
                                                                      feed in late spring and early summer, pose a particularly
                                                                      high risk due to their abundance and small size (about the
                                                                      size of a poppy seed), which makes their detection difcult.
                                                                      However, adult deer ticks can also transmit the infection
                                                                      and may be more likely to be infected themselves. How-
                                                                      ever, owing to their larger size (about the size of sesame
                                                                      seed), adult ticks are often detected and removed from
                                                                      people before disease transmission can occur. Lyme dis-
Figure: Lyme disease occurs primarily in the upper midwestern,        ease can be prevented by avoiding tick bites and prompt
mid-Atlantic, and northeastern United States. It is transmitted by    removal of ticks on people.
blacklegged or “deer” ticks, which also transmit the agents of ana-
plasmosis, babesiosis and Powassan virus disease. The lack of dots
in Massachusetts in 2018 is due to a diference in reporting stan-
dards, not an absence of Lyme disease.
An estimated 476,000 Americans are diagnosed and
treated for Lyme disease each year. It is the most common
vector-borne disease in North America. The incidence
of Lyme disease in the United States has nearly doubled               Figure: The diferent sizes of the blacklegged tick through 4 stages:
                                                                      egg, larvae, nymph, and adult.
since 1991, from 3.74 reported cases per 100,000 people
to 7.21 reported cases per 100,000 people in 2018. Maine,
Vermont, and New Hampshire have experienced the                       Resources to Reduce Health Risks Associated with
largest increases in reported case rates. Climate is one              Lyme Disease
of several factors that defne when and where Lyme and                 The Centers for Disease Control and Prevention (CDC)
other tickborne diseases are most likely to occur. Mild win-          Lyme Disease site has information on how to avoid Lyme
ters and warmer early spring temperatures are expanding               Disease, common symptoms, and treatment. The Tick Bite
the seasons when ticks are active, resulting in more weeks            Bot can assist you in removing attached ticks and seeking
of the year that Americans are at risk of tick encounters.            health care, if appropriate, after a tick bite. CDC’s
Expansion of the range of infected ticks puts an increasing           Tickborne Diseases of the United States ofers information
number of communities at risk for Lyme and other tick-                on tick identifcation, tickborne diseases, and treatment.
borne diseases.
We want to hear from you! Please send your feedback on ways to improve the Climate and Health Outlook to ocche@hhs.gov.                           5
Climate and Health Outlook

                     THANK YOU to the partners who provide
                     invaluable information, expertise, and data
                      for the Climate and Health Outlook series:

We want to hear from you! Please send your feedback on ways to improve the Climate and Health Outlook to ocche@hhs.gov.   6


You can also read