Climate Change Impacts on Extreme Flows Under IPCC RCP Scenarios in the Mountainous Kaidu Watershed, Tarim River Basin

Page created by Willie Barton
 
CONTINUE READING
Climate Change Impacts on Extreme Flows Under IPCC RCP Scenarios in the Mountainous Kaidu Watershed, Tarim River Basin
sustainability

Article
Climate Change Impacts on Extreme Flows
Under IPCC RCP Scenarios in the Mountainous
Kaidu Watershed, Tarim River Basin
Yue Huang 1,2,3 , Yonggang Ma 4, *, Tie Liu 1,2,3       and Min Luo 5
 1    State Key Laboratory of Desert and Oasis Ecology, Xinjiang Institute of Ecology and Geography,
      Chinese Academy of Sciences, Urumqi 830011, China; huangy@ms.xjb.ac.cn (Y.H.); liutie@ms.xjb.ac.cn (T.L.)
 2    Key Laboratory of GIS & RS Application Xinjiang Uygur Autonomous Region, Urumqi 830011, China
 3    University of Chinese Academy of Sciences, Beijing 100049, China
 4    College of Resources and Environment Science, Xinjiang University, Urumqi, Xinjiang 830046, China
 5    College of Geographical Science, Inner Mongolia Normal University, Hohhot 010022, China;
      luomin_1990@126.com
 *    Correspondence: mayg@xju.edu.cn
                                                                                                       
 Received: 13 January 2020; Accepted: 4 March 2020; Published: 9 March 2020                            

 Abstract: In the 21st century, heavier rainfall events and warmer temperatures in mountainous regions
 have significant impacts on hydrological processes and the occurrence of flood/drought extremes.
 Long-term modeling and peak flow detection of streamflow series are crucial in understanding the
 behavior of flood and drought. This study was conducted to analyze the impacts of future climate
 change on extreme flows in the Kaidu River Basin, northwestern China. The soil water assessment
 tool (SWAT) was used for hydrological modeling. The projected future precipitation and temperature
 under Intergovernmental Panel on Climate Change (IPCC) representative concentration pathway
 (RCP) scenarios were downscaled and used to drive the validated SWAT model. A generalized
 extreme value (GEV) distribution was employed to assess the probability distribution of flood events.
 The modeling results showed that the simulated discharge well matched the observed ones both in
 the calibration and validation periods. Comparing with the historical period, the ensemble with
 15 general circulation models (GCMs) showed that the annual precipitation will increase by 7.9–16.1%
 in the future, and extreme precipitation events will increase in winter months. Future temperature
 will increase from 0.42 ◦ C/10 a to 0.70 ◦ C/10 a. However, with respect to the hydrological response to
 climate change, annual mean runoff will decrease by 21.5–40.0% under the mean conditions of the
 four RCP scenarios. A reduction in streamflow will occur in winter, while significantly increased
 discharge will occur from April to May. In addition, designed floods for return periods of five, 10 and
 20 years in the future, as predicted by the GEV distribution, will decrease by 3–20% over the entire
 Kaidu watershed compared to those in the historical period. The results will be used to help local
 water resource management with hazard warning and flood control.

 Keywords: distributed hydrological model; climate change; water resources; extreme events

1. Introduction
     The increased frequency and magnitude of extreme climate events under climate change has
been one of the biggest challenges to human societies [1]. Many researchers have indicated that
climate change will change hydrological cycles and have a severe impact on the availability of
water resources and the occurrence of hydrological extremes [2]. Particularly in northwestern China,
many rivers are recharged by snow melt [3]. Previous studies have shown that, hydrological processes
of several main basins in Tianshan and Kunlun Mountains have been significantly influenced by climate

Sustainability 2020, 12, 2090; doi:10.3390/su12052090                        www.mdpi.com/journal/sustainability
Climate Change Impacts on Extreme Flows Under IPCC RCP Scenarios in the Mountainous Kaidu Watershed, Tarim River Basin
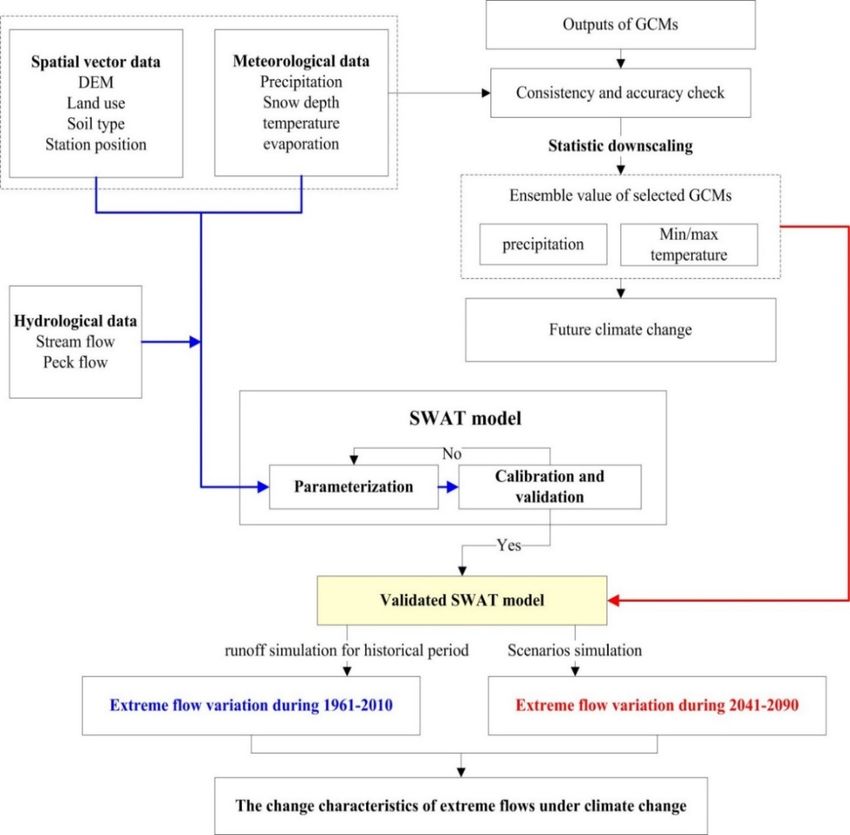
Sustainability 2020, 12, 2090                                                                         2 of 23

change [4]. Extreme precipitation events have the potential to aggravate floods and droughts [5–7],
while the continuous rise in air/surface temperature may lead to the increasing snow melting and
evapotranspiration (ET) in such mountainous river basins [8]. Understanding variations in historical
discharge extremes and evaluating future changes will greatly contribute to flood hazard control and
water resource management in inland river basins [9,10].
      Hydrological models play an important role in modern water resource management [11]. Climate
change impacts on the hydrological cycle can be investigated by integrating projected future scenarios
based on downscaled general circulation models (GCM) data in hydrological models [12]. Considerable
uncertainties exist in climate change impacts on hydrological systems. Moreover, compared to the
effects of climate change on average conditions, changes in extremes are much more uncertain [13].
The uncertainties reside primarily in GCM, GCM initial conditions, future emission scenarios,
downscaling techniques, and the structure of hydrological models and their parameters. However, it is
difficult to address these sources of uncertainty effectively, and it is particularly difficult to handle
all of them at the same time through effective methods [14]. Kay et al. [15] found that the GCM
structure is the most significant uncertainty source when compared to the uncertainties originating from
emission scenarios, GCM initial conditions, downscaling techniques, hydrological model structures,
and hydrological model parameters. Chen et al. [16] also showed that the choice of GCM is the major
uncertainty contributor. Najafi et al. [17] indicated that the uncertainties associated hydrologic model
was larger than GCM. Dams et al. [13] indicated that the uncertainty due to climate change scenarios
is larger than the uncertainty introduced by the structure of hydrological models. To reduce the
uncertainty in climate predictions [2], simplifications in GCM and downscaling methods [1,18,19]
as well as ensemble methods of climate change scenarios have been commonly used to simplify the
GCM outputs [20]. Several types of GCM ensemble have been used in recent studies [12], such as the
arithmetic ensemble means (AEMs), the Bayesian model average (BMA), and the reliability ensemble
average (REA) methods. Ntegeka et al. [20] described and used tailored climate change scenarios to
limit the number of future scenarios. Hosseinzadehtalaei et al. [21] calculated the response of extreme
precipitation to future climate change through sensitivity and uncertainty analysis on GCM, initial
conditions of the GCM and representative concentration pathways (RCPs). However, the source and
contribution of uncertainties in the context of climate change and the inherent impact on hydrology are
regionally dependent, and more in-depth research is needed [22].
      In China, most studies analyzing the climate change impact on extreme floods have focused on
several major rivers in the southern and southeastern parts of the country [23]. Recently, the annual and
seasonal changes of extreme hydrological events in inland rivers of northwestern China have attracted
increasing attention as well. However, few studies have been performed to examine the impact of
climate change in this region [24]. The Tarim River is located in northwestern China and is the longest
inland river in the country [25]. Under the dual influence of climate change and human activities,
the hydrological cycle in the headwater regions has been severely changed. Indeed, some upstream
rivers have completely ceased flowing [26]. Currently, only four rivers, namely the Kaidu, Aksu,
Hotan, and Yarkand Rivers, flow to the main stream of the Tarim River [27]. Among these source
streams, water resources from the Kaidu River passing through Bosten Lake are the most important
supplement of the lower Tarim River [11]. Therefore, the analysis and prediction of the runoff of the
Kaidu River are essential for water resource management and disaster warnings [28].
      Previous studies of the hydrological cycle in the Tarim River have mainly focused on fractal patterns
of runoff, trends and change point detection based on annual or monthly streamflow data [29–32].
Few studies have been conducted on extreme hydrological events due to the lack of essential daily data
sets [33]. Hydrological models can simulate the variability in runoff at different space-time scales and fill
the data gaps of conventional observation stations, particularly at the daily or hourly scales [8]. Recent
studies have evaluated the climate change impacts on the hydrology of the Tarim River headstreams
using hydrological models. Liu et al. [34] investigated the impacts of climate change on the hydrology
of three upstream catchments of the Tarim River using the variable infiltration capacity (VIC) model.
Climate Change Impacts on Extreme Flows Under IPCC RCP Scenarios in the Mountainous Kaidu Watershed, Tarim River Basin
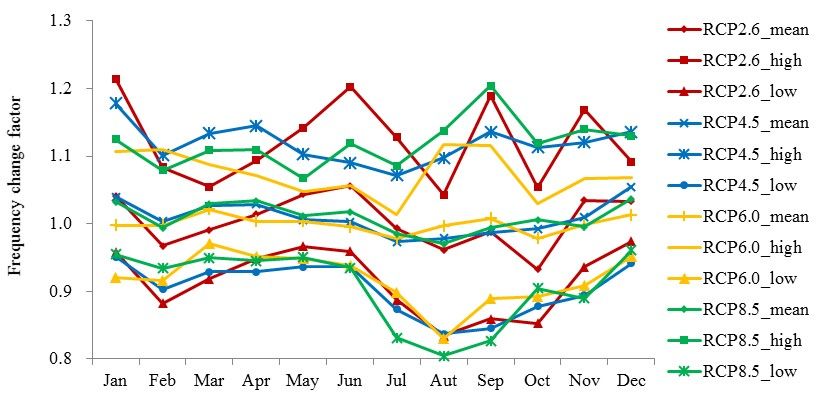
Sustainability 2020, 12, 2090                                                                                                         3 of 23

Liu et al. [35] used both lumped and distributed hydrological models to assess the climate change
impact on hydrology under emission scenarios (SERS) of the IPCC through 2050 s. Ma et al. [36]
     Sustainability 2020, 12, x FOR PEER REVIEW                                                                                  3 of 23
analyzed the response of snowmelt runoff to future climate in the Kaidu watershed by coupling
GCMinfiltration
       outputs with         the (VIC)
                     capacity     snowmelt model. runoff
                                                     Liu etmodel
                                                               al. [35](SRM).     Meng
                                                                          used both         et al. [37]
                                                                                        lumped           found thathydrological
                                                                                                   and distributed       climatologically
parameters     are   contributing         to 92%    of the    runoff    variability,    and
     models to assess the climate change impact on hydrology under emission scenarios (SERS)  human     activity    was    responsible
                                                                                                                                 of the for
7.72%   of the
     IPCC        runoff
            through        change
                         2050   s. Ma in   the[36]
                                        et al.   Aksu     watershed.
                                                    analyzed               Liu etofal.
                                                                  the response           [38,39] coupled
                                                                                      snowmelt     runoff to an    average
                                                                                                               future  climate ensemble
                                                                                                                                 in the     of
     Kaidu watershed
18 available     GCMs with   by coupling       GCM outputs
                                    a well-calibrated            withSystem
                                                              Mike      the snowmelt      runoff model
                                                                                 Hydrological               (SRM).(MIKE
                                                                                                     European        Meng etSHE)al. [37]
                                                                                                                                       model
     found that climatologically
and simulated        hydrological processesparameters      are contributing
                                                       under      future climateto 92%     of thescenarios.
                                                                                       change     runoff variability,    and human
                                                                                                                Their results      indicated
that snow storage at high altitudes will decrease due to increasing evaporation, whichal.
     activity   was    responsible      for  7.72%    of  the   runoff   change    in  the   Aksu   watershed.     Liu  et      [38,39]
                                                                                                                             will   therefore
     coupled an average ensemble of 18 available GCMs with a well-calibrated Mike System Hydrological
decrease the available water in the downstream region.
     European (MIKE SHE) model and simulated hydrological processes under future climate change
     Through previous studies, the mechanism of climate change impacts on the hydrology of the
     scenarios. Their results indicated that snow storage at high altitudes will decrease due to increasing
Tarimevaporation,
       headstreams         has will
                       which     beentherefore
                                         gradually     recognized
                                                   decrease              [34,35,38–40].
                                                                the available   water in the However,
                                                                                                 downstreamresearch   on extreme runoff
                                                                                                                  region.
prediction    is   still lacking      [41].    Variations      and    tendencies       of  extreme
           Through previous studies, the mechanism of climate change impacts on the hydrology         flow     events   underofhistorical
                                                                                                                                     the
and Tarim
     futureheadstreams
                climate change   has beenscenarios      have
                                                gradually        not been[34,35,38–40].
                                                              recognized       investigated.        Previous
                                                                                                However,           studies
                                                                                                              research   on have
                                                                                                                              extreme  shown
that the  frequency
     runoff    prediction  and is intensity
                                   still lacking of extreme      floods and
                                                    [41]. Variations        in the   Kaidu River
                                                                                 tendencies           have increased
                                                                                                of extreme      flow events  over    the past
                                                                                                                                 under
     historical
decades    [28,42].andTherefore,
                         future climate  the change
                                               objective scenarios
                                                             of thishave      not been
                                                                        research     is toinvestigated.     Previous studies
                                                                                             assess the potential        effects have
                                                                                                                                    of future
climate change on extreme floods in the upper Kaidu River and to use the advances over
     shown    that   the  frequency      and   intensity   of  extreme    floods  in  the  Kaidu   River  have   increased   noted   theabove
     past decades [28,42]. Therefore, the objective of this research is to assess the potential effects of future
to enhance our understanding of future climate change and local hydrology variations. The SWAT
     climate change on extreme floods in the upper Kaidu River and to use the advances noted above to
model is used to simulate river runoff. The uncertainty in runoff projections related to GCMs and
     enhance our understanding of future climate change and local hydrology variations. The SWAT
RCP model
      scenarios     are also investigated. Finally, the variation in flow extremes is revealed by a frequency
              is used to simulate river runoff. The uncertainty in runoff projections related to GCMs and
analysis
     RCP model.
           scenariosThe       obtained
                         are also            resultsFinally,
                                    investigated.      will bethe  used    to help
                                                                      variation       localextremes
                                                                                  in flow     water authorities
                                                                                                       is revealed by establish
                                                                                                                         a frequency effective
floodanalysis
       controlmodel.
                  policies The and   thus improve
                                  obtained                water
                                               results will         resource
                                                               be used          security
                                                                          to help            in theauthorities
                                                                                    local water      region. establish effective
      flood control policies and thus improve water resource security in the region.
2. Study Area
      2. Study Area
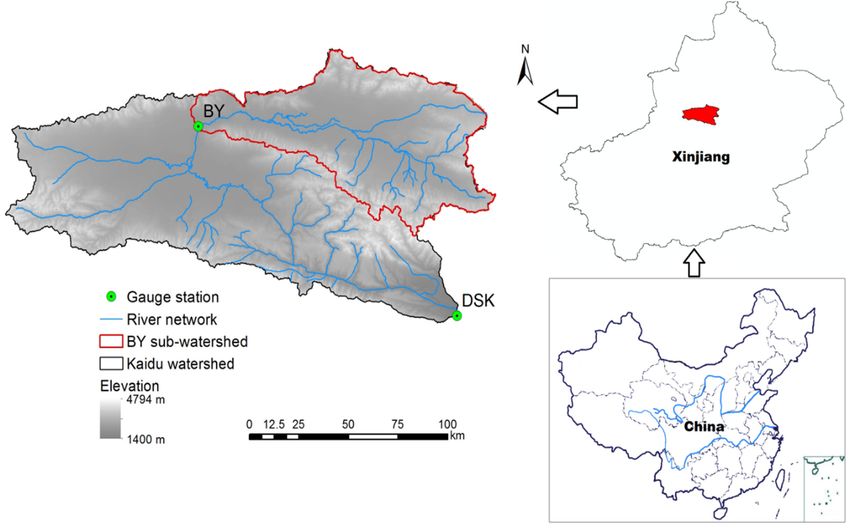
     The Kaidu watershed is located in the northeast Tarim River Basin and has an area of 1.90 × 10⁴ km2
(Figure 1).The Kaidu
             The      watershed
                  elevation       is located
                              of the   Kaiduinwatershed
                                                the northeast Tarimfrom
                                                           ranges     River1400
                                                                            Basinmand
                                                                                    to has
                                                                                       4794anm.
                                                                                              area of 1.90
                                                                                                 The   land× 104
                                                                                                             cover   is
     km (Figure
dominated
         2        1). Themeadow
             by alpine    elevationandof the Kaidu watershed
                                          grassland           ranges from
                                                      (81%), followed       1400 m to
                                                                        by surface     4794 bodies
                                                                                     water  m. The land
                                                                                                    (8%),cover
                                                                                                           bare rock
     is dominated
(9.5%), and forestby   alpine The
                     (1.5%).   meadow
                                    soilsand   grassland
                                           in this region(81%), followed
                                                          include          by surface
                                                                    fine and  coarse water
                                                                                       sand, bodies
                                                                                             loamy(8%),
                                                                                                      sand,bare
                                                                                                             slit clay
     rock (9.5%), and forest (1.5%). The soils in this region include fine and coarse sand, loamy sand, slit
loam, sandy loam, loam, and rock [11].
      clay loam, sandy loam, loam, and rock [11].

                        Figure
                     Figure    1. Study
                            1. Study    areaofofthe
                                      area       theKaidu
                                                    Kaidu watershed
                                                          watershed with
                                                                     withdischarge gauging
                                                                           discharge       stations.
                                                                                     gauging   stations.

         Instudy
    In the  the study
                  area,area, meteorological
                         meteorological  andand  hydrologicalobservations
                                               hydrological   observations began
                                                                            began in
                                                                                   in the
                                                                                      the mid-1950s.
                                                                                           mid-1950s.There
                                                                                                      There are
two meteorological stations. One is the Bayblk (BYBLK) station, located in the upper reachesofof the
    are two  meteorological  stations. One is the Bayblk (BYBLK)  station, located in  the upper reaches
Climate Change Impacts on Extreme Flows Under IPCC RCP Scenarios in the Mountainous Kaidu Watershed, Tarim River Basin
Sustainability 2020, 12, 2090                                                                       4 of 23

Kaidu River with an elevation of 2500 m, and the other is the Dashankou (DSK) station with an
elevation of 1500 m, located at the outlet of the Kaidu watershed. The climate is typical of mountainous
environments in arid regions, with sparse precipitation, low temperature and high evaporation.
Average annual precipitation in the study area is approxmately 384 mm/year, and more than 80%
of the total precipitation is distributed from May to September. The annual average temperature
is approximately −4.16 ◦ C, and the mean temperature in Summer is 9.8 ◦ C. Pan evaporation is
approximately 1157 mm/year, which is much higher than the precipitation in the region. And regional
average actual ET is approximately 193 mm/year [43]. Snowmelt is the most important source of
water in spring. Several studies have indicated that precipitation and temperature have increased
significantly during the past 50 years, especially since 1990 [35].
      Hydrological observation also conducted at the BYBLK and DSK stations. Drainage area
controlled by the BYBLK station is 6.65 × 10³ km2 , and the drainage area controlled by the DSK station
is 19.01 × 10³ km2 . There are two flood seasons in spring and summer in Kaidu River. Spring flow
peaks occur in April to May due to the melting of snow. Summer flooding results from the combined
output of rainfall and snowmelt in high-altitude regions [44]. The river flood events not only represent
destructive natural hazards in the mountainous region but also affect the lower reaches of the Tarim
River [28]. Therefore, runoff prediction and flood risk assessment are essential for water resource
management and flood control in the study area.

3. Data and Methodology

3.1. Data Availability
     A digital elevation model (DEM) with 90 × 90 m resolution, land use/cover, and soil types were
used to set up the hydrological model. Land use and land cover map in 2010 based on Landsat Thematic
Mapper (TM) images were processed by the Xinjiang Institute of Ecology and Geography, Chinese
Academy of Sciences (XIGE) [26]. Four land cover types (i.e., meadow, forest, rock, and surface water
body) were detected in the Kaidu watershed and used for hydrological simulations. The soil in the
study area was classified into seven types. Related physical parameters for each soil type were defined
according to the FAO soil property reference [39]. The initial soil physical parameters (e.g., hydraulic
conductivity, available water capacity) for each soil type were obtained by using the SPAW software
developed by USDA (Saxton and Rawls, 2006).
     Daily discharges at the DSK and BYBLK hydrological stations were collected from 1996 to 2011.
Daily air temperatures, precipitation, humidity, and wind speed at the BYBLK and DSK stations from
1961 to 2011 were collected from the Tarim River Management Bureau (TRMB).
     The daily precipitation and temperature outputs of 32 GCMs were downloaded from the dataset
of Phase 5 of the Coupled Model Inter-comparison Project (CMIP5) [35,39].

3.2. Methodology

3.2.1. Hydrological Modeling
     The SWAT model is a physically distributed hydrological model that has been widely used to
assess the impacts of climate change and human activities on water [37,45]. To simplify the watershed
and facilitate calculation, the study area was divided into 22 subbasins with 271 hydrologic response
units (HRUs) based on land use, soil type, and slope.

                                               t
                                               X
                                SCti = SC0 +         (Pdayi − Qsur fi − Eai − Vseepi − Q gwi )         (1)
                                               i=1

where SCti is the soil water content (mm) at time t, SC0 is the initial water content (mm), t is the
simulation period (days), Pdayi is the precipitation on the ith day (mm), Qsur fi is the surface runoff on
Climate Change Impacts on Extreme Flows Under IPCC RCP Scenarios in the Mountainous Kaidu Watershed, Tarim River Basin
Sustainability 2020, 12, 2090                                                                         5 of 23

the ith day (mm), Eai is ET on the ith day (mm), Vseepi is the water entering the vadose zone from the
soil profile on the ith day (mm), and Q gwi is the base flow on the ith day (mm).
      Surface runoff was simulated using the soil conservation service (SCS) curve numbers (USDA-SCS,
1972) in SWAT. Redistribution of water between soil layers was calculated using a kinematic storage
model. The underground flow was calculated as a function of the saturated hydraulic conductivity.
The Muskingum routing method was applied to calculate the channel flow routing, and the model
used a degree-day approach to estimate snow accumulation and melting.
      The FAO Penman–Monteith method and Hargreaves method were used to estimate ET. Daily
precipitation, temperature, wind speed, and relative humidity data were obtained from the BYBLK and
DSK stations during the historical period (i.e., 1960–2010), and the solar radiation inputs were generated
using the built-in SWAT stochastic weather generator based on data from nearby weather gauges.
PET and ET, calculated according to the Penman–Monteith method, were close to those reported in
the literature [43]. However, only temperature can be used to calculate PET in future periods because
of the higher uncertainties in the GCM outputs for the additional variables. Therefore, we used PET
calculated via the Penman–Monteith method as a standard value and calibrated the parameters of the
Hargreaves method, which is only based on temperature and geographical location [46]. The calibrated
Hargreaves method also showed reasonable PET results in the study area. Therefore, the PET data
were calculated according to the calibrated Hargreaves method for both historical and future periods.
      The sequential uncertainty fitting (SUFI-2) program version 2 embedded in the SWATCUP
software [47] was used for sensitivity analysis and model calibration. The T-states and p-values
of the parameters were used before and after improving the statistical model to obtain parameter
sensitivity [48,49]. The period from 1996 to1997 was chosen as the spin-up period, while calibration
and validation periods were from 1998 to 2007 and 2008 to 2010, respectively. Daily discharge data
from the BYBLK and DSK stations were applied for model validation. The Nash–Sutcliffe coefficient
(NS), water balance bias (WB) and correlation coefficient (R) were applied to evaluate the simulation
accuracy [50].
                                                             (qo,i − qs,i )2
                                                   Pn
                                       NS = 1 − Pi=1                        2                         (2)
                                                        n
                                                        i=1    qo,i −    q o
                                                              Pn
                                                                 i=1 qo,i − qs,i
                                   WB = 100% × (1 −               Pn                                    (3)
                                                                      i=1 qo,i
                                             Pn                                
                                              i=1  q o,i −   qo    q s,i −    q s
                               R=                          1
                                                                                                        (4)
                                    Pn                
                                                       2 2 Pn
                                                                                  2  21
                                      i=1 qo,i − qo              i=1 qs,i − qs

where qo,i is the observed discharge at the time step i, qs,i is modeled discharge at the time step i, qo is
the mean observed discharge, and n is the total number of time steps. With the calibrated parameters,
validation was performed using daily discharge data from the BYBLK and DSK stations.

3.2.2. Downscaling of Future Climate Scenarios
      The global climate is a complex system; therefore, when global climate and regional models
(e.g., GCMs and RCMs) are used to model the climatic system, considerable simplification must be
conducted in the description of physical processes [51]. To incorporate the uncertainty of social actions,
a range of future greenhouse gases (GHG) scenarios is taken into consideration [12]. Multimodel
ensemble simulations using RCMs and GCMs have been shown to outperform individual models and
can be used to more accurately model a given property through the provision of a large sample size,
e.g., of a climatological mean of the frequency of a rare event [1].
      Monthly precipitation totals and temperature were selected for intercomparison and assessment
of the performance of GCMs. For average annual precipitation, monthly precipitation, and mean
Climate Change Impacts on Extreme Flows Under IPCC RCP Scenarios in the Mountainous Kaidu Watershed, Tarim River Basin
Sustainability 2020, 12, 2090                                                                                                    6 of 23

monthly temperature, the similarities between the GCM and observational data are quantified in terms
of the root-mean-square relative error (RMSRE) and the relative bias (BIAS) which detail described in
Liu etSustainability
       al. [35]. Further,        they are calculated by using the observed climate data at BYBLK station
                     2020, 12, x FOR PEER REVIEW
                                                                                                                                   as the
                                                                                                                             6 of 23
referenced baseline. The period ranging from 1961 to 2000 was considered for the GCM control runs
(CN) as   well asin
      described      forLiu
                          theet observation      datathey
                                al. [35]. Further,     at the
                                                           are BYBLK    station.
                                                               calculated  by usingIn the
                                                                                       general,    the climate
                                                                                            observed     GCMs present        acceptable
                                                                                                                  data at BYBLK
      station  as   the  referenced    baseline.   The  period  ranging  from   1961   to 2000   was
results; the mean annual temperature BIAS is 12.2%, and the RMSREs are less than 6%. For precipitation,considered   for  the  GCM
BIAS control
      ranges runsfrom(CN) −36%  as to
                                    well
                                      98% as at
                                              forthe
                                                  theyearly
                                                       observation
                                                               scale,data
                                                                      and atthethe  BYBLK station.
                                                                                 RMSREs       of annual  In general,   the GCMs
                                                                                                             precipitation       exceeds
      present   acceptable      results; the  mean    annual  temperature    BIAS   is 12.2%,  and   the
18%. The climate models are less reliable and consistent in predicting precipitation variations than in   RMSREs     are  less  than
      6%. For precipitation, BIAS ranges from −36% to 98% at the yearly scale, and the RMSREs of annual
describing temperature variations at the monthly scale.
      precipitation exceeds 18%. The climate models are less reliable and consistent in predicting
     In addition, extreme precipitation events may be the main cause of extreme flow, especially
      precipitation variations than in describing temperature variations at the monthly scale.
in Summer.          Therefore,
            In addition,      extremeweprecipitation
                                          performed events a comparison
                                                                  may be theof    thecause
                                                                                main     probability
                                                                                               of extreme  distributions
                                                                                                              flow, especiallyto inassess
the performance
      Summer. Therefore, we performed a comparison of the probability distributions to assess theruns,
                          of  the   GCMs       in  simulating      precipitation     events    [36,37].      For   each    GCM
extreme    precipitation
      performance        of the sequence        were extracted
                                  GCMs in simulating                 basedevents
                                                            precipitation      daily[36,37].
                                                                                        precipitation
                                                                                               For each GCM series,runs,
                                                                                                                      andextreme
                                                                                                                             when the
precipitation     bigger
      precipitation          than 0.1
                         sequence     weremm/day
                                             extracted were
                                                         basedselected   as a wet day
                                                                 daily precipitation        [35].and
                                                                                         series,    The    cumulative
                                                                                                        when                distributed
                                                                                                                the precipitation
      biggerofthan
functions              0.1 mm/day
                   extreme              were selected
                                 precipitations       are as  a wet day
                                                           shown          [35]. The
                                                                     in Figure     2. cumulative
                                                                                          The black    distributed   functions offrom
                                                                                                          line is calculated
      extreme
observed     data precipitations
                      from 1961 are   to shown
                                          2000 atin BYBLK
                                                       Figure 2.station,
                                                                  The blackandlinethe
                                                                                   is calculated
                                                                                         grey lines from areobserved    data from
                                                                                                               calculated      from the
      1961   to  2000    at BYBLK     station,   and   the  grey  lines are  calculated
selected GCM extreme precipitation series. After examining the consistency between the GCM from   the   selected  GCM      extreme
      precipitation series. After examining the consistency between the GCM monthly total precipitation
monthly total precipitation and observation data at the BYBLK station, and also a comparison
      and observation data at the BYBLK station, and also a comparison of the probability distributions of
of the probability distributions of extreme precipitation events, 15 GCMs with a total of
      extreme precipitation events, 15 GCMs with a total of 31 runs (i.e., CNRM-CM5_r1i1p1, EC-
31 runs    (i.e., CNRM-CM5_r1i1p1,
      EARTH_12i1p1,          EC-EARTH_r8i1p1,       EC-EARTH_12i1p1,
                                                       MIROC-ESM_r1i1p1,EC-EARTH_r8i1p1,
                                                                                 MIROC-ESM-CHEM_r1i1p1,      MIROC-ESM_r1i1p1,
                                                                                                                       MPI-ESM-
MIROC-ESM-CHEM_r1i1p1,
      LR_r1i1p1, MPI-ESM-LR_r2i1p1,        MPI-ESM-LR_r1i1p1,
                                                    MPI-ESM-MR_r1i1p1,    MPI-ESM-LR_r2i1p1,
                                                                                MRI-CGCM3_r1i1p1, MPI-ESM-MR_r1i1p1,
                                                                                                             bcc-csm1-1_r1i1p1,
MRI-CGCM3_r1i1p1,
      bcc-csm1-1-m_r1i1p1,     bcc-csm1-1_r1i1p1,
                                     BNU-ESM_r1i1p1,      bcc-csm1-1-m_r1i1p1,          BNU-ESM_r1i1p1,
                                                              CanESM2_r1i1p1, CanESM2_r2i1p1,                     CanESM2_r1i1p1,
                                                                                                              CanESM2_r3i1p1,
CanESM2_r2i1p1,
      CanESM2_r4i1p1,   CanESM2_r3i1p1,
                                  CanESM2_r5i1p1, CanESM2_r4i1p1,
                                                           CCSM4_r1i1p1,CanESM2_r5i1p1,
                                                                                CCSM4_r2i1p1,    CCSM4_r1i1p1,        CCSM4_r2i1p1,
                                                                                                        CESM1-CAM5_r1i1p1,
      FGOALS-g2_r1i1p1,             GFDL-CM3_r1i1p1,           GFDL-ESM2G_r1i1p1,
CESM1-CAM5_r1i1p1, FGOALS-g2_r1i1p1, GFDL-CM3_r1i1p1, GFDL-ESM2G_r1i1p1,                     IPSL-CM5A-LR_r1i1p1,             IPSL-IPSL-
      CM5A-LR_r2i1p1,              IPSL-CM5A-LR_r3i1p1,             IPSL-CM5A-LR_r4i1p1,
CM5A-LR_r1i1p1, IPSL-CM5A-LR_r2i1p1, IPSL-CM5A-LR_r3i1p1, IPSL-CM5A-LR_r4i1p1, IPSL-                  IPSL-CM5A-MR_r1i1p1,
      MIROC5_r1i1p1, MIROC5_r2i1p1), were acceptable. In general, it is an ensemble of the prediction
CM5A-MR_r1i1p1,             MIROC5_r1i1p1, MIROC5_r2i1p1), were acceptable. In general, it is an ensemble
      results from different GCM (and the results from the same GCM with different initial conditions,
of the prediction results from different GCM (and the results from the same GCM with different initial
      initialization method and perturbed physics [52].
conditions, initialization method and perturbed physics [52].

                       Figure 2. Cumulative
                           Figure             distribute
                                  2. Cumulative distributefunction  of extreme
                                                           function of extremeprecipitation
                                                                               precipitation  events.
                                                                                            events.

    Changes   in precipitation
         Changes                  and
                   in precipitation   temperature
                                    and temperature under     the future
                                                       under the   futureclimate
                                                                           climate   were
                                                                                  were      extracted
                                                                                         extracted  fromfrom
                                                                                                          the the
simulation results
     simulation    of the
                results     GCMs
                        of the GCMsand applied
                                     and appliedtotothe
                                                     the observed   recordsover
                                                         observed records    over
                                                                                thethe  historical
                                                                                     historical    period
                                                                                                period      at the
                                                                                                       at the
Climate Change Impacts on Extreme Flows Under IPCC RCP Scenarios in the Mountainous Kaidu Watershed, Tarim River Basin
Sustainability 2020, 12, 2090                                                                         7 of 23

BYBLK station. For temperature, a simpler delta approach was used, and the change in temperature
was described as the absolute difference between the future and control periods [38]. The daily
temperature in the future period can be calculated as follows:
                                                                       
                                     TDO(k,i) = TO(k,i) + TF(k) − TH(k)                                  (5)

where TDO(k,i) is the future temperature on the ith day in the kth month, TO(k,i) is the observed
temperature on the ith day in the kth month, and TF(k) and TH(k) are the mean temperatures predicted
by the GCMs in the kth month for the periods from 2041 to 2080 and from 1961 to 2000, respectively.
      A large deviation was noted in precipitation predicted by the GCMs. A quantile perturbation
method (QPM) which proposed by Willems et al. [53] and improved by Liu et al. [38] was applied to
generate the daily precipitation series under future climate change scenarios in the period of 2041 to
2080. Detail description of the modified QPM can be found in Liu et al. [38].
      The uncertainties of the projected precipitation and temperatures have been accounted for in this
study by making use of an ensemble modeling approach [20]. In relation to the baseline (i.e., 1961–2000),
all change signals of precipitation and temperature in future period by each GCM runs were extracted
statistically. Changes under each emission scenario and for all considered runs that passed the
performance evaluation were clustered into low, mean, and high levels before input into the SWAT
model. The low and high levels correspond to the minimum and maximum values of the changes,
respectively, and expresses the ranges of climate change uncertainty. The mean level corresponds to
the mean values of the changes. For hydrological impact simulation, the average tendency of multiple
GCMs was recommended [39]. Modeling results for daily maximum and minimum temperature and
mean precipitation from a multi-model-ensemble of 15 GCM combinations for four GHG concentration
pathways were employed to provide daily time series for the SWAT model.

3.2.3. Frequency Analysis of Extreme Floods
     Fisher and Tipett [54] presented three extreme value distributions: the Gumbel distribution,
Fréchet distribution and Weibull distribution. Jenkinson [55] and Coles [56] improved the three extreme
value distributions as a three-parameter extreme value distribution, called the generalized extreme
value (GEV) distribution. The probability density function (PDF) was calculated as follows:
                                                                      
                                                       x − µ − 1ε 
                                                  − 1+ε
                                                                      
                                      F(x) = exp                                                        (6)
                                                                      
                                                            σ
                                                                      
                                                                       
                                                                      
                                                      x − µ 
                                                   1+ε           >0                                      (7)
                                                          σ
where σ is the scale factor, µ is the location factor, and ε is the shape factor. The GEV distribution
includes three distributions. When ε = 0, ε > 0, and ε < 0, the GEV distribution could be described
as a Gumbel distribution, Frèchet distribution, and Weibull distribution, respectively. The advance
of the GEV distribution is that the unification of the three distributions can avoid shortcomings of a
single distribution.
      For parameter estimation of the extreme distributions, maximum likelihood estimation (MLE)
was used. Compared with other parameter estimation methods, MLE can be applied for every
population, has good asymptotic behavior in the case of large sample, and obtains consistent and
effective parameters [57]. Suppose that {x1, x2, . . . , xn} is independent and identically distributed with
the probability distribution function F(x), the parameter estimation of the GEV distribution using the
MLE method can be obtained from the following log-likelihood function:
                                              n     x − µ − 1ε       n          x − µ 
                                                                       1 X
                                              X                                
                                                       i                                i
              L(θ) = L(µ, σ, ε) = −n ln σ −      1+ε              − 1+       ln 1 + ε                    (8)
                                                         σ             ε                  σ
                                              i=1                           i=1
Climate Change Impacts on Extreme Flows Under IPCC RCP Scenarios in the Mountainous Kaidu Watershed, Tarim River Basin
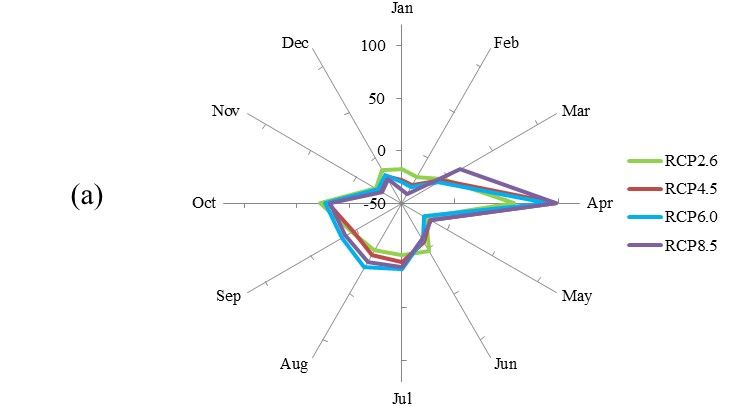
Sustainability 2020, 12, 2090                                                                                            8 of 23
   Sustainability 2020, 12, x FOR PEER REVIEW                                                                         8 of 23

where
   whereθ= θ= (µ,( σ,, ε,);)point
                             ; point(µ,( σ,, ε,) reaches
                                                  ) reaches the
                                                              theMLE
                                                                   MLEwhen
                                                                         when the   functionreaches
                                                                                the function    reachesthethemaximum
                                                                                                               maximum     point.
                                                                                                                        point.
In In
   this study,  numerical       methods        were   used    to solve
      this study, numerical methods were used to solve the function.    the  function.
      The
        Thereturn
              return  period
                         periodrefers
                                  referstoto the
                                               thenumber
                                                    numberofofyears
                                                                  yearsbetween
                                                                          betweentwotwofloods,
                                                                                         floods,which
                                                                                                   whichisisaakey
                                                                                                               keyparameter
                                                                                                                   parameterfor
studying   flood problems.
   for studying    flood problems. It is a Itmeasure     of safety
                                                is a measure         (the ‘inverse
                                                                 of safety          risk’). risk’).
                                                                            (the ‘inverse   In combination     with the
                                                                                                    In combination      method
                                                                                                                     with  the
of method
   periodicofmaxima,
                periodic the  maxima,
                                   returnthe      return(PR)
                                              period      period    (PR) is calculated
                                                               is calculated             as the inverse
                                                                               as the inverse              of the population
                                                                                                   of the population   survival
   survival distribution
distribution   of the annual   of the  annual maxima:
                                    maxima:
                                                                         1
                                                            RP =         1                                                    (9)
                                                                  = 1 − F(x)                                             (9)
                                                                     1− ( )
      Figure 3 shows the comprehensive method by coupling the distributed hydrological model (SWAT)
        Figure 3 shows the comprehensive method by coupling the distributed hydrological model
and GCMs with a statistical frequency analysis.
   (SWAT) and GCMs with a statistical frequency analysis.

                     Figure 3. General framework of the runoff simulation and risk analysis system.
                   Figure 3. General framework of the runoff simulation and risk analysis system.

   4. Results
4. Results    andDiscussion
            and   Discussion

4.1.4.1. Calibrationand
      Calibration    andValidation
                         Validationofofthe
                                        theHydrological
                                           Hydrological Model
        Totally
      Totally  2727  parameterswere
                  parameters      wereselected
                                        selected to
                                                  to participate
                                                     participate in
                                                                  in the
                                                                     the calibration
                                                                          calibrationofofthe
                                                                                          themodel.
                                                                                               model.In In
                                                                                                         order  to to
                                                                                                            order
   obtain
obtain  thethe  sensitivity
             sensitivity    information
                         information      of each
                                       of each     parameter
                                               parameter       in the
                                                            in the     model,
                                                                   model,   the the  model
                                                                                 model  waswas  simulated
                                                                                             simulated   10001000
                                                                                                               times
   times  to  obtain the  sensitivity information   of  the parameters.   The  results indicate that
to obtain the sensitivity information of the parameters. The results indicate that there were severalthere    were
   several parameters
parameters    that showthat
                          highshow  high sensitivity,
                                sensitivity, including including  the effective
                                                         the effective hydraulichydraulic  conductivity
                                                                                    conductivity  in main in channel
                                                                                                             main
   channel alluvium (CH_K2), groundwater delay (days) (GW_DELAY), snow pack temperature lag
alluvium (CH_K2), groundwater delay (days) (GW_DELAY), snow pack temperature lag factor
   factor (TIMP), saturated hydraulic conductivity (SOL_K) and temperature lapse rate (TLAPS). The T-
(TIMP), saturated hydraulic conductivity (SOL_K) and temperature lapse rate (TLAPS). The T-states
   states of the CH_K2, GW_DELAY, TIMP, SOL_K, and TLAPS are 26.6, 13.7, 6.66, 5.79 and 2.35,
of the CH_K2, GW_DELAY, TIMP, SOL_K, and TLAPS are 26.6, 13.7, 6.66, 5.79 and 2.35, respectively.
   respectively. Moreover, the p value of the sensitive parameters are below 0.1 with the great
Moreover, the p value of the sensitive parameters are below 0.1 with the great significance. The modeled
Climate Change Impacts on Extreme Flows Under IPCC RCP Scenarios in the Mountainous Kaidu Watershed, Tarim River Basin
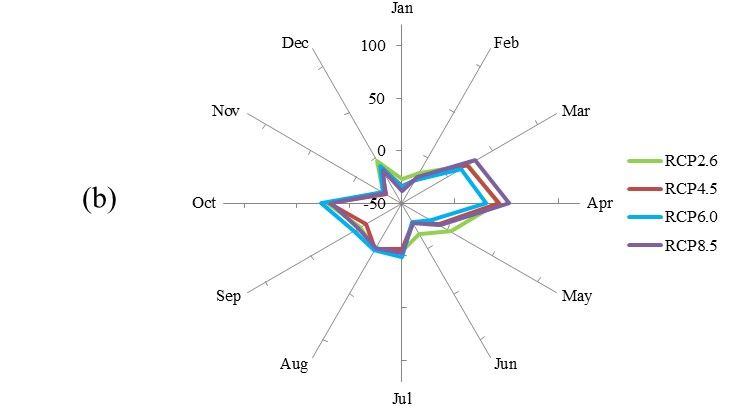
Sustainability 2020, 12, 2090                                                                                        9 of 23

   Sustainability 2020, 12, x FOR PEER REVIEW                                                                    9 of 23
results match the observations well (Figure 4). The evaluation statistics for model performance are
   significance.
listed  in Table 1.The modeled
                    During    the results match
                                  calibration    the observations
                                               period,              wellare
                                                        the NS values     (Figure 4). The
                                                                             0.76 and      evaluation
                                                                                        0.62          statistics
                                                                                             at the DSK          for
                                                                                                         and BYBLK
   model performance
hydrological    stations, are  listed in Table
                           respectively,   the R1.values
                                                   Duringatthe
                                                             thecalibration  period, the
                                                                  DSK and BYBLK            NS values
                                                                                       stations  reachare 0.76
                                                                                                       0.91 andand0.83,
   0.62 at the DSK and BYBLK hydrological stations, respectively, the R values at the DSK and BYBLK
respectively, and the WB varies between 3.44% and −5.12% at the DSK and BYBLK stations, respectively.
   stations reach 0.91 and 0.83, respectively, and the WB varies between 3.44% and −5.12% at the DSK
For the monthly scale, the model performances increase at both stations. The timing and volume
   and BYBLK stations, respectively. For the monthly scale, the model performances increase at both
of the simulated flow peaks are slightly shifting and higher than the observed values. Following
   stations. The timing and volume of the simulated flow peaks are slightly shifting and higher than the
the guidelines by Moriasi et al. [58], these simulation results can be considered acceptable. However,
   observed values. Following the guidelines by Moriasi et al. [58], these simulation results can be
theconsidered
     NS value for    daily discharge
                acceptable.   However,simulation     at the
                                          the NS value       BYBLK
                                                         for daily    station simulation
                                                                   discharge  is a litter lower
                                                                                           at thethan thestation
                                                                                                  BYBLK   references
                                                                                                                  is
value   (>0.65) according    to Ritter and   Muñoz-Carpena       [59].
   a litter lower than the references value (>0.65) according to Ritter and Muñoz-Carpena [59].

         Figure
      Figure     4. Comparison
              4. Comparison      of simulated
                              of simulated  andand measured
                                                measured   dailydaily discharge
                                                                  discharge      in DSK
                                                                            in DSK        station
                                                                                     station       ((a) calibration
                                                                                             ((a) calibration  period;
         period; (b) validation period) and BYBLK  station ((c) calibration period; (d) validation
      (b) validation period) and BYBLK station ((c) calibration period; (d) validation period).     period).
Sustainability 2020, 12, 2090                                                                                        10 of 23
 Sustainability 2020, 12, x FOR PEER REVIEW                                                                          10 of 23

                           Table1.1.SWAT
                          Table      SWATmodel
                                          modelperformance
                                                performancefor
                                                            fordaily
                                                                dailyand
                                                                      andmonthly
                                                                          monthlyrunoff.
                                                                                  runoff.

                                             Calibration(1998–2006)
                                             Calibration  (1998–2006)         Validation  (2007–2011)
                                                                                 Validation (2007–2011)
                                  EFEF                  RR       RE
                                                                 RE (%)
                                                                     (%)       EF
                                                                                EF     R   R RE (%)RE (%)
                 Monthly DSKDSK 0.86
              Monthly
                                   0.86                0.95
                                                       0.95
                                                                   3.00
                                                                   3.00
                                                                              0.85
                                                                               0.85
                                                                                      0.92
                                                                                         0.92
                                                                                                 3.7 3.7
                           BYBLK
                         BYBLK     0.74
                                 0.74                  0.89
                                                       0.89       −6.32
                                                                  −6.32       0.71
                                                                               0.71 0.86 0.86 5.885.88
               DailyDaily DSKDSK 0.76
                                   0.76                0.91
                                                       0.91        3.44
                                                                   3.44       0.72
                                                                               0.72 0.90 0.90 3.073.07
                         BYBLK
                           BYBLK 0.62
                                   0.62                0.83
                                                       0.83       −5.12
                                                                  −5.12        0.61 0.77
                                                                              0.61       0.77 4.664.66

 4.2.Predicted
4.2.  PredictedChanges
                ChangesininTemperature
                            Temperatureand
                                        andPrecipitation
                                            Precipitation
        Underfuture
       Under     futureclimate
                         climatechange
                                  changescenarios,
                                             scenarios,both boththe
                                                                  themagnitude
                                                                       magnitudeand   andfrequency
                                                                                           frequencyofofthetheprecipitation
                                                                                                                precipitation
  wouldchange.
would      change. TheThe perturbation
                           perturbation factor
                                            factor isis the
                                                         the changes
                                                               changes of ofprecipitation
                                                                             precipitationor  ortemperature
                                                                                                  temperaturetime timeseries
                                                                                                                        series
  betweenthe
between      thefuture
                  futureand
                          andcontrol
                               controlperiod.
                                        period.ForFortemperature,
                                                         temperature,the  theperturbation
                                                                               perturbationfactors
                                                                                               factorsdefined
                                                                                                        definedas asabsolute
                                                                                                                     absolute
  differencesbetween
differences     betweenfuture
                           futureand
                                   andcontrol
                                        controlperiods;
                                                  periods;for  forprecipitation,
                                                                   precipitation,theytheyare
                                                                                           aredefined
                                                                                               definedas asrelative
                                                                                                            relativechanges
                                                                                                                     changes
  (ratiosofof
(ratios     thethe  values
                 values duringduring
                                 futurefuture
                                          versusversus
                                                  controlcontrol
                                                              periods).periods).
                                                                          Figure 5Figure
                                                                                     shows 5theshows    the meanfrequency
                                                                                                 mean monthly        monthly
  frequency
changes        changes determined
           determined     by the GCMs   byforthedifferent
                                                  GCMs for       different
                                                             RCPs.          RCPs.indicate
                                                                     The results     The results
                                                                                              that,indicate
                                                                                                    under thethat,  under
                                                                                                                 mean      the
                                                                                                                        level,
  mean
the      level, the
     variation       variation
                 of rainy  daysofinrainy
                                    eachdays
                                           month in each
                                                    is themonth
                                                              largestisunder
                                                                        the largest   under the
                                                                               the RCP2.6        RCP2.6
                                                                                             scenario,     scenario,
                                                                                                         ranging  fromranging
                                                                                                                         −8%
tofrom
    6%; −8%   to 6%;
         and the   mostand  the mostunder
                         moderate      moderate
                                              RCP6.0under      RCP 6.0
                                                        scenario,        scenario,
                                                                    ranging    fromranging     fromUnder
                                                                                      −1% to 2%.      −1% to  2%.
                                                                                                            the    Underand
                                                                                                                RCP4.5     the
  RCP4.5    and   RCP8.5   scenarios,   the   change     of  rainfall  days  was    found   similar.
RCP8.5 scenarios, the change of rainfall days was found similar. The number of rainy days would       The  number    of  rainy
  days would
increase   underincrease
                    RCP4.5 under    RCP4.5
                             and RCP8.5        andSeptember
                                            from    RCP8.5 from   to theSeptember
                                                                          followingtoJanuary,
                                                                                         the following
                                                                                                 and alsoJanuary,    and also
                                                                                                            would increase
  would
from      increase
       March         from
                to June; in March   to June;
                             February,         in February,
                                        July, and   August, the  July,  and August,
                                                                     number     of rainythe  number
                                                                                          days  wouldofexhibit
                                                                                                          rainy adays  would
                                                                                                                   moderate
declining of approximately 3%. Under the low and high levels, the changes of rainy day numbersof
  exhibit  a  moderate    declining    of approximately         3%.  Under    the   low  and  high   levels, the  changes
  rainy day
would         numbers
         be from    −20%would
                           to −3%beandfrom6 to−20%
                                                22%,torespectively.
                                                         −3% and 6 to 22%, respectively.

      Figure 5. Frequency changes in rainy days in each month for the four RCP scenarios relative to those of
       Figure 5. Frequency changes in rainy days in each month for the four RCP scenarios relative to those
      the historical period determined by the 26 GCMs.
       of the historical period determined by the 26 GCMs.

      Figure 6 shows the precipitation data for the 0.01, 0.05, 0.1, 0.2, and 0.5 quantiles, which were
       Figure 6 shows the precipitation data for the 0.01, 0.05, 0.1, 0.2, and 0.5 quantiles, which were
selected to illustrate the monthly quantile perturbations of precipitation intensity in the future period
 selected to illustrate the monthly quantile perturbations of precipitation intensity in the future period
relative to those of the history period. The results indicate that the rain intensities for different quantiles
 relative to those of the history period. The results indicate that the rain intensities for different
are not obviously changed in summer; the changes in winter are significant. The intensity of extreme
 quantiles are not obviously changed in summer; the changes in winter are significant. The intensity
precipitation (at the 0.01 quantile) in January under RCP4.5 is most significant, with an average increase
 of extreme precipitation (at the 0.01 quantile) in January under RCP4.5 is most significant, with an
of 26%.
 average increase of 26%.
Sustainability 2020, 12, 2090                                                                                                     11 of 23
Sustainability 2020, 12, x FOR PEER REVIEW                                                                                      11 of 23
    Sustainability 2020, 12, x FOR PEER REVIEW                                                                                 11 of 23

         FigureThe
      Figure     6. The quantile perturbations ofthethe precipitationintensity
                                                                      intensity in (a)
                                                                                   (a) Jan and  (b) Jul of the future
      Figure 6.
             6. The quantile
                     quantile perturbations
                               perturbations ofof the precipitation
                                                       precipitation intensity in
                                                                                in (a) Jan
                                                                                        Jan and
                                                                                            and (b)
                                                                                                 (b) Jul
                                                                                                     Jul of
                                                                                                         of the
                                                                                                            the future
                                                                                                                future
         period relative to those of the historical period determined by the 15 GCMs.
      period
      period relative
             relative to
                      to those
                         those of the historical
                               of the  historical period
                                                  period determined
                                                          determined by by the
                                                                           the 15
                                                                               15 GCMs.
                                                                                  GCMs.

            The average monthly precipitations in the historical period and future climate change scenarios
       The average monthly precipitations in the historical period and future climate change scenarios
     (under low, mean, and high levels) show notable variations (Figure 7). For the mean level, the future
(under low, mean, and high levels) show notable variations (Figure 7). For the mean level, the future                                future
     precipitation in the Kaidu watershed exhibits an increasing trend under all RCP scenarios, while
precipitation
precipitation in   inthetheKaidu
                             Kaidu    watershed
                                   watershed           exhibits
                                                 exhibits            an increasing
                                                               an increasing      trendtrend
                                                                                          underunder
                                                                                                   all RCPall   RCP scenarios,
                                                                                                             scenarios,              while
                                                                                                                           while monthly
     monthly precipitation presents a decreasing trend in spring (i.e., March, April, and May), autumn
monthly
precipitation precipitation
                  presents    a presents
                                decreasing  a  decreasing
                                               trend    in  springtrend   in
                                                                      (i.e.,   spring
                                                                             March,      (i.e.,
                                                                                       April,    March,
                                                                                                 and
     (i.e., September, October and November) and winter (i.e., December, January, and February) and is    April,
                                                                                                      May),   autumnand   May),
                                                                                                                         (i.e.,    autumn
                                                                                                                                September,
(i.e.,
OctoberSeptember,
     almost  and
               unchangedOctober
                  November)        andwinter
                                  and
                              in summer  November)
                                            (i.e., (i.e.,   and winter
                                                   June,December,
                                                            July,             (i.e., December,
                                                                           January,
                                                                    and August).       and February)
                                                                                      When          January,
                                                                                                comparing     theand
                                                                                                            and   is    February)
                                                                                                                      almost
                                                                                                                   changes           and
                                                                                                                                      theis
                                                                                                                               unchanged
                                                                                                                             among
almost
in summer  unchanged
                 (i.e.,    in
                         June,summer
                                July, and(i.e., June,
                                            August).      July,
                                                             When and   August).
                                                                       comparing      When
                                                                                        the     comparing
                                                                                              changes
     RCP scenarios, the precipitation shows the largest change in the RCP8.5 scenario, while the RCP2.6   amongthe  changes
                                                                                                                     the  RCP   among   the
                                                                                                                                 scenarios,
RCP
the and scenarios,
     precipitation    the
            RCP6.0 scenariosprecipitation
                        shows   the largest
                                  keep       shows
                                              change
                                         similar        the
                                                    rates inof largest
                                                             the   RCP8.5
                                                                 change. change      in the
                                                                              scenario,
                                                                             The   mean       RCP8.5
                                                                                           while
                                                                                           changes thein scenario,
                                                                                                        RCP2.6
                                                                                                          monthly      while  thescenarios
                                                                                                                  andprecipitation
                                                                                                                        RCP6.0      RCP2.6
                                                                                                                                      are
and
keep   RCP6.0
     from    2.9%scenarios
        similar   rates
                   to 19.2%,   keep
                               −3.0%similar
                          of change.   The   mean
                                       to 26.1%, rates     oftochange.
                                                      changes
                                                     0.2%                  The−3.4%
                                                                    in monthly
                                                                 19.0%,   and     mean   tochanges
                                                                                     precipitation
                                                                                             35% under in monthly
                                                                                                      are  from
                                                                                                           RCP2.6,2.9%  precipitation
                                                                                                                         to 19.2%,
                                                                                                                       RCP4.5,   RCP6.0,are
                                                                                                                                     −3.0%
from    2.9%
to 26.1%,      to
              0.2% 19.2%,
                     to      −3.0%
                          19.0%,
     and RCP8.5, respectively.      to
                                  and   26.1%,
                                       −3.4%      0.2%
                                                 to   35%  to  19.0%,
                                                             under       and
                                                                       RCP2.6,  −3.4%    to
                                                                                    RCP4.5, 35%    under
                                                                                                RCP6.0,     RCP2.6,
                                                                                                           and   RCP8.5,RCP4.5,    RCP6.0,
                                                                                                                            respectively.
and RCP8.5, respectively.

                                                            Figure 7. Cont.
Sustainability 2020, 12, x FOR PEER REVIEW                                                                          12 of 23

Sustainability 2020, 12, 2090                                                                                       12 of 23
    Sustainability 2020, 12, x FOR PEER REVIEW                                                                   12 of 23

       Figure 7. Precipitation perturbation factors under the (a) RCP2.6, (b) RCP4.0, (c) RCP6.5 and (d)
       RCP8.57.scenarios  at the BYBLK meteorological    station.
         Figure Precipitation
      Figure                   perturbation
                 7. Precipitation           factors
                                  perturbation      under
                                                factors   the (a)
                                                        under  theRCP2.6, (b) RCP4.0,
                                                                   (a) RCP2.6,        (c) RCP6.5
                                                                               (b) RCP4.0,       and (d)
                                                                                           (c) RCP6.5 andRCP8.5
                                                                                                           (d)
      scenarios at the BYBLK    meteorological  station.
         RCP8.5 scenarios at the BYBLK meteorological station.
       The temperature changes are positive and range from 0.2 to 0.6 °C/10 a at the BYBLK station
      TheThetemperature      changes  are  positive  and                                ◦ C/10 a at the BYBLK station
 (Figure   8). The   average
                temperature     monthly
                               changes   changes
                                        are           and range
                                            positive(mean    level)from
                                                           range     range
                                                                   from    0.2  to 0.6
                                                                           0.2from
                                                                                to 0.6
                                                                                     0.37
                                                                                       °C/10to 0.51  °C/10
                                                                                                a at the     a, 0.46
                                                                                                          BYBLK       to 0.63
                                                                                                                   station
(Figure  8). The   average   monthly  changes  (mean   level)  range   from   0.37  to 0.51  ◦ C/10 a, 0.46 to 0.63 ◦ C/10 a,
 °C/10  a, 0.47   to 0.68 °C/10  a, and 0.64 to 0.85  °C/10   a under    the  RCP2.6,    RCP    4.5, RCP6.0,
    (Figure 8). The average monthly changes (mean level) range from 0.37 to 0.51 °C/10 a, 0.46 to 0.63          and  RCP8.5
0.47  to 0.68  ◦ C/10 a, and 0.64 to 0.85 ◦ C/10 a under the RCP2.6, RCP4.5, RCP6.0, and RCP8.5 scenarios,
 scenarios,
    °C/10  a, respectively.
              0.47            Notably,
                    to 0.68 °C/10 a, andtemperature    will rise
                                         0.64 to 0.85 °C/10       morethe
                                                              a under     in RCP2.6,
                                                                             winter and RCPsummer       thanand
                                                                                               4.5, RCP6.0,   in spring
                                                                                                                  RCP8.5 and
respectively.
 autumn.         Notably, temperature
    scenarios, respectively.              will rise more
                                Notably, temperature   willinrise
                                                               winter
                                                                  moreand      summer
                                                                         in winter   andthan
                                                                                           summerin spring
                                                                                                      than inand  autumn.
                                                                                                               spring  and
    autumn.

                                                     Figure 8. Cont.
Sustainability 2020, 12, 2090                                                                               13 of 23
Sustainability 2020, 12, x FOR PEER REVIEW                                                                  13 of 23

      Figure 8. Temperature perturbation factors under the (a) RCP2.6, (b) RCP4.0, (c) RCP6.5 and (d) RCP8.5
       Figure 8. Temperature perturbation factors under the (a) RCP2.6, (b) RCP4.0, (c) RCP6.5 and (d)
      scenarios at the BYBLK meteorological station.
       RCP8.5 scenarios at the BYBLK meteorological station.
4.3. Climate Change Impact on Hydrological Processes
 4.3. Climate Change Impact on Hydrological Processes
4.3.1. Water Balance
 4.3.1. Water Balance
      Annual streamflow in the Kaidu watershed ranges from 2.77 × 10⁹ m3 to 3.19 × 10⁹ m3 per year
underAnnual
        future climate  change
                streamflow       scenarios.
                             in the   Kaidu At   both theranges
                                              watershed   DSK and    BYBLK
                                                                  from   2.77 ×stations,
                                                                                 109 m3 tounder
                                                                                             3.19all RCP
                                                                                                  × 10 9 mscenarios,
                                                                                                          3 per year

annual   mean climate
 under future    runoff shows
                         changeascenarios.
                                   clear decrease   from
                                               At both the2041
                                                          DSK to   2080.
                                                                 and BYBLKGenerally,
                                                                               stations,the  annual
                                                                                          under       runoff
                                                                                                 all RCP      would
                                                                                                          scenarios,
change
 annual most
          mean significantly
                 runoff showsunder
                                 a clearthe RCP8.5from
                                          decrease    scenario,
                                                           2041 stream
                                                                 to 2080.runoff   would
                                                                           Generally,    thedecreases   by 40%
                                                                                              annual runoff     and
                                                                                                              would
22%   at the
 change      DSK
          most     and BYBLK
                significantly     stations,
                              under          respectively.
                                       the RCP8.5           Minimal
                                                    scenario,          runoffwould
                                                              stream runoff    changes     would be
                                                                                      decreases    by found
                                                                                                       40% andunder
                                                                                                                22%
the  RCP2.6
 at the  DSK scenario,
               and BYBLK  annual   mean
                             stations,     runoff decreased
                                         respectively.  Minimalby runoff
                                                                   21.1% changes
                                                                           and 14.7% wouldat the
                                                                                               beDSK
                                                                                                  found and  BYBLK
                                                                                                          under  the
stations,  respectively.
 RCP2.6 scenario, annual mean runoff decreased by 21.1% and 14.7% at the DSK and BYBLK stations,
      Such hydrological variation is mainly related to the relative variation between evapotranspiration
 respectively.
and precipitation.   Xu et al. [12]
       Such hydrological             found that
                                variation     is small
                                                  mainlyvariations
                                                            relatedin precipitation
                                                                       to the relativemay lead     to large between
                                                                                               variation    changes
 evapotranspiration and precipitation. Xu et al. [12] found that small variations in precipitation may
 lead to large changes in streamflow from upstream rivers. In Liu et al. [38]’s research on the Yarkant
Sustainability 2020, 12, 2090                                                                                              14 of 23

in streamflow from upstream rivers. In Liu et al. [38]’s research on the Yarkant watershed, which is one
       Sustainability 2020, 12, x FOR PEER REVIEW                                                                      14 of 23
of the other upstream catchments of the Tarim Basin, the amount of water dissipated by evaporation in
the basin    exceedswhich
       watershed,        the amount
                                 is one ofof  snow
                                            the otherstorage
                                                        upstreamand   streamflow
                                                                   catchments        to the
                                                                                 of the     lower
                                                                                         Tarim     reaches.
                                                                                                Basin,         Figure
                                                                                                       the amount    of 9water
                                                                                                                           presents
the relative    variations
       dissipated                 in annual
                       by evaporation           average
                                           in the          precipitation,
                                                   basin exceeds             ET and
                                                                    the amount          surface
                                                                                  of snow        runoff
                                                                                            storage  and at  the subwatershed
                                                                                                          streamflow     to the
monitored
       lower by      the BYBLK
               reaches.      Figure 9station
                                         presentsandthethe entirevariations
                                                         relative   Kaidu watershed,
                                                                               in annual which
                                                                                            averageisprecipitation,
                                                                                                       monitored by   ET the
                                                                                                                           andDSK
       surface
station.         runoff the
          Generally,       at the   subwatershed
                                changes              monitored
                                            in the water         by the
                                                            balance    areBYBLK   station and the
                                                                           more significant        entire
                                                                                               under   theKaidu
                                                                                                            RCP4.5watershed,
                                                                                                                      and RCP8.5
       which
scenarios    andis are
                     monitored
                          relatively by the   DSK under
                                         smaller    station.the
                                                              Generally,
                                                                 RCP2.6 andthe changes
                                                                                 RCP6.0 in    the water
                                                                                           scenarios      balance
                                                                                                       (Figure   9).are
                                                                                                                     The  more
                                                                                                                            climate
       significant     under   the   RCP4.5   and  RCP8.5   scenarios   and  are relatively  smaller under
impact on annual mean precipitation is not substantial. The relative variations in annual precipitation      the RCP2.6    and
       RCP6.0 scenarios (Figure 9). The climate impact on annual mean precipitation is not substantial. The
range from 0.57% to 2.42% in the Kaidu watershed and from 0.60% to 2.49% in the area monitored
       relative variations in annual precipitation range from 0.57% to 2.42% in the Kaidu watershed and
by the BYBLK station. However, the annual mean ET shows a large increasing trend. The relative
       from 0.60% to 2.49% in the area monitored by the BYBLK station. However, the annual mean ET
changes    in ET
       shows          range
                a large        from 22.7%
                          increasing    trend.to   33.0%
                                                 The        over
                                                     relative     the entire
                                                               changes          watershed
                                                                         in ET range          and from
                                                                                       from 22.7%         3.1%
                                                                                                   to 33.0%      tothe
                                                                                                              over   22.8%    at the
                                                                                                                         entire
BYBLK     subwatershed            level.  Therefore,    water   resources    at both   subwatershed
       watershed and from 3.1% to 22.8% at the BYBLK subwatershed level. Therefore, water resources at   and   watershed      scales
will decrease.
       both subwatershed and watershed scales will decrease.

      FigureFigure 9. Relative changes in (a) annual mean precipitation, (b) ET and (c) surface runoff in the BYBLK
              9. Relative changes in (a) annual mean precipitation, (b) ET and (c) surface runoff in the BYBLK
            subwatershed and Kaidu watershed.
      subwatershed and Kaidu watershed.
Sustainability 2020, 12, 2090                                                                                        15 of 23
     Sustainability 2020, 12, x FOR PEER REVIEW                                                                    15 of 23

     Notably,
          Notably,there   areare
                       there  large   uncertainties
                                  large  uncertaintiesininrunoff
                                                            runoffassessment
                                                                    assessment duedue to to the
                                                                                             the uncertainties
                                                                                                 uncertainties in inGCM
                                                                                                                     GCM
    emission
emission        scenarios
           scenarios     andand
                              thethe  structure
                                   structure      and
                                                and    parametersofofhydrological
                                                     parameters        hydrological models
                                                                                        models [60].
                                                                                                  [60]. Zhang
                                                                                                        Zhangetetal.al.[41]
                                                                                                                        [41]
    found   that   the  uncertainties   due  to  emission  scenarios, parameters      of the  hydrological
found that the uncertainties due to emission scenarios, parameters of the hydrological model, and             model,   and
the the extreme
    extreme     flowflow  distributionsmight
                        distributions     might bebe much
                                                     muchsmaller
                                                             smallerthan
                                                                      thanthethe
                                                                               GCMGCM  uncertainty.  In thisInstudy,
                                                                                           uncertainty.              only
                                                                                                                this study,
onlyuncertainties
      uncertainties   from
                        fromGCMs
                              GCMs  andandemission
                                            emission scenarios  were
                                                        scenarios    investigated,
                                                                   were  investigated,and and
                                                                                            the results  proved
                                                                                                 the results      that the
                                                                                                              proved    that
    uncertainty     originating  from   the GCMs    is larger than that related  to  the  different emission
the uncertainty originating from the GCMs is larger than that related to the different emission scenarios.      scenarios.
    Moreover,
Moreover,     whenwhen     compared
                       compared        with
                                    with   thethe previousstudy
                                                previous    studybybyLiu
                                                                       Liuetetal.
                                                                               al. [35],
                                                                                    [35], large
                                                                                          large uncertainties
                                                                                                 uncertainties from
                                                                                                                  fromET ET
    calculations     are  found   due   to  different  structures  between    the   MIKE     SHE
calculations are found due to different structures between the MIKE SHE and SWAT models, although  and   SWAT     models,
    although annual precipitation and temperature showed similar relative changes under the IPCC AR4
annual precipitation and temperature showed similar relative changes under the IPCC AR4 and AR5
    and AR5 emission scenarios. With similar changes in precipitation and temperature, ET changed
emission scenarios. With similar changes in precipitation and temperature, ET changed from 5% to 10%
    from 5% to 10% in Liu et al. [35]’s study. However, in this study, the change in ET reached 20% to
in Liu et al. [35]’s study. However, in this study, the change in ET reached 20% to 30%, and the mean ET
    30%, and the mean ET ranges from 182.1 to 266.5 mm/year, which agrees with the observed ET in the
ranges from 182.1 to 266.5 mm/year, which agrees with the observed ET in the Kaidu watershed [43].
    Kaidu watershed [43].
4.3.2. Monthly River Flows
      4.3.2. Monthly River Flows
       Since the seasonal variation in discharge is essential for flood control and water assignment,
            Since the seasonal variation in discharge is essential for flood control and water assignment, the
the monthly        changeinindischarge
      monthly change            dischargewaswas reviewed
                                              reviewed       at both
                                                         at both       stations.
                                                                  stations.       ForDSK
                                                                             For the  the station,
                                                                                          DSK station,
                                                                                                   monthly  monthly     river
                                                                                                                river flows
flows    decrease
      decrease   in in  most
                      most     simulated
                            simulated      scenarios
                                       scenarios      (Figure
                                                  (Figure  10a).10a).  Significant
                                                                 Significant        reductions
                                                                               reductions can becan   be found
                                                                                                  found            in winter
                                                                                                            in winter   (i.e.,
(i.e.,December,
       December,January,
                       January,andandFebruary),
                                      February),autumn
                                                   autumn(i.e.,
                                                              (i.e.,September,
                                                                     September,October,
                                                                                   October,and
                                                                                             andNovember),
                                                                                                  November),and     andthe the
summer      (i.e.,  June, June,  and  August).   The  largest  decrease    in discharge  reaches   50.3%
      summer (i.e., June, June, and August). The largest decrease in discharge reaches 50.3% under RCP8.5.  under    RCP8.5.
Increases    in simulated
      Increases    in simulatedmonthly  runoff
                                   monthly      can be
                                             runoff  canfound    during
                                                          be found        the snow
                                                                       during        melt melt
                                                                                the snow  period   (i.e., April
                                                                                                period            and May).
                                                                                                          (i.e., April  and
The May).
      largestThe
               increase    inincrease
                     largest  monthlyindischarge
                                         monthly is   as high as
                                                    discharge   is 7.4%  under
                                                                    as high      the RCP8.5
                                                                             as 7.4%         scenario,
                                                                                      under the  RCP8.5   and   the increase
                                                                                                             scenario,  and
of monthly
      the increase of monthly discharge also found in May under RCP2.6 and RCP4.5 scenarios with theof
                discharge     also found  in May   under   RCP2.6    and   RCP4.5   scenarios  with  the   change    rates
6.5%change
        and 5.3%.
               rates of 6.5% and 5.3%.

      Figure 10. Comparing
          Figure 10. Comparing changes
                                   changesin in
                                             monthly
                                                monthly average
                                                         averagedischarge
                                                                  dischargeunder
                                                                            under the
                                                                                   the four
                                                                                       four RCP scenarios
                                                                                                scenarioswith
                                                                                                          withthe
                                                                                                               the
      baseline condition
          baseline        at the
                   condition      (a) (a)
                              at the  DSK   and
                                          DSK    (b)(b)
                                               and   BYBLK
                                                        BYBLKstations.
                                                               stations.
Sustainability 2020, 12, 2090                                                                                      16 of 23

    Sustainability 2020, 12, x FOR PEER REVIEW                                                                  16 of 23
      Variations in the monthly discharge at the BYBLK station differ from the downstream DSK station
(Figure 10b).    Generally,
         Variations    in themonthly
                               monthlystreamflow
                                         discharge at  increases
                                                          the BYBLK  under  most differ
                                                                          station  simulations.
                                                                                          from the Moreover,   the BYBLK
                                                                                                      downstream     DSK
    station
station  has(Figure  10b).higher
              relatively    Generally,  monthly
                                  increases   thanstreamflow       increases
                                                     the DSK station.         under most
                                                                           Monthly    runoffsimulations.   Moreover,
                                                                                               would increase   from the
                                                                                                                       3.0%
    BYBLK
to 60.5%   instation
              winterhas
                      andrelatively
                            autumn, higher
                                      and from increases
                                                   27.5% than     the DSK
                                                            to 78.3%         station. During
                                                                       in summer.     Monthlythe runoff
                                                                                                    snowwould    increase
                                                                                                           melting  period,
    from 3.0%
positive         to 60.5%
           impacts   (fromin8.3%
                               winter  and autumn,
                                   to 59.0%)             and from 27.5%
                                                occur primarily       in Marchto 78.3%  in summer.
                                                                                   and April,    whileDuring   theimpacts
                                                                                                        negative    snow
    melting   period,   positive impacts   (from
(from 2.7% to 20.9%) are found in May and June.     8.3%   to  59.0%)   occur   primarily  in  March   and  April,  while
    negative   impacts
      Variations         (from 2.7%
                   in seasonal       to 20.9%) of
                                 distribution    areriver
                                                      found    in May
                                                            runoff   areand   June.due to the relative change in snow
                                                                         mainly
         Variations
accumulation     and in   seasonal
                      melting.     distribution
                                 Figure  11a shown of river
                                                        thatrunoff    are mainly
                                                              the climate    changedue  to the on
                                                                                      impact    relative
                                                                                                   annualchange
                                                                                                           meaninsnowfall
                                                                                                                    snow
    accumulation     and    melting. Figure    11a   shown     that  the  climate   change    impact
decreases in the future period due to significant temperature increases. However, the relative changes on  annual   mean
    snowfall decreases in the future period due to significant temperature increases. However, the
over the entire Kaidu watershed are larger than that in the BYBLK subwatershed. Mean annual
    relative changes over the entire Kaidu watershed are larger than that in the BYBLK subwatershed.
snow storage decreases continuously in the Kaidu watershed primarily because of the decrease in
    Mean annual snow storage decreases continuously in the Kaidu watershed primarily because of the
snowfall resulting from the rising temperatures. The decrease occurs mainly in summer, from June
    decrease in snowfall resulting from the rising temperatures. The decrease occurs mainly in summer,
to September. Compare with the snowfall from 1961 to 2000, the changes in annual snowfall in the
    from June to September. Compare with the snowfall from 1961 to 2000, the changes in annual
Kaidu   watershed
    snowfall   in the would
                      Kaidu be    −19.2%,would
                               watershed    −21.4%,  be−24.2%,
                                                         −19.2%, and     −26.4%
                                                                    −21.4%,        under
                                                                              −24.2%,  andthe  RCP2.6,
                                                                                            −26.4%        RCP4.5,
                                                                                                      under        RCP6.0,
                                                                                                             the RCP2.6,
andRCP4.5,
      RCP8.5RCP6.0,
                scenarios,   respectively,  and   those   in  the  BYBLK     subwatershed      would
                         and RCP8.5 scenarios, respectively, and those in the BYBLK subwatershed would  be −17.7,  −19.4%,
−22.3%,
    be −17.7,    −23.8%−22.3%,
           and−19.4%,      under the
                                   andRCP2.6,
                                        −23.8% RCP4.5,
                                                  under the   RCP6.0,
                                                                 RCP2.6,and    RCP8.5
                                                                            RCP4.5,      scenarios,
                                                                                      RCP6.0,         respectively.
                                                                                                 and RCP8.5           Thus,
                                                                                                               scenarios,
despite
    respectively. Thus, despite the higher temperatures, precipitation in the form of snow continues less
          the  higher   temperatures,   precipitation      in  the  form  of  snow   continues    to occur, although    to
frequently,   in winter.
    occur, although    less frequently, in winter.

      Figure 11.11. Relative
         Figure               changesinin(a)(a)
                    Relative changes            snowfall
                                             snowfall     (b) snow
                                                      (b) snow      melting
                                                               melting in the in the watershed
                                                                               Kaidu Kaidu watershed   and
                                                                                               and BYBLK
      BYBLK  subwatershed.
         subwatershed.

     Increased   temperatures
         Increased temperatureslead
                                  leadtotoearlier
                                           earlieroccurrence
                                                    occurrence of of snow
                                                                     snow melting,    indicatingan
                                                                            melting, indicating   anincreasing
                                                                                                      increasing
trend  in monthly   streamflow   in  spring;  the  monthly     mean    streamflow   in June, July,
   trend in monthly streamflow in spring; the monthly mean streamflow in June, July, and August     and  August
decreases  because of the reduction  in rainfall and  relatively  larger ET  increments in summer.
   decreases because of the reduction in rainfall and relatively larger ET increments in summer.     Drastically
decreasing   snowfall
   Drastically         and earlier
                decreasing         snowmelt
                            snowfall            results
                                      and earlier        in lessresults
                                                   snowmelt       snow inavailable foravailable
                                                                           less snow   melting in
                                                                                                forsummer
                                                                                                    melting and
                                                                                                             in
You can also read