Comparative study on Corrosion Inhibition of Vietnam Orange Peel Essential Oil with Urotropine and Insight of Corrosion Inhibition Mechanism for ...
←
→
Page content transcription
If your browser does not render page correctly, please read the page content below
Research Article                                                                            J. Electrochem. Sci. Technol., 2019, 10(1), 69-81

Comparative study on Corrosion Inhibition of Vietnam Orange
Peel Essential Oil with Urotropine and Insight of Corrosion
Inhibition Mechanism for Mild Steel in Hydrochloric Solution
Huyen T.T. Bui*, Trung-Dung Dang, Hang T. T. Le, and Thuy T.B. Hoang
School of Chemical Engineering, Hanoi University of Science and Technology, 1 Dai Co Viet road, Hanoi 100000, Vietnam

ABSTRACT
The corrosion inhibiting mechanism of Vietnam orange peel essential oil (OPEO) for mild steel in 1 N HCl solution was
investigated elaborately. Corrosion inhibition ability of OPEO was characterized by electrochemical polarization, electro-
chemical impedance spectroscopy (EIS), and weight loss method. In the corrosive solution, OPEO worked as a mixed
inhibitor and the inhibition efficiency of OPEO increased with the increase of its concentration. High inhibition efficiencies
over 90% were achieved for the concentration of 3 - 4 g/L OPEO, comparable to that of 3.5 g/L urotropine (URO), a com-
mercial corrosion inhibitor for acid media used in industry. By using adsorption isotherm models (Langmuir, Temkin and
Frumkin), thermodynamic parameters of adsorption were calculated. The obtained results indicated physical adsorption
mechanism of OPEO on the steel surface. The components responsible for the corrosion inhibition activity of OPEO were
not only D-limonene, but also other compounds, which contain C=O, C=C, O-H, C-O-C, -C=CH and C-H bonding groups
in the molecules.
Keywords : Mild steel, Orange peel essential oil (OPEO), Urotropine (URO), Corrosion inhibition, Adsorption mechanism
Received : 18 July 2018, Accepted : 18 September 2018

1. Introduction                                                                        tional inhibitors show some disadvantages, for
                                                                                       example, being mostly synthetic, expensive, non-
  Nowadays, acids have been commonly used in                                           biodegradable and harmful compounds for environ-
industry. Several their significant application fields                                 ment and living creatures.
involve acid pickling for steel, chemical cleaning                                        Many attempts have been made to find green
and processing, ore manufacture and acidizing oil                                      inhibitors, which are ecologically friendly and read-
wells [1-3]. Facilities in industrial plants originate                                 ily available. In recent years, researches on the use
from ferrous metal materials. Therefore, occur-                                        of natural products such as plant extracts have
rence of corrosion phenomenon is unavoidable. Uti-                                     attracted much attention due to their availability in
lization of inhibitors to control corrosion is                                         natural source, biodegradability, low cost and espe-
indispensable. Corrosion inhibitors not only work to                                   cially non-toxicity. Some notable successes have
prevent metal dissolution but also reduce acid con-                                    been achieved in the use of extracts derived from
sumption. Most of popular acid inhibitors are                                          different parts of the plants including leaves [7-10],
organic compounds containing O, S, N atoms and/or                                      seeds [8,11,12], juice and stem [12], bark [13], peels
multiple bonds which enable adsorption on the                                          [7,14-17], root [18] and tubers [19,20] as efficient
metal surface [3-6]. However, in addition to the                                       green inhibitors for metals corrosion in aggressive
advantage of good inhibitive efficiency, the tradi-                                    environments. Besides, other natural product such
                                                                                       as natural honey [21] as well as some eco-friendly
*E-mail address: huyen.buithithanh@hust.edu.vn                                         pharmaceutical compounds (ceftazidime,
DOI: https://doi.org/10.5229/JECST.2019.10.1.69                                        cefadroxil, lornoxicam and tenoxicam, etc. [22-24]
This is an open-access article distributed under the terms of the Creative Commons     have been also studied.
Attribution Non-Commercial License (http://creativecommons.org/licenses/by-nc/4.0)
which permits unrestricted non-commercial use, distribution, and reproduction in any      Vietnam is one of the tropical countries, with the
medium, provided the original work is properly cited.                                  favorable weather for diverse fruit trees, for instance

                                                                                  − 69 −
70                  Huyen T.T. Bui et al. / J. Electrochem. Sci. Technol., 2019, 10(1), 69-81

orange trees. Actually, Vietnam has been ranked in         perature reached 100oC corresponding to the boiling
the highest top 20 countries providing orange fruits       point of pure water component. The distillate includ-
on the world, mostly for beverage industry. Unfortu-       ing water and essential oil was condensed after flow-
nately, orange peels are often discarded after juicing     ing in a coil distillate condenser and collected in an
process. Few previous reports showed that the orange       Erlenmeyer flask. Subsequently, OPEO was separated
peel extract is effective corrosion inhibitor for mild     from the distillate by removing the water layer with the
steel in acids [7,14-16]. However, these studied           higher density at the bottom. Finally, the trace of mois-
results are not systematic and controversial about         ture in OPEO was removed completely using Na2SO4
adsorption isotherm. Moreover, there is no evidence        powder. The extraction yield was about 1%. The com-
to support the presence of organic film on the metal       position of the OPEO was analyzed by GCMS method
surface acts as corrosion inhibitor. With the aim of       (GCMS 2010, Shimadzu, Japan).
enhancing the economic value for Vietnam orange as            The test solutions were 1N HCl acidic solutions
well as finding out an eco-friendly corrosion inhibitor    containing OPEO with various concentrations in a
to substitute the traditional inhibitors used in the       range of 0 to 4 g/L. Analytical grade 36% HCl acid (d
industry, in this present work we focus on investigat-     = 1.18 g/mL, Sigma Aldrich) was used as received
ing corrosion inhibition activity as well as elucidating   without further purification. For comparison, a solu-
inhibition mechanism of Vietnam orange peel essen-         tion of 1N HCl containing 3.5 g/L hexamethylenete-
tial oil (OPEO) for mild steel in hydrochloric acid.       tram ine (urotropine - URO) [25], a popular
Especially, the presence of organic film from OPEO         traditional inhibitor, was prepared as well.
on the metal surface was considered by using the
combination of electrochemical techniques (EIS,            2.2 Methods
potentiodynamic) and physicochemical methods                 Corrosion inhibition of OPEO for the mild steel in
(SEM/EDS, GCMS and FTIR).                                  the test solutions was examined by electrochemical
                                                           techniques such as potentiodynamic polarization and
2. Experimental                                            electrochemical impedance spectroscopes (EIS). In
                                                           addition, weight-loss method was employed to assess
2.1 Materials and solutions                                corrosion rate of the mild steel with the absence and
   The mild steel samples with compositions of             presence of OPEO inhibitor in the temperature range
0.198% C, 0.459% Mn, 0.018% P, 0.035% S, 0.151%            from 15 to 65oC.
Si, 0.024% Cu, 0.014% Nb and Fe in balance were              For electrochemical measurements, prior to each
used as studying electrode for corrosion experiments.      measurement the steel electrodes were immersed in
The exposed surface area of 0.5 cm2 was fixed. Other       the acidic solution of 1N HCl in 30 mins to get the
cylindrical mild steel samples with 8 mm in diameter,      stable state. All the electrochemical tests were con-
and 2.5 cm in length were also prepared for determina-     ducted using Autolab PGSTAT 302N (Netherlands)
tion of corrosion rate using weight-loss method. After     with a conventional three-electrode cell, where a plat-
being polished carefully by different sand papers from     inum mesh as counter electrode, and the silver/silver
100 to 1500 grade, the surface of the steel samples was    chloride electrode (Ag/AgCl/Sat. KCl) as reference-
degreased with soap, rinsed in distilled water, and        electrode. Polarization measurements were carried
dried by an ethanol-impregnated plotting paper.            out at the potential in range of -300 mV to +300 mV
   OPEO used in the present study was extracted            vs. OCP at a scanning rate of 5 mV/s. Electrochemi-
from the outer skin of orange peel (collected from Bo      cal impedance measurements were conducted at free
Ha commune, Bac Giang province of Vietnam) by              corrosion potential of with an amplitude of 10 mV at
steam distillation method. In specific, 200 g of the       the frequency in a range of 10 kHz ÷ 5 mHz. The
outer skin of orange peel was cut into small pieces,       inhibition efficiency was calculated according to two
and then ground with 200 mL of water in a blender.         distinct equations based on Tafel extrapolation results
The resultant smoothie was transferred into a corn-        (Hi) and EIS analysis (HR) as follows:
ing Pyrex borosilicate glass round bottom distilling                 0
                                                                   ic – ic
Flask. The distillation process was conducted at the                           - × 100%
                                                             H i = -------------                                (1)
                                                                          0
temperature of 98oC and only finished when the tem-                     ic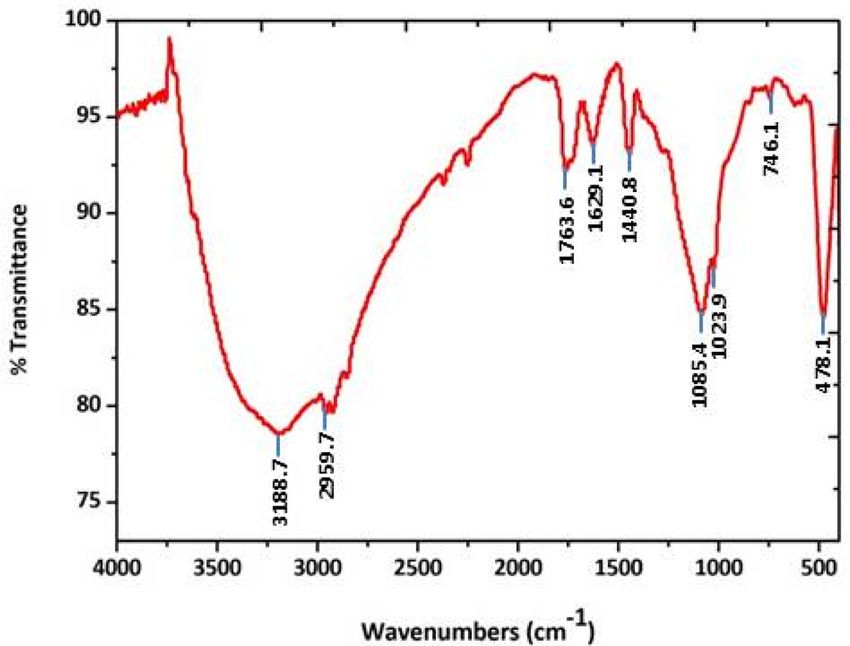
Huyen T.T. Bui et al. / J. Electrochem. Sci. Technol., 2019, 10(1), 69-81 71
0 The inhibition efficiency was calculated from
R ct – R ct
- × 100
H R = -------------------- (2) weight-loss measurement (HW) according to as fol-
R ct
low:
o
Where i c and ic are the corrosion current density in o
w – w-
the corrosive solution without and with inhibitor, H W = ---------------
o
× 100% (4)
0
respectively, (mA/cm2); R ct and Rct are charge trans- w
fer resistances in the corrosive solution without and Where, W0 and W are corrosion rate of mild steel in
with inhibitor (Ω.cm2), respectively. the solution without and with inhibitors (mg.cm-2·h-1),
Corrosion rate of the mild steel was determined respectively.
through weight-loss measurement. The steel samples Moreover, the thermodynamic functions and
were immersed in the test solutions for different adsorption characteristics of OPEO on the steel sur-
immersion time. Their weight before and after corro- face were determined and discussed.
sion was recorded precisely using a balance Microstructure of the samples was investigated
(TE214S, Germany) with an accuracy of 10-4 g. The using Scanning Electron Microscope (SEM, JEOL
corrosion rate (W) was calculated as follows: 6490, Jed 2300, Japan) equipped by energy disper-
sive spectrometer (EDS). Surface chemistry of the
m1 – m2
W = ------------------- (mg.cm-2·h-1) (3) mild steel samples was inspected by Fourier Trans-
st
form Infrared Spectroscopy (FTIR, Nicolet 6700 FT-
Where S is the surface area of the sample (cm 2); IR, USA).
m1, m2 are the weight of the sample before and after The comparison of corrosion inhibition behaviors of
corrosion (mg), respectively; t is the immersion OPEO with URO were conducted by potentiodynamic
time (h). polarization, weight-loss method and SEM images.
Table 1. The composition of OPEO analyzed by GCMS method
Molecular Content Molecular Content
Number Components Number Components
formula (% wt.) formula (% wt.)
Cyclohexane,
1 2,2-dimethoxylbutane C H O
10 14 2 0.10 16 1,1,3-trimethyl-2-propyl-, C H
12 24 0.02
trans
2-cycloxen-1-ol,2-methyl-
2 α-pinene C H
10 16 0.62 17 C H O
10 16 0.19
5-(1-methylethenyl)-cis-
3 β-phelladrene C H
10 16 0.39 18 Cis-carveol C H O
10 16 0.10
4 2-β-pinene C H
10 16 0.04 19 β-citral C H O
10 16 0.17
5 β-myrcene C H
10 16 1.66 20 Carvol C H O
10 14 0.32
6 Octanal CH O
8 16 0.23 21 Germacrene D C H
15 24 0.02
7 δ-3-carene C H
10 16 0.11 22 Valencene C H
15 24 0.02
8 D-limonene C H
10 16 92.85 23 Undecane, 5-phenyl- C H
17 28 0.02
9 Linalool C H O
10 18 0.75 24 Dodecane, 6-phenyl- C H
18 30 0.06
10 Nonanal CH O
9 18 0.06 25 Dodecane, 5-phenyl- C H
18 30 0.06
6-isopropenyl-3-Methyl-
11 C H O
10 16 0.20 26 Dodecane, 4-phenyl- C H
18 30 0.04
1-cyclohexen-1-ol
12 Cis-limonene oxide C H O
10 16 0.41 27 Dodecane, 2-phenyl- C H
18 30 0.04
13 Trans- limonene oxide C H O
10 16 0.46 28 Tridecane, 7-phenyl- C H
19 32 0.05
3-cyclohexene-1-Metha-
14 C H O
10 18 0.12 29 Tridecane, 5-phenyl- C H
19 32 0.03
nol,α,α-4-trimethyl-
15 Decanal C H O
10 20 0.40 30 Dioctyl phthalate C H O
24 38 4 0.05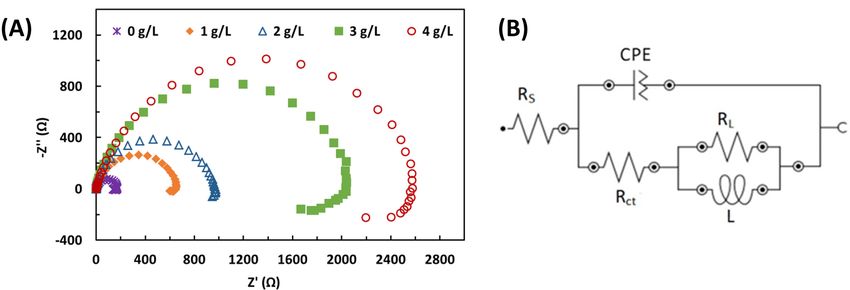
72                    Huyen T.T. Bui et al. / J. Electrochem. Sci. Technol., 2019, 10(1), 69-81

3. Results and Discussion                                              3.2 Corrosion inhibition of OPEO and compari-
                                                                       son with URO
3.1 Essential oil composition verification                                To investigate dynamics of corrosion process of the
  To clarify the corrosion inhibition mecha-                           mild steel with the presence of OPEO inhibitor and
nism of OPEO inhibitor for the mild steel in 1N                        compare with URO, the polarization curves in the
HCl solution, firstly, the chemical composition                        different test solutions were recorded and displayed
of OPEO should be identified. Table 1 lists                            in Fig. 1.
analysis results of compositions of OPEO origi-                           As seen from the Tafel curves, the corrosion poten-
nated from Vietnam using GCMS method.                                  tials of the mild steel in the solutions with the pres-
  As seen, OPEO contains about 30 different                            ence of the inhibitors including OPEO and URO are
compounds, among which D-limonene (C 10 H 16 )                         a bit less negative (about 20 mV) than that in the
is predominate with the highest content up to                          absence of the inhibitors. The shifts are less than 80
92.85%. The rest compounds of OPEO have the                            mV, which is one of the signals of a mixed inhibition
negligible content. In general, all the constitu-                      [26, 27]. In addition, both cathode and anode
ent compounds contain three elements viz. C, H                         branches of the Tafel curves shift towards to the
and O and functional groups such as C=C, C=O,                          direction of lower current density. This demonstrates
O - H , - O- a nd a r om a t i c r i ng s . T h e a ve r a g e         that OPEO and URO both alleviated anodic dissolu-
molecular weight of the OPEO (M OPEO ) calcu-                          tion reactions and arrested cathodic hydrogen evolu-
lated according to the composition and content                         tion reactions. This may result from adsorption of
of the compounds presented in OPEO is                                  OPEO and URO on the whole corroding surface
136.47 g/mol.                                                          [28]. Accordingly, OPEO and URO worked as mixed
                                                                       inhibitors and restricted corrosion of the mild steel in
                                                                       the 1N HCl acid.
                                                                          Table 2 enumerates values of corrosion potential
                                                                       (Ec), corrosion current density (ic) as well as anodic
                                                                       and cathodic Tafel slope (ba and bc) obtained using
                                                                       Tafel extrapolation method. As seen, corrosion cur-
                                                                       rent density of the steel sample significant decrease
                                                                       in 1N HCl solution in the precence of inhibitors. In
                                                                       particular, in the presence of 1g/L OPEO the corro-
                                                                       sion current density was 62.14 mA/cm2, which is half
                                                                       as high as that in the absence of OPEO.
                                                                          As the concentration of inhibitor was increased, the
                                                                       corrosion current density of the mild steel decreased.
Fig. 1. Polarization curves of the mild steel in 1N HCl                Remarkably, in comparison with the sample without
solution without and with different concentration (1÷4 g/L)            the inhibitors, the ic value of the sample with 4 g/L
of OPEO and 3.5 g/L URO                                                OPEO decreased more than fifteen times. Mean-

Table 2. Potentiodynamic polarization parameters for the mild steel in 1N HCl solution with and without inhibitors.
                       C         E (mV vs. Ag/
                                   c                       i c                    b  a              b c              H    i
     Inhibitor                                                     2
                      (g/L)         AgCl)               (mA/cm )                (mV/dec)          (mV/dec)          (%)
                         0             -429.24            125.12                  73.88             80.12             -
                         1             -414.24             62.14                  109.49            88.84           56.1
       OPEO              2             -410.73             24.28                  96.21             69.77           82.8
                         3             -411.71             9.86                   100.01            63.16           92.1
                         4             -407.88             8.14                   104.74            64.19           94.2
        URO             3.5            -411.81             19.81                  111.05            56.29           84.2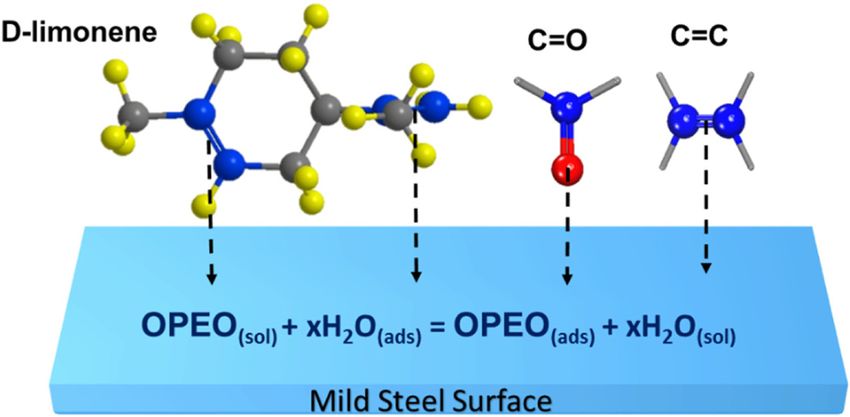
Huyen T.T. Bui et al. / J. Electrochem. Sci. Technol., 2019, 10(1), 69-81 73
Fig. 2. The inhibition efficiency of OPEO and URO for the
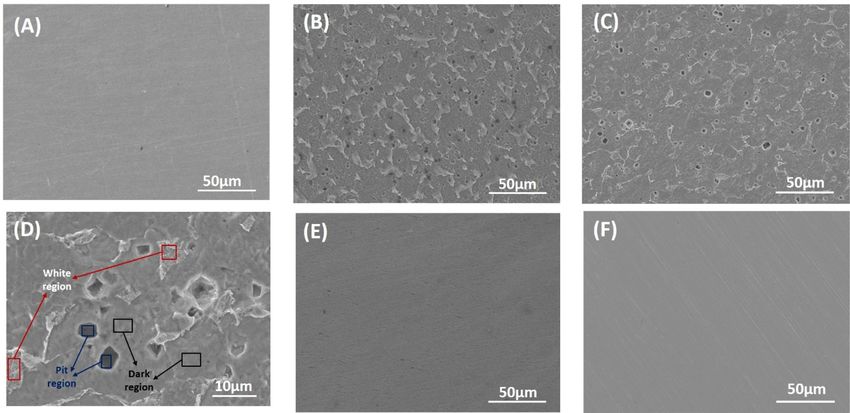
mild steel in the 1N HCl acid after different immersion Fig. 3. SEM images of the mild steel surface before and
times o
after 1h of exposure in 1N HCl acid at 25 C: (A) before;
(B) after corrosion in the blank solution; (C) after
corrosion in the presence of 3 g/L OPEO; and (D) after
while, the ic of the sample with the commercial inhib- corrosion in the presence of 3.5 g/L URO
itor of 3.5 g/L URO only diminished more than six
times, even inferior when using OPEO.
Besides, the change in the cathodic Tafel slope
value in the presence of inhibitors also demonstrates inhibitors 3 g/L OPEO and 3.5 g/L URO. The pitting
effect of the inhibitor on the kinetics of the hydrogen corrosion of mild steel in 1N HCl solution with the
evolution. As the previous report, a slight increase in presence of OPEO or URO is approximately and they
the anodic Tafel slope is related to adsorption of chlo- are much lower than that in the blank solution. This is
ride ion and/or inhibitor molecules on the metal sur- entirely consistent with the results of inhibition effi-
face [22]. According to Eq. (1), inhibition efficiency ciency of OPEO and URO estimated by the previous
Hi was calculated and shown in Table 2. Interestingly, electrochemical and weight-loss measurement. This
at the concenctrations of 3-4 g/L, OPEO showed the suggests that OPEO and URO can effectively inhibit
inhibition efficiency over 92 %, even higher than that pitting corrosion of mild steel in 1N HCl solution.
of the traditional corrosion inhibitor of URO (84.2 In order to investigate the corrosion inhibitor
%), which was used at the standar concentration of mechanism of OPEO, EIS spectra of the mild steel in
3.5 g/L for acid pickling of the steel. This demon- the absence and presence of OPEO inhibitor were
strates excellent inhibition ability of OPEO. measured. As shown in Fig. 4A, Nyquist spectra of
The weight-loss measurement was also conducted the mild steel are composed of two semicircles: a
to compare the inhibition efficicency of OPEO with capacitive semicircle in the high-to-medium fre-
the traditional inhibitor URO for the mild steel in the quency range, and an inductive semicircle at the low
1N HCl acid after different immersion times and the frequency range. The capacitive semicircle rep-
results were shown in Fig. 2. The studied resutls indi- resents charge transfer of the corrosion process while
cate that HW of OPEO and URO are approximately the inductive semicircle represents the relaxation pro-
after all testing time and trend to lightly increase with cess of adsorption (ads) of species such as H2O, Cl-
time and reach the stable value of about 90% after 6h and H + and/or organic molecules of OPEO on the
immersion time in the 1N HCl acid. electrode surface. In general, the presence of OPEO
Moreover, the morphology comparison of the sam- in the corrosive solution hardly changed appearance
ple surfaces by SEM images was shown in Fig. 3. A of Nyquist spectra demonstrating the similar corro-
smooth surface in the mild steel sample before exam- sion mechanism of the mild steel in the studied solu-
ination (Fig. 3A) and a pitted surface after immersion tions. Noticeably, the diameter of two semicircels of
in 1N HCl solution (Fig. 3B) were observed. The Fig. Nyquist plots increased with increasing OPEO con-
3 (C and D) reveal a smooth surface with smaller and centration in the test solutions. This suggests the for-
shallower pits for the samples in the solution with the mation of protective film resulting in adsorption of
74                   Huyen T.T. Bui et al. / J. Electrochem. Sci. Technol., 2019, 10(1), 69-81

Fig. 4. (A) Nyquist plots of the mild steel in 1N HCl solutions in the absence and presence of OPEO with various
concentrations (1÷4 g/L); (B) Relevant equivalent circuit model used for fitting measured impedance data. R is solution
                                                                                                               s

resistance; R is charge transfer resistance; CPE is the constant phase element; R and L are inductive parameters
                ct                                                                 L

Table 3. EIS parameters for the mild steel in 1N HCl solution in the absence and presence of OPEO fitted by the
equivalent circuit
     C
     OPEO    (g/L)   R (Ω.cm )
                       s
                                 2
                                       R (Ω.cm )
                                        ct
                                                    2
                                                           Y (μF)
                                                            0                  n             C (μF/cm )
                                                                                              dl
                                                                                                           2
                                                                                                                   H (%)
                                                                                                                    R

         0                 0.7                80           56.10             0.911                 75.53                -
         1                 0.6               324           58.60             0.842                 69.67           75.3
         2                 0.6               479           50.90             0.883                 65.60           83.3
         3                 0.6               980            19.2             0.867                 23.02           91.8
         4                 0.5               1258          22.03             0.863                 34.68           93.6

the inhibitor molecules on the surface of mild steel.
                                                                                   1–n 1⁄n
Accordingly, the active surface area of the mild steel             C dl = ( Y0 R ct    )                                    (5)
was probably reduced and its corrosion resistance
was enhanced.                                                      Wherein, Y0 is proportional factor, and n is the
   Further, to simulate accurately corrosion process            phase shift. A couple of Y0 and n are two feature
occuring, an equivalent circuit was used (Fig. 4B).             parameters of the CPE [31].
Since the capacitive semicircle is depressed but not               As shown in Table 3, the charge transfer resistance
perfect one, constant phase element (CPE) was uti-              of the mild steel remarkably increased after addition
lized to substitute double layer capacitance (Cdl) as           of OPEO in the test solution. In specific, in the pres-
well-known. The depressed semicircle is obtained as             ence of 4 g/L OPEO the charge transfer resistance
a result of surface heterogeneity caused by surface             increased nearly sixteen times in comparison with
roughness, dislocation, distribution of active sites, or        that in the absence of OPEO. The increase in Rct val-
adsorption of the inhibitor molecules [22]. Apart               ues is attributed to the formation of the protective
from solution resistance (Rs), charge transfer resis-           film of the inhibitor on metal/solution interface in the
tance (Rct), and constant phase element (CPE), the              corrosive solution in the presence of OPEO. More-
parallel combination of L and RL was also introduced            over, better anti-corrosion behavior was observed for
into the equivalent circuit to explain the inductive            the samples in the test solution containing higher
semicircle observed in the Nyquist spectra [29,30].             OPEO concentration. Meanwhile, double layer
   After fitting the equivalent circuit, several typical        capacitance Cdl showed a decreasing tendency when
parameters such as Rs, Rct, Yo, and n of EIS spectra            OPEO inhibitor was added further in the test solu-
were recorded in Table 3. Especially, the parameter Cdl         tion. According to literature [5,12,27], the change in
in Table 3 was calculated based on the values of CPE            the C dl value is possibly accounted for a gradual
and Rct parameters through the following equation:              replacement of previously adsorbed molecules by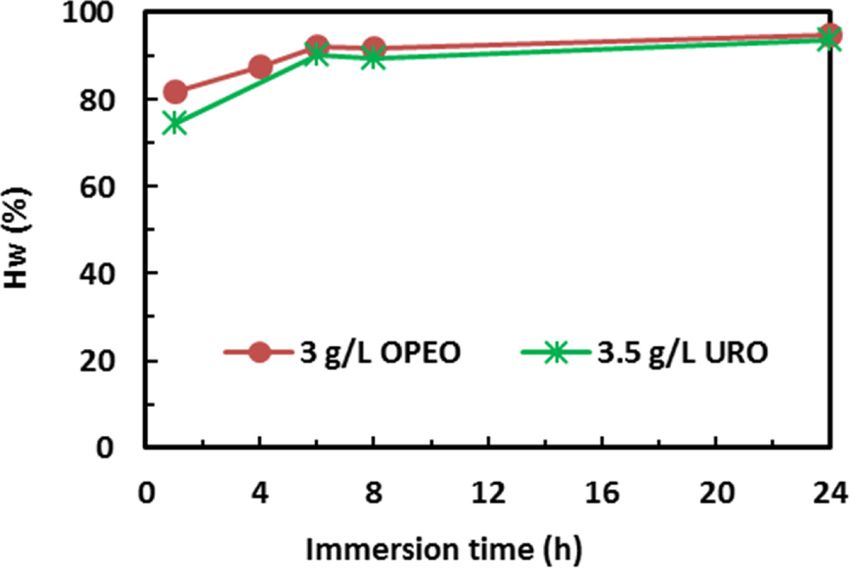
Huyen T.T. Bui et al. / J. Electrochem. Sci. Technol., 2019, 10(1), 69-81                     75

adsorption of the organic molecules of OPEO on the            Frumkin: lg[(θ /(1 - θ)C] = lgK + 2a θ/2.303       (8)
steel surface. This led to a decrease in local dielectric
constant and/or an increase in the thickness of the           Wherein θ is degree of surface coverage, K is the
electrical double layer. As a result, the double layer      adsorption-desorption equilibrium constant, C is the
capacitance decreased. Thus, this can be considered         inhibitor concentration, f and a are parameters related
as evidence for the presence of adsorbed layer of           to adsorbing interaction.
inhibitors on the steel surface. Other side, the value        Determination of the degree of surface coverage
of n parameter in Table 3, which reflects degree of         (θ) is based on assumption that the double layer
the surface heterogeneity [29], is found to diminish        capacitance is proportional to the surface fraction not
with the concentration of OPEO in the test solution.        covered by the inhibitor, or the charge transfer resis-
This implies better surface homogeneity degree              tance is proportional to the surface fraction covered
obtained owing to the adsorption of inhibitor mole-         by the inhibitor [13,15,35]. The fraction of the steel
cules on the active sites at the steel surface. Accord-     surface covered by the inhibitor was determined by
ingly, the corrosion of the mild steel can be retarded.     weight-loss method, based on the following equation:
   In addition, inhibition efficiency HR of OPEO was
also determined based on the Eq. (2). From Table 3, it        θ = (W0 - W) / W0                                  (9)
is easily recognized that when the concentration of
OPEO increased from 1 g/L to 4 g/L, inhibition                 Wherein W and W0 are the corrosion rate of the
efficiency HR enhanced from 75.3% to 93.6%. Espe-            steel sample in the presence and absence of the inhib-
cially, as the concentration of OPEO reached 3 g/L,         itor in the test solution, respectively.
the inhibition efficiency of OPEO was higher than              Fig. 5 depicts change of surface coverage of the
90%. The obtained result is consistent with that cal-       mild steel in the test solution containing OPEO with
culated from Tafel extrapolation method above.              various concentrations at 25 o C. Obviously, the θ
Hence, it is possible to believe that OPEO acts as an       value of the mild steel increased after addition of
excellent corrosion inhibitor with the high inhibition      OPEO to the test solution. Nevertheless, the degree
efficiency when added to the corrosive solution with         of surface coverage was found to reduce slightly just
a reasonable amount. The corrosion inhibition behav-        after the concentration of OPEO reached 3 g/L. This
ior of OPEO is likely to stem from the adsorption of        might be elucidated that when the OPEO concentra-
OPEO molecules on the steel surface.                        tion got over the optimum, a thick adsorption layer
                                                            was formed on the steel surface. At some certain
3.3 Insight of inhibition mechanism of OPEO                 sites, this adsorption film was probably exfoliated
  3.3.1 Adsorption characteristics                          partly. Accordingly, the degree of surface coverage
  In fact, adsorption property of the inhibitors is con-
cerned with numerous factors such as the nature and
state of the metal surface, the type of corrosive
m edium (neutral, alkaline or acidic m edia),
physicochemical properties of the inhibitor molecule
and molecular electronic parameters as well as the
adsorption species [4,32-34]. To understand the inhi-
bition mechanism of OPEO for corrosion reactions,
adsorption isotherms should be involved. In this
work, the adsorption property of OPEO on the steel
surface in the test solutions was examined by three
different isotherm models including Langmuir, Tem-
kin and Frumkin isotherms as the follows [32,35-37]:

  Langmuir: C/ θ = 1/K + C                           (6)
                                                            Fig. 5. Dependence of surface coverage of the mild steel
  Temkin: θ = (1/f)ln[KC]                            (7)    on the concentration of OPEO added in the test solutions.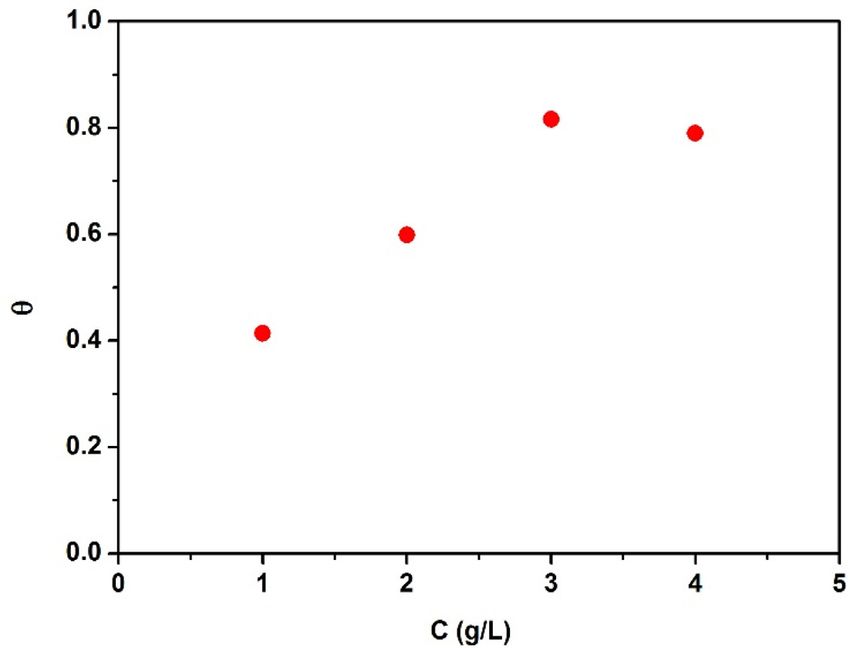
76                  Huyen T.T. Bui et al. / J. Electrochem. Sci. Technol., 2019, 10(1), 69-81

                                                             Table 4. The adsorption-desorption equilibrium constant K
                                                             (M ) and adsorption free energy ΔG calculated Langmuir
                                                               -1
                                                                                               ads

                                                             and Temkin models
                                                                          Langmuir model             Temkin model
                                                                                    ΔG                        ΔG
                                                                    o
                                                              T ( C)          -1        ads           -1            ads
                                                                        K(M )                   K(M )
                                                                                   (kJ/mol)                  (kJ/mol)
                                                                15       98.70      -20.62      743.59       -25.45
                                                                25       72.63      -20.58      544.70       -25.57
                                                                35      182.50      -23.63     1507.34       -29.03
                                                                45      196.91      -24.59     1772.90       -30.40
                                                                55       69.05      -22.50      500.02       -27.91
                                                                65       48.44      -22.19      743.59       -28.15

                                                               Although Langmuir isotherm provides the best
                                                             description of the adsorption behavior of OPEO
                                                             among three adsorption isotherm models owing to
                                                             the high correlation coefficient, the slopes of Lang-
                                                             muir isotherm plots obtained in Fig. 6A are more or
                                                             less than unity. This implies real adsorption of OPEO
                                                             did not completely obey all the assumptions required
                                                             for Langmuir adsorption isotherm. It is likely that
                                                             there was existence of multilayer adsorption of the
                                                             inhibitor molecules or lateral interactions between
                                                             the adsorbed species and the mild steel surface. Thus,
                                                             the calibrated Langmuir equation as below was
                                                             applied in this work [36-38]:

                                                               ---- = mC + m
                                                               C           ----                                      (10)
                                                               θ           K

                                                             where m is a linear calibrated coefficient.
                                                               The adsorption free energy was calculated accord-
Fig. 6. Isotherm adsorption of inhibitor on the surface of   ing to the following equation [13,39]:
the mild steel in 1N HCl at different temperatures: (A)
Langmuir isotherm; (B) Temkin isotherm and (C) Frumkin
                                                               ΔGads = -2.303 RT lg(55.5 K)                          (11)
isotherm

                                                               Where ΔGads is the adsorption free energy, R is
decreased slightly when the concentration of OPEO            the ideal gas constant, 55.5 is the water concentra-
increased up to 4 g/L. The similar phenomenon cov-           tion and T is the temperature and the adsorption-
erage was found as for the samples measured in the           desorption equilibrium constant (K) is determined
temperature range of 15~65oC.                                from the slope of the Langmuir and Temkin iso-
  Fig. 6 illustrates various adsorption isotherm plots       therm.
of the steel in the test solutions at the temperatures         After calculation, the values of adsorption free
from 15 to 65oC. As seen in Fig. 6A, B, Langmuir and         energy ΔGads of the mild steel at different tempera-
Temkin isotherms plots, which are different from             tures are listed in Table 4. As seen, the ΔGads range
Frumkin isotherm plots (Fig. 6C), fit the experimental       of -20.62 ~ -24.59 kJ/mol accounts for Langmuir
data well. This is reflected by R correlation coefficient    isotherm model and of -25.45 ~ -29.03 kJ/mol for
(R ≥ 0.8 in Langmuir and Temkin isotherms plots).            Temkin isotherm model at the investigated tempera-
Huyen T.T. Bui et al. / J. Electrochem. Sci. Technol., 2019, 10(1), 69-81 77 ture of 15oC ~ 65oC. The negative values of ΔGads immersed in the test solution without OPEO (blank suggest that the adsorption of OPEO on the steel solution) shows the heavily deteriorated surface with surface occurred spontaneously. Alternatively, very dense pits (Fig. 7B). Generally, the corrosion according to the previous reports ΔG ads > -40 pits were formed at the grain boundary regions, kJ·mol -1 represent the physical adsorptions and where the surface energy is favorable [42]. Appear- ΔGads
78                     Huyen T.T. Bui et al. / J. Electrochem. Sci. Technol., 2019, 10(1), 69-81

Table 5. The compositions of the mild steel surface before and after corrosion in the test solutions in the absence and
presence of 3 g/L OPEO inhibitor.
                                                                     Element content, % wt.
Test solution     Sample        Position
                                               C       O      Si      S       Cl       Cr      Fe       Cu      Total
       -          Pristine    Whole surface     -      -     0.24      -       -      0.26     99.5      -      100
                              Whole surface   1.77    0.89   1.29    0.00    0.05     0.17    95.06    0.77     100
                               Dark region    1.98    0.15   1.29    0.10    0.07     0.4      95.1    0.92     100
                 After test
                              White region    2.16    1.04   0.45    0.05    0.00     0.12    95.07    1.12     100
                                Pit region    2.79    5.79   0.25    0.16    0.12     0.00    89.89    0.99     100
     Blank
                              Whole surface   0.84    0.73   0.15    0.05    0.00     0.31    97.64    0.27     100
                 After test    Dark region    0.75    1.34   0.44    0.04    0.01     0.14    97.14    0.14     100
                followed by
                   rinsing    White region    2.34    0.89   0.38    0.07    0.03     0.17    95.38    0.74     100
                                Pit region    0.76    3.01   0.76    0.14    0.01     0.18    94.83    0.31     100
                              Whole surface   7.58    0.63   0.41    0.03    0.02     0.25    91.09    0.00     100
                 After test    Dark region    40.78   2.98   0.13    0.13    0.16     0.18    55.49    0.16     100
   In the                       Pit region    19.55   1.5    0.34    0.00    0.11     0.15    78.25    0.10     100
 presence
 of OPEO                      Whole surface     -      -     0.38    0.04    0.03     0.08    99.18    0.29     100
                 After test
                followed by    Dark region    0.25     -     0.31      -       -      0.10    98.91    0.43     100
                   rinsing
                                Pit region    2.55     -     0.18      -       -      0.25    96.88    0.15     100

pitting corrosion of mild steel in 1N HCl solution.          tive film as well as the corrosion products was
  Table 5 presents EDS analysis data of the steel sur-       removed out of the steel surface after the rinse. How-
face with and without 3 g/L of OPEO at selected differ-      ever, the trace of C element was still found at some
ent position corresponding to SEM images in Fig. 7.          certain positions such as dark regions or pits.
  As for the sample immersed in the blank solution,             In fact, in the presence of OPEO the high content
apart from main elements of carbon steel such as C,          of C and Cl elements was recorded to be highest at
Si, S, Cr, Cu and Fe, other elements including O and         the dark region (indicated in Fig. 7D), which is much
Cl were detected. The presence of O and Cl elements          far different from that analyzed at the white region
represents the corrosion products, viz. FeCl 2 ,             and the pit region. This demonstrates totally inhomo-
FeClOH [42,43]. Especially, O content (5.79%) and            geneous adsorption of OPEO on the steel surface.
Cl content (0.12%) at the corrosion pit region were          Herein, the high content of Cl is probably attributed
higher than that at other regions. Their content             to synergic effect of OPEO and halogen-containing
reduced after the sample was rinsed.                         compounds which promotes the adsorption of the
  For the sample in the presence of OPEO inhibitor,          inhibitor on metal surface [35]. After rinsing, the
as expected the content of C (7.58%) on the corrosed         surficial composition of the steel surface after corro-
steel surface is much higher than that (1.77%) of the        sion in the presence of OPEO was similar to the pris-
sample in the absence of OPEO. This is evidence for          tine sample, indicating that steel surface was
the presence of the organic protective film on the sur-      protected relatively efficiently from corrosion in 1N
face of the mild steel after addition of OPEO to the         HCl acid. EDS results also confirmed that the forma-
corrosive solution. It is noticeable that after rinsing      tion of protective film on the steel surface in the HCl
the C content at every region selected for analysis          acidic solution with OPEO is due to the adsorption of
decreased suddenly. In particular, the C content             the constituents of OPEO which contain C and O ele-
decreased from 7.58% to 0% (not detected) on the             ments (Table 1), thus inhibiting the steel corrosion
whole surface. This implies that the organic protec-         process.
Huyen T.T. Bui et al. / J. Electrochem. Sci. Technol., 2019, 10(1), 69-81 79
Table 6. Data analysis of FTIR spectrum of the absorption
film formed on the steel surface
Wave number
No -1
Functional group
ν (cm )
1 478 α-Fe O
2 3
2 1039 γ-FeOOH
3 1629.1 C=C
4 1763.6 C=O
5 2959.7 and 2924.3 C-H
6 3188.7 O-H
7 1440.8 =C-H
8 1023.9 C-O-C
Fig. 8. FTIR spectrum in the region of 400-4000 cm of
-1
the film formed on the mild steel surface after 24 hour 9 764.1 =C-H (in aroma)
o
immersed in 1N HCl solution with 3 g/L OPEO at 25 C
To further verify the chemistry surface property of
the adsorbed and protective film on the mild steel
surface in the solution with OPEO inhibitor, the sam-
ple was examined by FTIR method. Fig. 8 shows the
FTIR spectrum of the film separated from the steel
surface after 24 h of immersion in 1N HCl solution
with 3 g/L OPEO at 25 o C. Analysis results from
FTIR spectrum is also listed in Table 6.
It is worthy to see that important adsorption bands Fig. 9. The adsorption model of OPEO on the mild steel
at 1629.1 cm -1 and 1763.6 cm -1 correspond to C=C surface
and C=O stretch, respectively. Moreover, the pres-
ence of C-H stretch at 2959.7 and 2924.3 cm-1 could
be found from the spectrum as well. The feature structure formula of Limonene is presented in Fig. 9
absorption peak of O-H and =C-H groups locate at showing C-C, C=C and C-H bonds in Limonene’
3188.7 cm -1 and 1440.8 cm -1 , respectively. The structure. However, the adsorbed film contains the
absorption bands at 1085.4 and 1023.9 cm-1 indicates other adsorbed groups such as C=O, O-H and C-O-C,
C-O-C stretch, and a small absorption band of indicating the presence of other compounds in
764.1 cm-1 represents =C-H group in aromatic rings OPEO. Therefore, it is concluded that the attendance
[44-46]. Interestingly, the peaks at 478 cm -1 and of these compounds other than the limonene contrib-
1039 cm-1 was found, suggesting the presence of the ute to the corrosion inhibition for mild steel in HCl
corrosion products of mild steel (include α-Fe2O3 and acid. In addition, the organic compounds in acid
γ-FeOOH) [47]. Thus, the composition of the media can be acidified or participate in physiochemi-
adsorbed film formed on the steel surface in the pres- cal reactions to form byproducts or intermediate
ence of OPEO inhibitor firmly includes the com- products which can serve as secondary inhibitors for
pounds which contain functional groups of C=O, steel corrosion in acid solutions [4,48]. Therefore, the
C=C, C-H, O-H, aromatic ring and C-O-C in their adsorption of OPEO on the steel surfaces can be visu-
structures. alized through the adsorption of D-Limonene and
According to the previous report of Chaieb E. et al several other feature bonds in the constituents of
[15], a compound, namely Limonene, extracted from OPEO such as C=C and C=O as shown in Fig. 9. The
orange peel was demonstrated as a green inhibitor for figure describes the adsorption model of limonene via
steel corrosion in 1M HCl solutions. Meanwhile, the two C=C bonds at carbon position 3-4 and 8-9, as80 Huyen T.T. Bui et al. / J. Electrochem. Sci. Technol., 2019, 10(1), 69-81
well as illustrates the adsorption model of C=C and [5] S. Banerjee, V. Srivastava and M. M. Singh, Corros.
C=O bonds in constituents of OPEO on the mild steel Sci., 2012, 59, 35-41.
surface. [6] Jamiu K. Odusote and O. M. Ajayi, J. Electrochem. Sci.
Technol., 2013, 4(2), 81-87.
[7] R. M. Saleh, A. A. Ismail and A. H. E. Hosary, Br.
4. Conclusions Corros. J., 1982, 17(3), 131-135.
[8] E. E. Oguzie, Corros. Sci., 2008, 50(11), 2993-2998.
In the present study, the corrosion inhibition mech- [9] A. Batah, A. Anejjar, L. Bammou, M. Belkhaouda, R.
anism of Vietnam orange peel essential oil (OPEO) Salghi and L. Bazzi, J. Mater. Environ. Sci., 2017, 8(9),
for mild steel in the 1N HCl solution was investi- 3070-3080.
gated. In the corrosive solutions, OPEO play a role of [10] W. Yang, Q. Wang, K. Xu, Y. Yin, H. Bao, X. Li, L. Niu
and S. Chen, Materials, 2017, 10(8), 956.
a mixed-type inhibitor. OPEO enabled alleviating
[11] M. A. Quraishi, D. K. Yadav and I. Ahamad, The Open
anodic dissolution reactions and retarding cathodic Corros. J., 2009, 2(1), 56-60.
hydrogen evolution reactions in the corrosion pro- [12] A. Singh, E. E. Ebenso and M. A. Quraishi, Int. J.
cess. The corrosion inhibition mechanism of OPEO Corros., 2012, 2012.
is derived from adsorption ability on the surface of [13] B. R. Pandian, A. K. Qureshi, A. A. Rahim, H. Osman
the mild steel. Through thermodynamic calculation and K. Awang, Corros. Sci., 2013, 69, 292-301.
based on Langmuir, Temkin and Frumkin isotherm [14] J. C. da Rocha, J. A. da Cunha Ponciano Gomes and E.
D’Elia, Corros. Sci., 2010, 52(7), 2341-2348.
models, it was found that adsorption characteristics of
[15] E. Chaieb, A. Bouyanzer, B. Hammouti and M.
OPEO are not fully monolayer adsorption. Possibly, Berrabah, Acta Phys. Chim. Sin., 2009, 25(7), 1254-
there has been existence of multilayer adsorption of 1258.
the organic molecules of OPEO inhibitor or lateral [16] J. C. d. Rocha, J. A. d. C. P. Gomes and E. D'Elia,
interactions between the adsorbed species on the mild Mater. Res., 2014, 17(6), 1581-1587.
steel surface. The adsorption of OPEO obeys the phys- [17] A. Batah, M. Belkhaouda, L. Bammou, A. Anejjar, R.
ical adsorption mechanism with the free energy ΔGads Salghi and B. Hammouti, Mor. J. Chem., 2017, 5(4),
580-589.
in arrange of -20.62 to -24.59 kJ/mol for Langmuir iso-
[18] I. B. Obot and N. O. Obi-Egbedi, Int. J. Electrochem.
therm model and -25.45 to -29.03 kJ/mol for Temkin Sci., 2009, 4(9), 1277-1288.
isotherm. Among components of OPEO, out of the [19] A. M. Al-Fakih, M. Aziz and H. M. Sirat, J. Mater.
mainly active agent of D-limonene, other compounds Environ. Sci., 2015, 6(5), 1480-1487.
also contribute to enhancement of corrosion inhibition [20] H. Elmsellem, M. H. Youssouf, A. Aouniti, T. Ben
for the steel in acid environment. These compounds Hadda, A. Chetouani and B. Hammouti, Russ. J. Appl.
are feature by C=O, C=C, O-H, C-O-C, –C=CH and Chem., 2014, 87(6), 744-753.
[21] A. Y. El-Etre and M. Abdallah, Corros. Sci., 2000,
C-H bonding groups present in their molecules. With
42(4), 731-738.
the high inhibition efficiency over 90 % corresponding [22] S. K. Shukla, M. A. Quraishi and E. E. Ebenso, Int. J.
to the concentration of 3-4 g/L and equivalent to 3.5 g/ Electrochem. Sci., 2011, 6, 2912-2931.
L of urotropine (a commercial inhibitor in industry), [23] K. S. Ashish, S. K. Shukla and M. A. Quraishi, Int. J.
OPEO is believed to be a potential green corrosion Electrochem. Sci., 2011, 6, 5802-55814.
inhibitor for mild steel in HCl acid due to its none tox- [24] A. S. Fouda, A. M. El-Defrawy and M. W. El-Sherbeni,
icity, biodegradability, low cost and availability of J. Electrochem. Sci. Technol., 2013, 4(2), 47-56.
[25] Corrosion of metals and alloys - Removal of corrosion
large quantity requirements.
products from corrosion test specimens, ISO, Geneva,
Swetzeland, 1991.
References [26] B. D. Mert, M. Erman Mert, G. Kardaş and B. Yazıcı,
Corros. Sci., 2011, 53(12), 4265-4272.
[1] Shefali Dahiya, Suman Lata, Parmod Kumar and Rajeev [27] Z. Tao, W. He, S. Wang, S. Zhang and G. Zhou, J.
Kumar, Corros Rev, 2016, 34(4), 241-248. Mater. Eng. Perform., 2013, 22(3), 774-781.
[2] A.S. Fouda, M. T. Mohamed and M. R. Soltan, J. [28] S. A. Umoren, Y. Li and F. H. Wang, Corros. Sci., 2010,
Electrochem. Sci. Technol., 2013, 4(2), 61-70. 52(5), 1777-1786.
[3] N. A. A. Ghany, M. F. Shehata, R. M. Saleh and A. A. [29] M. Lebrini, F. Robert, P. A. Blandinières and C. Roos,
E. Hosary, Mater. Corros., 2016, 68(3), 355-360. Int. J. Electrochem. Sci., 2011, 6(7), 2443-2460.
[4] S. Papavinasam, ‘Uhlig’s Corrosion Handbook’, 3rd [30] Sumithra Kadapparambil, Kavita Yadav, M.
ednJohn Wiley & Sons, Inc, Place PUblished, 2011. Ramachandran and N. V. Selvam, Corros. Rev., 2017.Huyen T.T. Bui et al. / J. Electrochem. Sci. Technol., 2019, 10(1), 69-81 81
[31] R. Solmaz, Corros. Sci., 2014, 81, 75-84. World Scientific News, 2017, 77(2), 298-313.
[32] P. M. Ejikeme, S. G. Umana, I. J. Alinnor, O. D. [41] R. Saratha, S. V. Priya and P. Thilagavathy, E-J. Chem.,
Onukwuli and M. C. Menkiti, Am. J. Mater. Sci., 2014, 2009, 6(3), 785-795.
4(5), 194-201. [42] E. A. Noor and A. H. Al-Moubaraki, Int. J.
[33] A. Khamis, M. M. Saleh and M. I. Awad, Int. J. Electrochem. Sci., 2008, 3(1), 806-818.
Electrochem. Sci., 2012, 7, 10487-10500. [43] O. A., S. M. Hoseinieh, M. Peikari, S. R. Shadizadeh
[34] A. Ousslim, A. Chetouani, B. Hammouti, K. Bekkouch, and S. J. Hashemi, Corros. Sci., 2009, 51(9), 1935-1949.
S. S. Al-Deyab, A. Aouniti and A. Elidrissi, Int. J. [44] Nnabuk Okon Eddy, Paul Ameh, Casmir E. Gimba and
Electrochem. Sci., 2013, 8(4), 5980-6004. a. E. E. Ebenso, Int. J. Electrochem. Sci., 2011, 6, 5815-
[35] F. S. de Souza and A. Spinelli, Corros. Sci., 2009, 51(3), 5829.
642-649. [45] S. Leelavathi and R. Rajalakshmi, J. Mater. Environ.
[36] S. Ambrish, V. K. Singh and M. A. Quraishi, Int. J. Sci. , 2013, 4(5), 625-638.
Corros., 2010, 2010. [46] Y. Yetri, Emriadi, N. Jamarun and Gunawarman, Int.
[37] I. B. Obot, N. O. Obi-Egbedi, S. A. Umoren and E. E. Conf. Biol., Chem. Environ. Sci., 2014, 15-19.
Ebenso, Int. J. Electrochem. Sci., 2010, 5(7), 994-1007. [47] A. Bewick, M. Kalaji and G. Larramona, J. Electroanal.
[38] G. Karthik and M. Sundaravadivelu, ISRN Chem., 1991, 318, 207-221.
Electrochemistry, 2013, Article ID 403542, 10 pages. [48] L. L. Liao, S. Mo, J. L. Lei, H. Q. Luo and N. B. Li, J.
[39] N. O. Eddy and S. A. Odoemelam, Adv. in Nat. Appl. Colloid Interface Sci., 2016, 474, 68-77.
Sci. 2008, 2(3), 225-232.
[40] F. E. Abeng, V. D. Idim, O. E. Obono and T. O. Magu,You can also read