Comparison of Various Foods Intakes and Their Relationships with Body Mass Index in Japanese Old Men and Women - Scientific Research Publishing
←
→
Page content transcription
If your browser does not render page correctly, please read the page content below
Food and Nutrition Sciences, 2021, 12, 591-601
                                                                                                https://www.scirp.org/journal/fns
                                                                                                           ISSN Online: 2157-9458
                                                                                                             ISSN Print: 2157-944X

Comparison of Various Foods Intakes and Their
Relationships with Body Mass Index in
Japanese Old Men and Women

A. Takada1*, F. Shimizu2, Y. Ishii2, M. Ogawa2, T. Takao2
1
    International Projects on Food and Health (NPO), Tokyo, Japan
2
    Faculty of Human Life and Environmental Sciences, Showa Women’s University, Tokyo, Japan

How to cite this paper: Takada, A., Shi-         Abstract
mizu, F., Ishii, Y., Ogawa, M. and Takao, T.
(2021) Comparison of Various Foods In-           Objective: Obesity is an important health problem, leading to many meta-
takes and Their Relationships with Body          bolic diseases such as type2 diabetes mellitus, cardiovascular diseases, can-
Mass Index in Japanese Old Men and
                                                 cer etc. There are many diet proposals to combat obesity. Since obesity is
Women. Food and Nutrition Sciences, 12,
591-601.                                         relatively rare in Japan, we wanted to know what kinds of foods influence
https://doi.org/10.4236/fns.2021.126044          body mass index (BMI) in old Japanese people. Methods: Healthy partici-
                                                 pants were given self-administered diet history questionnaires and de-
Received: May 17, 2021
Accepted: June 26, 2021
                                                 scribed answers on each item by recollection of diets they took (7 days di-
Published: June 29, 2021                         etary recall). We used a brief-type self-administered diet history question-
                                                 naire (BDHQ) by using which the Japanese Ministry of Health, Labour and
Copyright © 2021 by author(s) and
                                                 Welfare reports national Nutrition Surveys. From these questionnaires, we
Scientific Research Publishing Inc.
This work is licensed under the Creative         calculated the intakes of energy, carbohydrate, fat, protein or other foods.
Commons Attribution International                Results: Men take more alcohol, salt fruit, beans, and eggs than women.
License (CC BY 4.0).                             Intakes of major foods such as carbohydrate, lipid, and protein did not in-
http://creativecommons.org/licenses/by/4.0/
                                                 fluence BMI in men and women. Conclusion: Within the range of foods
                 Open Access
                                                 intakes in Japan, no restriction of any food such as carbohydrate is not ne-
                                                 cessary for staying lean.

                                                 Keywords
                                                 Carbohydrate, Protein, Fish, Glucose, Insulin, BMI (Body Mass Index), Obesity

                                               1. Introduction
                                               Obesity has been dramatically increased world-widely and to know the effective
                                               and safe weight-loss diets must be investigated [1] [2] [3].
                                                 Effects of various weight-loss diets have been proposed and compared. Low

DOI: 10.4236/fns.2021.126044 Jun. 29, 2021                        591                                 Food and Nutrition Sciences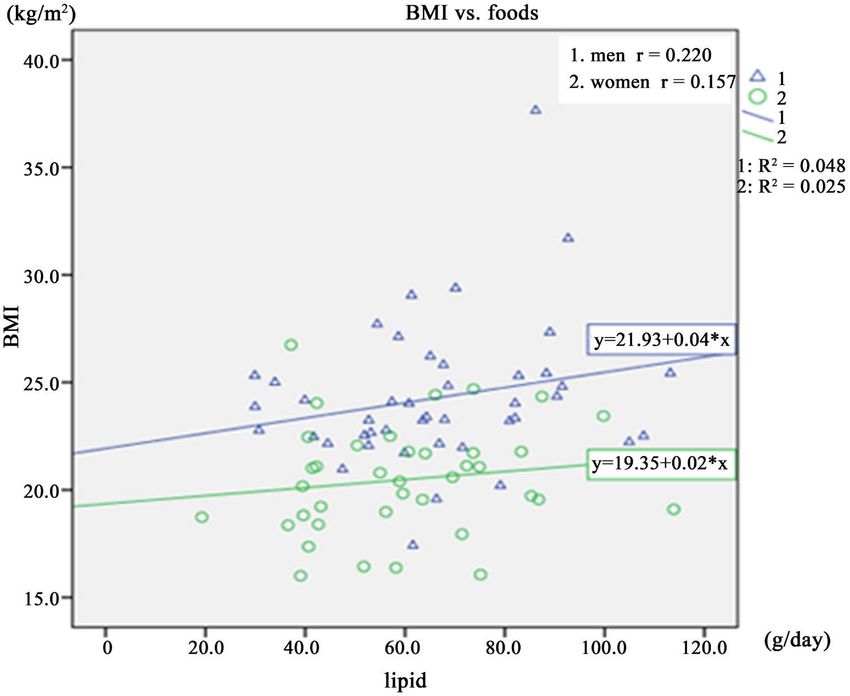
A. Takada et al.

                               carbohydrate, high-protein diets were compared with very low fat, energy-restricted
                               diets [4] [5] [6] [7].
                                  Recently the carbohydrate-insulin model has been proposed [8]. According to
                               this model, the hormone insulin plays dominant anabolic control. Insulin de-
                               creases the circulating major metabolic fuels by stimulating glucose uptake into
                               tissues, inhibiting release of fatty acids from adipose tissue, so that ketones are
                               produced in the liver, and promoting fat and glycogen deposition. Consistent
                               with these effects, increased insulin actions (such as insulin-producing tumors,
                               initiation of insulin treatment of type 2 diabetes or overtreatment of type 1 di-
                               abetes) are shown to be associated with weight gain. Interestingly, inadequate
                               insulin treatment of type 1 diabetes and drugs that inhibit insulin secretion
                               causes weight loss.
                                  Dietary carbohydrate has the most potent effects, which vary by amount
                               and type. Most refined grains, potato products and added sugars digest
                               quickly and have a relatively high GI (glycemic index), whereas non-starchy
                               vegetables, legumes, whole fruits and intact whole grains tend to have a mod-
                               erate or low GI.
                                 The Mediterranean diet was rich in vegetables and low in red meat, with
                               poultry and fish replacing beef and lamb. Mediterranean and low-carbohydrate
                               diets were shown to be effective alternatives to the low-fat diet for weight loss
                               and appear to be just as safe as the low-fat diet [9].
                                 As stated later, the rate of obese people is very low, in fact, one of OECD
                               countries with the lowest obesity rate [10]. We have previously reported
                               correlations between various foods intakes, plasma levels of amino acids or
                               fatty acids in Japanese young and old men and women [11] [12] [13] [14]. So
                               it may be interesting to know what kinds of foods old Japanese men and
                               women are taking and whether any kind of foods intake influences body
                               mass index.
                                 In the present article, we report various foods intakes and their relationships
                               to BMI in old Japanese men and women.

                               2. Method
                               We asked male and female acquaintances older than 50 years old. Acquain-
                               tances mean that these participants are personal friends of our group
                               members. The sample sizes and ages of participants are as follows. Acquain-
                               tances are older than 50 years old; men (n = 44, age; 70.07 ± 11.1) and women
                               (n = 39, age; 67.4 ± 7.5). We did not ask premenopausal women to participate
                               since data may be variable due to their hormonal influences so that sample
                               sizes must be big to get statistically significant results. Dr. K. Matsuoka and K.
                               Kato, who are internists, checked their health carefully and examined their
                               blood samples then recruited them if there were no health problems such as
                               diabetes, hypertension or not serious diseases experienced in the past. They
                               did not smoke in the past. We also excluded people who took drugs for dysli-

DOI: 10.4236/fns.2021.126044                        592                                 Food and Nutrition Sciences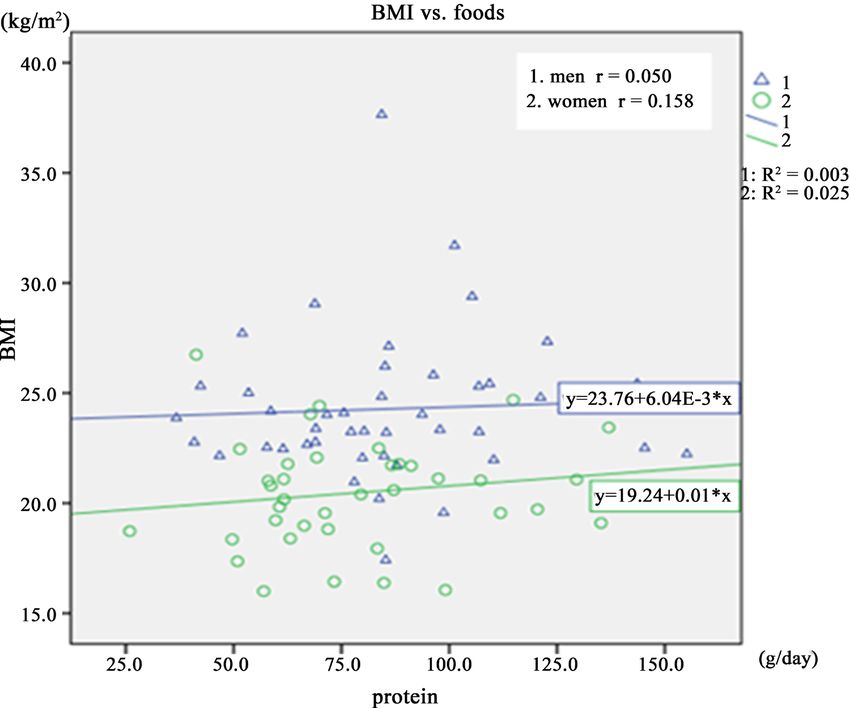
A. Takada et al.

                               pidemia, hyperglycemia, or hypertension. We collected blood samples early
                               morning. Healthy participants were given self-administered diet history ques-
                               tionnaires and described answers on each item by recollection of diets they
                               took (7 days dietary recall). We used a brief-type self-administered diet his-
                               tory questionnaire (BDHQ) by using which the Japanese Ministry of Health,
                               Labour and Welfare reports national Nutrition Surveys. From these ques-
                               tionnaires, we calculated the intakes of energy, carbohydrate, fat, protein or
                               other foods.

                               Statistics
                               The results are presented as means ± SEM. Statistical significance of the differ-
                               ences between groups was calculated according to one-way ANOVA. When
                               ANOVA indicated a significant difference (p < 0.05), the mean values were
                               compared using Tukey’s least significant difference test at p < 0.05. Spearman’s
                               correlation tests were used to examine statistical significance.

                               3. Results
                               Table 1 shows that height, weight and BMI (body mass index) are larger in men
                               than women.
                                  Table 2 shows the amounts of foods intakes of men and women.
                                  The amounts of energy intake are larger in men than women. The amounts of
                               intakes of protein, carbohydrate, lipid fatty acids or other foods are not different
                               between men and women.
                                  The amounts of intakes of alcohol, salt, sucrose, beans, beverages and season-
                               ings are higher in men than women. Since people take salty cakes, beans when
                               they take alcohol or beverages such as Sake in Japan, such habits influence men’s
                               foods intakes.
                                  Table 3 shows a correlation between foods and BMI. There is no correlation
                               between any food intake and BMI in women. There are correlations between in-
                               takes of vegetable lipid, n − 6 fatty acid, fruits and eggs and BMI in men.
                                  Figure 1 shows Scatter plots and regression line between intakes of carbohydrate
                               and BMI in men and women.
                                  Figures 1-3 show there is no correlation between intakes of carbohydrate, li-
                               pid and protein and BMI.

                               Table 1. Basic characteristics of participants.

                                                                      Old men      Old women
                                                                                                       Significance
                                                                       n = 44        n = 39

                                     Age                             70.7 ± 11.1   67.4 ± 7.5

                                   Height             cm             166.5 ± 6.6   157.1 ± 5.8             **

                                   Weight             kg             67.4 ± 11.1   50.6 ± 6.8              **

                                    BMI             kg/m2            24.3 ± 3.3    20.5 ± 2.5              **

                               **p < 0.01 (old men vs. old women).

DOI: 10.4236/fns.2021.126044                               593                             Food and Nutrition Sciences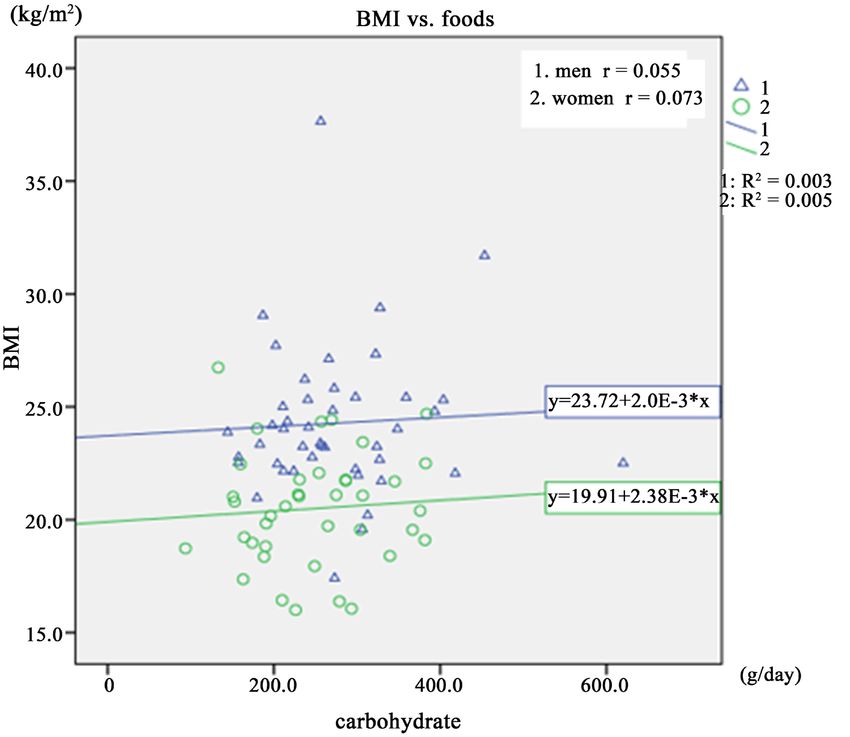
A. Takada et al.

                               Table 2. The amounts of various foods intakes.

                                    Foods intakes of men and women
                                                                            Old men n = 44   Old women n = 39   Significance
                                              Foods               Per day

                                              Energy              kcal/d      2265 ± 621        1941 ± 535           *

                                              Protein              g/d        86.2 ± 27.7       80.0 ± 27.3

                                         Animal protein            g/d        51.8 ± 22.0       47.4 ± 19.8

                                        Vegetable protein          g/d        34.4 ± 9.9        32.6 ± 10.9

                                               Lipid               g/d        66.4 ± 20.6       60.9 ± 20.9

                                           Animal lipid            g/d        32.2 ± 13.4       29.0 ± 10.7

                                         Vegetable lipid           g/d        34.2 ± 9.9        31.9 ± 11.9

                                          Carbohydrate             g/d       276.0 ± 89.4      248.2 ± 76.9

                                       Saturated aftty acid        g/d        17.7 ± 6.5        16.3 ± 5.6

                                    Monosaturated fatty acid       g/d        24.2 ± 7.6        21.6 ± 7.7

                                    Polysaturated fatty acid       g/d        15.6 ± 4.7        14.6 ± 5.3

                                           Cholesterol             mg/d      469.9 ± 183.2     440.4 ± 187.9

                                      Soluble dietary fiber        g/d         3.8 ± 1.4         4.0 ± 1.5

                                     Insoluble dietary fiber       g/d        11.2 ± 4.9        11.0 ± 4.1

                                        Total dietary fiber        g/d        15.5 ± 5.7        15.3 ± 5.7

                                                Salt               g/d        13.9 ± 4.2        11.5 ± 3.2          **

                                               Sugar               g/d        17.8 ± 10.9       15.1 ± 8.5

                                             Alcohol               g/d        28.0 ± 28.6       9.7 ± 16.5          **

                                         n − 3 fatty acid          g/d         3.4 ± 1.3         3.1 ± 1.4

                                         n − 6 fatty acid          g/d        12.2 ± 3.6        11.4 ± 4.0

                                              Grains               g/d       412.1 ± 165.8     338.6 ± 171.6

                                             Potatoes              g/d        63.4 ± 46.1       53.2 ± 41.3

                                             Sucrose               g/d         7.5 ± 5.8         5.1 ± 2.9           *

                                              Beans                g/d        59.0 ± 43.2       82.5 ± 59.3          *

                                  Green and yellow vegetables      g/d       148.0 ± 91.1      145.4 ± 75.7

                                        Other vegetables           g/d       222.9 ± 106.7     220.1 ± 117.5

                                              Fruits               g/d       159.1 ± 156.1     212.8 ± 115.9

                                               Fish                g/d       106.4 ± 63.6       94.0 ± 61.7

                                               Eggs                g/d        45.3 ± 31.9       41.9 ± 27.1

                                               Milk                g/d       154.3 ± 125.1     169.7 ± 105.1

                                               Oils                g/d        12.8 ± 5.6        11.1 ± 5.8

                                             Cookies               g/d        57.7 ± 45.1       62.1 ± 43.1

                                            Beverages              g/d      1043.9 ± 418.2     779.7 ± 429.9        **

                                        Seasonings, spices         g/d       296.5 ± 163.9     222.0 ± 140.7         *

                               **p < 0.01, *p < 0.05.

DOI: 10.4236/fns.2021.126044                                594                                 Food and Nutrition Sciences
A. Takada et al.
Table 3. Correlations between various foods intakes and BMI.
Correlations
BMI vs. foods Old men n = 44 Old women n = 39
Energy 0.072 0.125
Protein 0.050 0.158
Animal protein 0.000 0.125
Vegetable protein 0.144 0.168
Lipid 0.220 0.157
Animal lipid 0.091 0.066
Vegetable lipid 0.335* 0.216
Carbohydrate 0.055 0.073
Saturated fatty acid 0.108 0.145
Monounsaturated fatty acid 0.279 0.152
Polyunsaturated fatty acid 0.255 0.190
Cholesterol 0.228 −0.009
Soluble dietary fiber 0.204 0.080
Insoluble dietary fiber 0.222 0.161
Total dietary fiber 0.236 0.136
Salt 0.103 0.203
Sucrose 0.031 0.022
Alcohol −0.084 −0.024
n − 3 fatty acid 0.102 0.196
n − 6 fatty acid 0.298* 0.181
Grains −0.052 −0.009
Potatoes −0.030 −0.047
Sucrose −0.237 −0.037
Beans −0.061 0.289
Green yellow vegetables 0.174 0.095
Other vegetables 0.230 0.248
Fruits 0.298* −0.047
Fish −0.095 0.105
Meats 0.142 0.125
Eggs 0.367* −0.260
Milk −0.255 0.082
Oil 0.257 0.258
Cakes 0.203 0.068
Beverages −0.009 0.130
Seasonings, spices 0.012 0.023
*p < 0.05.
DOI: 10.4236/fns.2021.126044 595 Food and Nutrition SciencesA. Takada et al.
Figure 1. Scatter plots and regression lines of BMI vs. carbohydrate.
Figure 2. Scatter plots and regression lines between intakes of lipid and BMI.
DOI: 10.4236/fns.2021.126044 596 Food and Nutrition SciencesA. Takada et al.
Figure 3. Scatter plots and regression lines between intakes of protein and BMI.
4. Discussion
It has been recognized that a global epidemic of obesity is a threat of health and
functional independence of future cohorts of older adults. The obesity and
age-related elevation of metabolic risks contribute physical limitation and chronic
cardiometabolic disorders.
There have been many diet plans proposed to reduce body weights.
Low-carbohydrate, high-protein, high-fat diets, so called low-carbohydrate diet,
have been compared with low fat energy-restricted diets [4] [5] [6] [7].
Mediterranean diet with a moderate amount of fat and a high proportion of
monosaturated fat has been shown a benefit for cardiovascular diseases [9] [14]
[15].
Recently, carbohydrate insulin model has been proposed [8]. According to a
conventional model, overeating results in increase energy intake, which increases
levels of circulating metabolic fuels such as glucose or lipids, resulting in fat sto-
rage.
According to a carbohydrate insulin model, dietary carbohydrates or other di-
etary and non-dietary exposure result in increased secretion of insulin. Since in-
sulin increase uptake of glucose into adipose tissues, fat is stored. These changes
cause circulating metabolic fuels. These changes cause fat deposit and obesity.
It is now well known that obesity rates are different among countries. In
high-income countries, obesity rate (body mass index greater than or equal to 30
DOI: 10.4236/fns.2021.126044 597 Food and Nutrition SciencesA. Takada et al.
kg/m2) is highest among the poor, while overweight (body mass index greater
than or equal to 25 kg/m2) is shown across all wealth groups. In contrast, in
low-income countries, the prevalence of overweight and obesity is higher among
rich people than among poorer people [16].
Since 1975, the prevalence of overweight (body mass index (BMI) greater than
or equal to 25 kg/m2) among adults increased from 21.5% to 38.9% in 2016 [17].
Over this period, no country has shown decline in the prevalence of overweight
or obesity [18]. In 2000, the World Health Organization declared obesity a pan-
demic and 12 years later issued a global action plan to combat its rise [19] [20].
The rapid increase in overweight and no availability of population-level control
measures are considered to be important reasons of the rising disease burden
and mortality from cardiovascular disease, cancer, and diabetes. Overweight and
obesity do not display a consistent wealth gradient across different levels of eco-
nomic development. In most low- and middle-income countries, the prevalence
of overweight and obesity is higher among wealthier individuals than among
poorer. However, as national economic levels increase, the burden of overweight
and obesity shifts to populations with lower personal wealth [21] [22] [23].
Japan is one of the most affluent countries in the world. According to many
proposal that people in the affluent countries are obese because they eat so called
junk foods often.
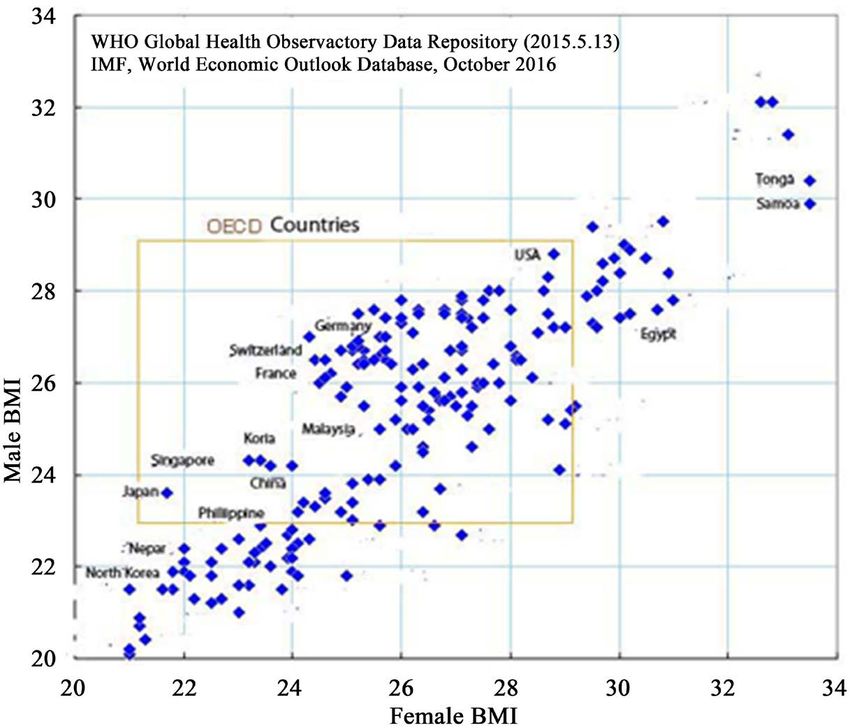
As shown in Figure 4, men and women in Japan are the leanest in the world.
People in other affluent countries such as USA are far more obese than Japanese.
In the present research, we asked healthy Japanese old men and women to
report their food intakes. As shown in Table 3 and Figures 1-3, BMI levels did
not change upon changes of intakes of carbohydrate, lipid and protein. These
Figure 4. BMI of people in different countries.
DOI: 10.4236/fns.2021.126044 598 Food and Nutrition SciencesA. Takada et al.
results suggest that within the range of intakes of foods n Japan, any kinds of
foods led to obesity or slimness.
It is very difficult to explain the reason why such results are obtained. Proba-
bly Japanese are very, very health concerned and try to pay much attention to
foods.
Finally, some eating habits typical in Japan are discussed. Japanese tend to
avoid to eat anything sweat. People think that sweat foods contain sucrose,
which has been reported repeatedly unhealthy. There is o custom to eat desserts
such as pie after the meal. People prefer to drink black coffee and many beve-
rages are advertised to be sugar free. Even beer or soft drinks are advertised to be
sugar free.
Japanese people are very health concerned. People often measure body
weights and try to keep slender.
Recently, eating meat or foods of low carbohydrate are considered to be
healthy and do not increase body weight.
People also try to be slender by increase exercise such as running, swimming,
or oriental ways of exercise such as yoga.
All together Japanese ways of living seem good for weight control, thus keep-
ing lean.
5. Conclusion
Foods intakes and correlations between BMI (body mass index) and various
foods intakes in old Japanese men and women were examined. Changes in the
amounts of various foods intakes such as carbohydrates, protein, and lipid did
not affect BMI.
Ethics
This work has been approved by the Ethical committees of Showa Women’s
University and NPO (non-profit organization) “International projects on food
and health” and has been carried out in accordance with the Code of Ethics of
the World Medical Association (Declaration of Helsinki) for experiments.
Acknowledgements
Experiments were designed and performed by all of the authors. AT wrote a
manuscript. Statistical analyses were done by FS. All authors read the manu-
script and approved the final version. All the authors had responsibilities for the
final content. AT is a chairman of NPO “International Projects on Food and
Health”. The NPO is financially supported by people who agreed with the pur-
pose of the organization and voluntarily donated for the project.
Financial Support
This study was supported by grants by NPO “International Projects on Food and
Health.
DOI: 10.4236/fns.2021.126044 599 Food and Nutrition SciencesA. Takada et al.
Conflicts of Interest
Since no profit is obtained by the present research, there are no conflicts of in-
terest, thus no conflicts of interest for any author.
References
[1] WHO (2000) Obesity: Preventing and Managing the Global Epidemic: Report of a
WHO Consultation. World Health Organization Technical Report Series 894,
1-253.
[2] Kuczmarski, R.J., Flegal, K.M., Campbell, S.M. and Johnson, C.L. (1994) Increasing
Prevalence of Overweight among US Adults: The National Health and Nutrition
Examination Surveys, 1960 to 1991. JAMA, 272, 205-211.
https://doi.org/10.1001/jama.1994.03520030047027
[3] Poirier, P., Giles, T.D., Bray, G.A., et al. (2006) Obesity and Cardiovascular Disease:
Pathophysiology, Evaluation, and Effect of Weight Loss: An Update of the 1997
American Heart Association Scientific Statement on Obesity and Heart Disease
from the Obesity Committee of the Council on Nutrition, Physical Activity, and
Metabolism. Circulation, 113, 898-918.
https://doi.org/10.1161/CIRCULATIONAHA.106.171016
[4] Gardner, C.D., Kiazand, A., Alhassan, S., et al. (2007) Comparison of the Atkins,
Zone, Ornish, and Learn Diets for Change in Weight and Related Risk Factors
among Overweight Premenopausal Women: The A to Z Weight Loss Study: A
Randomized Trial. JAMA, 297, 969-977. https://doi.org/10.1001/jama.297.9.969
[5] Brehm, B.J., Seeley, R.J., Daniels, S.R. and D’Alessio, D.A. (2003) A Randomized
Trial Comparing a Very Low Carbohydrate Diet and a Calorie-Restricted Low Fat
Diet on Body Weight and Cardiovascular Risk Factors in Healthy Women. The
Journal of Clinical Endocrinology and Metabolism, 88, 1617-1623.
https://doi.org/10.1210/jc.2002-021480
[6] Foster, G.D., Wyatt, H.R., Hill, J.O., et al. (2003) A Randomized Trial of a
Low-Carbohydrate Diet for Obesity. The New England Journal of Medicine, 348,
2082-2090. https://doi.org/10.1056/NEJMoa022207
[7] Stern, L., Iqbal, N., Seshadri, P., et al. (2004) The Effects of Low-Carbohydrate
Versus Conventional Weight Loss Diets in Severely Obese Adults: One-Year Fol-
low-Up of a Randomized Trial. Annals of Internal Medicine, 140, 778-785.
https://doi.org/10.7326/0003-4819-140-10-200405180-00007
[8] Ludwig, D.S. and Ebbeling, C.B. (2018) The Carbohydrate-Insulin Model of Obesi-
ty: Beyond “Calories In, Calories Out”. JAMA Internal Medicine, 178, 1098-1103.
https://doi.org/10.1001/jamainternmed.2018.2933
[9] Shai, I., Schwarzfuchs, D., Henkin, Y., Shahar, D.R., Witkow, S., Greenberg, I., Go-
lan, R., Fraser, D., Bolotin, A., Vardi, H., Tangi-Rozental, O., Zuk-Ramot, R., Sarusi,
B., Brickner, D., Schwartz, Z., Sheiner, E., Marko, R., Katorza, E., Thiery, J., Fiedler,
G.M., Blüher, M., Stumvoll, M. and Stampfer, M.J. (2008) Weight Loss with a
Low-Carbohydrate, Mediterranean, or Low-Fat Diet. The New England Journal of
Medicine, 359, 229-241. https://doi.org/10.1056/NEJMoa0708681
[10] WHO (2016) Global Health Observatory Data Repository (2015, 5.15), IMF World
Economic Outlook Database, October.
[11] Shimizu, F., Ogawa, M., Takao, T., Ishii, Y. and Takada, A. (2016) Correlations
among Various Foods Uptakes and Body Mass Index (BMI) or Plasma Parameters.
Obesity: Open Access, 2, 1-4. https://doi.org/10.16966/2380-5528.123
DOI: 10.4236/fns.2021.126044 600 Food and Nutrition SciencesA. Takada et al.
[12] Ishii, Y., Shimizu, F., Ogawa, M., Takao, T. and Takada, A. (2016) Gender Differ-
ences in Foods Uptakes, Glycemic Index, BMI, and Various Plasma Parameters be-
tween Young Men and Women in Japan. Integrated Foods, Nutrition and Metabol-
ism, 3, 427-430. https://doi.org/10.15761/IFNM.1000163
[13] Shimizu, F., Ishii, Y., Ogawa, M., Takao, T., Matsuoka, K., Kato, K. and Takada, A.
(2017) Relationship between Various Food Uptakes and Body Mass Index (BMI) in
Japanese Young and Old Men and Women. Journal of Clinical Nutrition & Dietet-
ics, 3, 2.
[14] Shimizu, F., Ishii, Y., Ogawa, M., Takao, T., Matsuoka, K., Kato, K. and Takada, A.
(2017) Age and Gender Influence Differently on Various Foods Intakes, Body Mass
Index (BMI), and Levels of Various Plasma Parameters in Young and Old Men and
Women in Japan. Obesity: Open Access, 3, 1-7.
[15] Covas, M.I., Nyyssönen, K., Poulsen, H.E., et al. (2006) The Effect of Polyphenols in
Olive Oil on Heart Disease Risk Factors: A Randomized Trial. Annals of Internal
Medicine, 145, 333-341. https://doi.org/10.7326/0003-4819-145-5-200609050-00006
[16] Templin, T., Cravo Oliveira Hashiguchi, T., Thomson, B., Dieleman, J. and Benda-
vid, E. (2019) The Overweight and Obesity Transition from the Wealthy to the Poor
in Low- and Middle-Income Countries: A Survey of Household Data from 103
Countries. PLOS Medicine, 16, e1002968.
https://doi.org/10.1371/journal.pmed.1002968
[17] Collaboration (NCD-RisC) (2017) Worldwide Trends in Body-Mass Index, Under-
weight, Overweight, and Obesity from 1975 to 2016: A Pooled Analysis of 2416
Population-Based Measurement Studies in 128.9 Million Children, Adolescents, and
Adults. The Lancet, 390, 2627-2642.
[18] Roberto, C.A., Swinburn, B., Hawkes, C., Huang, T.T., Costa, S.A., Ashe, M.,
Zwicker, L., Cawley, J.H. and Brownell, K.D. (2015) Patchy Progress on Obesity
Prevention: Emerging Examples, Entrenched Barriers, and New Thinking. The
Lancet, 385, 2400-2409. https://doi.org/10.1016/S0140-6736(14)61744-X
[19] World Health Organization (2012) A Comprehensive Global Monitoring Frame-
work Including Indicators and a Set of Voluntary Global Targets for the Prevention
and Control of Noncommunicable Diseases. World Health Organization, Geneva.
[20] Chang, A.Y., Riumallo-Herl, C., Salomon, J.A., Resch, S.C., Brenzel, L. and Verguet,
S. (2018) Estimating the Distribution of Morbidity and Mortality of Childhood Di-
arrhea, Measles, and Pneumonia by Wealth Group in Low- and Middle-Income
Countries. BMC Medicine, 16, 102. https://doi.org/10.1186/s12916-018-1074-y
[21] Dinsa, G.D., Goryakin, Y., Fumagalli, E. and Suhrcke, M. (2012) Obesity and Socioe-
conomic Status in Developing Countries: A Systematic Review. Obesity Reviews, 13,
1067-1079. https://doi.org/10.1111/j.1467-789X.2012.01017.x
[22] Deuchert, E., Cabus, S. and Tafreschi, D. (2014) A Short Note on Economic Devel-
opment and Socioeconomic Inequality in Female Body Weight. Health Economics,
23, 861-869. https://doi.org/10.1002/hec.2968
[23] Goryakin, Y., Lobstein, T., James, W.P. and Suhrcke, M. (2015) The Impact of Eco-
nomic, Political and Social Globalization on Overweight and Obesity in the 56 Low
and Middle Income Countries. Social Science & Medicine, 133, 67-76.
https://doi.org/10.1016/j.socscimed.2015.03.030
DOI: 10.4236/fns.2021.126044 601 Food and Nutrition SciencesYou can also read